

Abstract
Objectives
Regulatory mechanisms of cell proliferation have been extensively studied as they represent major challenges when dealing with pathologies such as fibrosis, tumourigenesis or tissue regeneration. Numerous in vitro studies still exploit conventional, two‐dimensional cell cultures where cells are forced to adhere to unnaturally stiff and flat surfaces of culture dishes. In the living organism, however, each cell is in contact with components of the extracellular matrix and/or neighbouring cells, thus creating a complex three‐dimensional (3D) tissue structure. The current paper describes a native 3D culture of cells, based on the GD25β1 fibroblast cell line, and its use for investigating cell proliferation in in vivo‐like conditions.
Materials and methods
Four‐day post‐confluent culture of GD25β1 fibroblasts resulted in formation of a 3D system of cells embedded in naturally synthesized extracellular matrix. Morphological characterization of the culture was performed by histochemistry, immunohistochemistry and immunofluorescence. Viability/proliferation was assayed by MTT testing, FACS analysis and Western blotting for determination of expression levels and activation status of the relevant signalling molecules.
Results
GD25b1 fibroblasts, grown as 3D culture, gave rise to tissue‐like structures characterized by low level of apoptosis, low senescence and development of 3D matrix adhesions, typical of living tissues. Transition to three‐dimensionality led to a switch from exponential to linear culture growth, accompanied by accumulation of activated ERK1/2 into caveolin‐containing raft domains. Disruption of raft domains as well as reverse transition from 3D back to monolayer culture led to release of phosphorylated ERK1/2 from rafts, activation of cyclin D1 expression and increase in proliferation levels.
Conclusions
These results imply that under in vivo‐like conditions, cells might achieve reduction of their proliferation level by sequestering activated ERK1/2 to lipid rafts.
Introduction
Three‐dimensional (3D) cell cultures, resembling natural tissues, can be modelled by mixing different tissue‐specific cells with fabricated artificial scaffolds, or tissue‐specific soluble components, turned into gels either by change in medium composition, pH or temperature 1. Under such conditions, cell organisation partially degrades, and cells rearrange and exert contractile forces on the exogenous 3D scaffold. This mimics natural behaviour in in vivo environments. However, the main disadvantage of these 3D tissue models is their extracellular matrix (ECM), which is not originally synthesized and organized by the cells, thus lacks native ECM structure, complex chemical composition and in turn specific signalling competence, typical for living tissue. Over the few last years, a number of in vivo‐like models that do not require artificial scaffolds have been created. This approach relies on 3D matrices, synthesized and organized naturally by the cultured cells 2. Several groups have demonstrated that under suitable conditions, fibroblasts can be induced to form 3D structures, resembling tissue architecture and in vivo ECM 3, 4. It has been demonstrated that such 3D in vivo‐like culturing conditions influence cell morphology, adhesion and proliferation, with already established differences in signalling, compared to conventional, two‐dimensional substrates 5, 6, 7. Thus, investigation of cells in tissue‐like 3D conditions opens the possibility of better understanding regulatory cascades in healthy tissue and provides a more relevant approach for studying important cell processes such as proliferation.
The main signalling pathway involved in activation of the cell cycle is the Ras/Raf/MEK/ERK signalling cascade 8. Modulation of phosphorylation and localization of ERK1/2 kinases determines whether a cell enters a further round of the cell cycle or not 9, 10, 11, 12. Both ERK1 and 2 are activated by dual phosphorylation on threonine and tyrosine residues, followed by relocalization from the cytoplasm to nucleus 13, 14, 15 where ERKs phosphorylate multiple substrates such as transcription factors Elk1/TCL, c‐Fos or c‐Myc 16. Several lines of evidence indicate that initial steps of this cascade activation and signal propagation take place at the plasma membrane, in caveolin‐containing raft domains 17, 18, 19. In addition, in vitro and in vivo experiments have shown that caveolar components caveolin‐1 and caveolin‐2 are implicated in regulation of signalling molecules responsible for cell proliferation 20, 21, 22, 23, 24. Suppression of caveolin‐1 expression leads to reduction in membrane cholesterol and activation of ERK1/2 25, 26, while forced expression of this transmembrane, scaffolding protein suppresses MAP kinase activation 27 and induces cells to exit S phase of the cycle with concomitant G(0)/G(1) arrest 23. Cholesterol, a further major structural component of lipid rafts, has also been associated with control over proliferation signalling. It has been demonstrated that depleting cholesterol in caveolae with cyclodextrin leads to hyperactivation of ERK1/2, which can be blunted by restoration of membrane cholesterol content 28, 29. Despite accumulated evidence, identifying caveolin‐containing raft domains as signalling platforms exerting negative regulation on the ERK pathway in particular 30, 31, the precise molecular mechanism of this action remains to be defined.
Here, we have used a new type of 3D cell culture, represented by fibroblasts in their naturally synthesized ECM, to study cell proliferation in in vivo‐like settings. Our results indicate that under these conditions, cells achieve slowdown in proliferation by sequestration of phosphorylated ERK1/2 into the caveolin raft domains, without significantly reducing overall level of this activated form of MAP kinase.
Materials and methods
Cell culture
Mouse GD25β1 fibroblast and human embryonic lung P cells were cultured in Dulbecco's modified Eagle's medium (DMEM; Sigma‐Aldrich Chemie GmbH, Steinheim, Germany) containing l‐glutamine, sodium pyruvate and 4500 mg/l glucose. Culture medium was supplemented with 10% foetal bovine serum (FBS; Lonza, Cologne, Germany) and a mixture of antibiotics – penicillin (100 U/ml), streptomycin (100 μg/ml) and amphotericin (0.25 μg/ml). Cells were cultured at 37 °C, 95% humidity and 5% CO2.
For the preparation of 3D cultures, GD25β1 fibroblasts were seeded at 0.6 × 10⁵ cells/cm2 and cultured for an additional 4 days after reaching 100% confluence.
Population doubling time was calculated using the following formula:
where T is the incubation time; X b is the cell number at the beginning of the incubation time; X e is the cell number at the end of the incubation time.
MTT assay
Culture medium was replaced with fresh containing 3‐(4,5‐dimethyl‐2‐thiazolyl)‐2,5‐diphenyl‐2H‐tetrazolium bromide (MTT) (Applichem, Darmstadt, Germany) final concentration 0.5 mg/ml MTT, and incubated for 3 h at 37 °C until purple coloured formazan product was formed. Medium was removed and formazan crystals were solubilized with 10% SDS containing 0.01 M HCl, for 12 h at 37 °C. Quantity of formazan was determined from optical density, measured at 570 nm, with a spectrophotometer (Epoch; Biotek, Bad Friedrichshall, Germany).
Western blotting and antibodies
1 × 10⁶ cells were scraped on ice in 50 μl of RIPA buffer [1% Triton X‐100, 10% glycerol, 0.04% Na‐deoxycholate, 50 mm HEPES c pH 7.5, 0.1% SDS, 2 mm EDTA, 100 mm NaCl, 1 mm NaVO4 and Complete Inhibitory Cocktail (Roche Diagnostics, Mannheim, Germany)]. Equal volumes of 5x sample buffer (60 mm Tris‐HCl, pH 6.8, 2% SDS, 10% glycerol, 5% β‐mercaptoethanol and bromophenol blue) were added and samples were boiled for 4 min at 95 °C. Proteins were resolved on 8% SDS‐PAGE, transferred to nitrocellulose membrane and blocked for 1 h in 5% non‐fat dry milk in TBST (50 mm Tris base, 200 mm NaCl, 0.1% Tween‐20, pH 7.4). Membranes were than incubated with appropriate primary and secondary antibodies, including monoclonal anti‐cyclin D1 (72‐13G; Santa Cruz Biotechnology, Dallas, TX, USA), monoclonal anti‐pERK (E‐4; Santa Cruz Biotechnology), polyclonal anti‐ERK (K‐23; Santa Cruz Biotechnology), monoclonal anti‐caveolin 1 (BD Biosciences, Sparks, MD, USA), monoclonal anti‐α tubulin (TU‐02; Santa Cruz Biotechnology), anti‐mouse IgG (Fab) HRP conjugate (SAB‐100; Enzo Life Sciences, Farmingdale, NY, USA), anti‐rabbit IgG (Fab) HRP conjugate (SAB‐300; Enzo Life Sciences). Immunoblots were visualized using the ECL system (Santa Cruz).
Histochemical, immunohistochemical and immunofluorescence staining
3D matrices were fixed in 4% paraformaldehyde for 20 min at RT. Fixed samples were embedded in paraffin wax, sectioned at 4‐μm, deparaffinized and re‐hydrated. Samples for histochemical staining were stained with haematoxylin for 15 min, washed in running tap water and counterstained with eosin for 2 min. Decellularized matrices were prepared according to Cukierman et al. 2. Samples were stained with Coomassie brilliant blue to visualize ECM proteins.
Immunohistochemical staining was performed using immunochemical rabbit/mouse rapid staining kit (Sigma) according to the manufacturer's instructions. Briefly, endogenous peroxidase was blocked by incubating samples in 3% H2O2 for 5 min. Samples were incubated in primary mouse monoclonal anti‐cyclin D1 (72‐13G; Santa Cruz, dilution 1:50) antibody in PBS with 1% BSA (Sigma) for 10 min at 37 °C followed by reaction with secondary biotin‐labelled antibody for 10 min at 37 °C. Samples were then treated with peroxidase reagent for 5 min at 37 °C, followed by addition of substrate reagent (deionized water:acetate buffer:AEC chromogen:3% H2O2 in proportion 4:2:2:1) for 3 min at 37 °C. Sections were counterstained in 2% methyl green. Negative controls were produced by replacing primary antibody with phosphate‐buffered saline. Both histochemical and immunohistochemical reactions were visualized using an inverted light microscope (Olympus CX21; Olympus FE300 camera, Melville, NY, USA) and micrographs were taken at 400× magnification.
Cells for immunofluorescence were fixed in 4% paraformaldehyde in PBS containing 5% sucrose, for 15 min and permeabilized with 0.5% Triton X‐100 in PBS for 4 min. Immunostaining was performed with anti‐β1 integrin antibody (clone 9EG7; BD Biosciences, Sparks, MD, USA) at room temperature for 1 h, followed by secondary Cy5‐conjugated antibody. Single cell morphology was determined using GD25β1 cells transfected with actin‐mRFP. Stained samples were mounted in Mowiol mounting medium. Immunofluorescence microscopy images were obtained using a Leica confocal microscope (Leica TCS SPE, Wetzlar, Germany) and analyzed using ImageJ software (http://rsb.info.nih.gov/ij/download.html).
Carboxy‐fluorescein diacetate succinimidyl ester (CFSE) staining
Cells were stained using CellTrace CFSE cell proliferation kit (Molecular Probes, Eugene, OR, USA) as recommended by the manufacturer. Briefly, GD25β1 fibroblasts were trypsinized, centrifuged and resuspended in PBS to final concentration 1 × 10⁶ cells/ml. A working solution of 10 μm CFSE in PBS was mixed with equal volume of resuspended cells and incubated for 10 min at 37 °C. 10% FBS was added to the suspension and incubated for 5 min on ice to terminate the reaction. Cells were than cultured as described to produce 3D cultures. Four‐day post‐confluent cultures were trypsinized and analysed with FACS Calibur. Control probes were analysed immediately after staining.
Isolation of detergent‐insoluble membrane fractions
Three‐dimensional cultures and control cells were trypsinized and centrifuged for 5 min at 2000 g. Approximately 15 × 106 cells were resuspended in 250 μl buffer A (25 mm MES (2‐(N‐morpholino)‐ethanesulphonic acid), 150 mm NaCl, pH 6.5) followed by addition of equal volume of buffer A containing 2% Triton X‐100, 2 mm Na3VO4, 2 mm PMSF. Samples were incubated for 30 min on ice and centrifuged for 20 min at 14 000 g at 4 °C. Supernatant, representing the detergent‐soluble fraction, was removed and 125 μl of buffer B (1% Triton X‐100, 2 mm Na3VO4, 1 mm PMSF, 500 mm NaCl, 60 mm β‐octylglucoside and 10 mm Tris pH 7.6) was added to pellets and incubated on ice for 30 min, followed by centrifugation for 20 min at 14 000 g at 4 °C. Supernatant, representing the detergent‐insoluble (raft) membrane fraction, was further subjected to SDS‐PAGE and Western blot analysis as described.
Senescence‐associated β‐galactosidase (SA‐β‐gal) activity assay
SA‐β‐gal activity was examined using a senescent cells histochemical staining kit (Sigma), according to the manufacturer's instructions. Briefly, cells from 100% confluent monolayer and 5‐day‐old 3D culture were seeded on slides at 0.6 × 10⁵ cells/cm2 and incubated for 4 h to allow cell attachment. P cell line after 25th passage was used as a positive control for β‐galactosidase activity. Cells were fixed (2% formaldehyde, 0.2% glutaraldehyde, 7.04 mm Na2HPO4, 1.47 mm KH2PO4, 0.137 M NaCl, and 2.68 mm KCl) for 7 min at room temperature. Slides were then incubated with staining solution (400 mm potassium ferricyanide:400 mm potassium ferrocyanide:solution of X‐gal distilled water at a ratio of 1:1:2:68 respectively). Samples were then incubated for 2 h at 37 °C without additional CO2. After SA‐ β‐gal staining, blue cells were observed and counted using an inverted light microscope (Nikon Eclipse TS100, Amsterdam, the Netherlands) and photographed at 200× magnification.
Cholesterol determination
Cholesterol content of membranes was assayed by gas chromatography using a medium polarity RTX‐65 capillary column (0.32 mm internal diameter, length 30 m, and film thickness 0.25 m). Calibration was achieved by a weighted standard of cholesterol.
Treatment with lovastatin
GD25β1 fibroblasts were seeded at 0.6 × 10⁵ cells/cm2 and cultured for 2 days after reaching 100% confluent monolayer. On 3rd and 4th post‐confluence days, medium was replaced with DMEM (Sigma) containing l‐glutamine, sodium pyruvate and 4500 mg/l glucose, supplemented with 10% cholesterol reduced FBS (HyClone, Logan, UT, USA). Treatment with lovastatin (mevinolin; Sigma) was initiated on the 3rd post‐confluence day.
Statistical analysis
Each experiment was conducted at least in triplicate. Values are expressed as a mean ± SEM. Comparison between differences of means was performed by one‐way ANOVA with Tukey or Bonferroni testing. Data with P < 0.05 are considered significant.
Results
GD25b1 fibroblasts formed three‐dimensional, tissue‐like cell cultures
To develop naturally organized, 3D culture, we had searched for a cell line whose growth was not reduced by contact inhibition and had augmented ability to secrete and organize into ECM. GD25β1 cells, originating from β1−/− GD25 fibroblasts, stably transfected with β1A integrin 32 demonstrated the ability to expand in numbers even after reaching confluence, depositing dense ECM at the same time. MTT assay showed that after reaching 100% confluence (day 1 on Fig. 1a, density of 1.0 × 10⁵ cells/cm2), GD25β1 fibroblasts switched from exponential (doubling time of 17.4 ± 0.2 h) to linear (doubling time at the fifth day of 31.6 ± 2.8 h) growth that could be followed up to 17 days after plating (Fig. 1a). During development of the culture, cells formed substantial, tissue‐like structures, which, by the fifth day of culturing, consisted of about 0.9 × 10⁶ cells/cm2, with no defined layers (Fig. 1b, upper panel), embedded in thick ECM that could be visualized after extraction of the cells (Fig. 1b, lower panel). It should be noted that there were no significant differences between 2D and 3D cell cultures in expression levels of major ECM components (Fig. S1). Tissue‐like properties of the 3D culture were further confirmed by changed general morphology and presence of 3D matrix adhesions, previously observed in vivo and in 3D cultures in vitro 2. Immunofluorescent staining with antibody against activated β1 integrin demonstrated that while dot‐like focal adhesions were the main adhesive contacts in the confluent monolayer (Figs 1c,2d) by the fifth day post‐confluent 3D culture, β1A integrins were predominantly organized in long, tread‐like 3D matrix adhesions (Figs 1c,3d). Concomitantly, we observed changes in morphology and size of cells. While fibroblasts grown in monolayer (2D) had expanded, flat cell bodies with short processes (Figs 1c,2d, inset), cells in 3D culture were about two and a half times smaller, had undersized globular cell bodies and developed long branching processes (Figs 1c,3d, inset).
Figure 1.
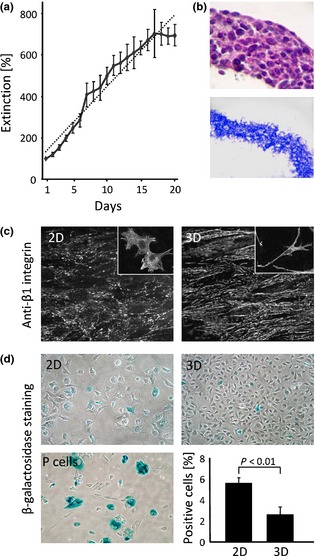
Characterization of the three‐dimensional in vivo ‐like culture, formed by GD25β1 fibroblasts. (a) Growth curve of GD25β1 fibroblasts as 3D culture, determined by MTT assay. Dotted line represents calculated linear growth curve. (b) Haematoxylin/eosin staining of paraffin wax cross‐sections through 3D culture (upper panel) and Coomasie Brilliant Blue staining of decellularized 3D culture (lower panel). (c) Immunofluorescent staining of monolayer (2D) and three‐dimensional (3D) culture with antibody against activated β1 integrin (anti‐β1 integrin). Insets demonstrate general morphology of GD25β1 fibroblasts under 2D and 3D conditions. (d) β ‐galactosidase staining of GD25β1 fibroblasts from monolayer (2D) and three‐dimensional (3D) culture. P‐cell line past 25th passage (P cells) used as a positive control. Blue stained cells represent positive for beta‐galactosidase cells. Graph representing percentage of positive cells in 2D and 3D cultures. Error bars represent ±SE. Results are from at least three independent experiments.
Figure 2.
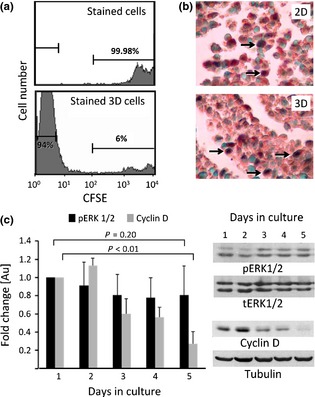
Proliferation features of the three‐dimensional culture. (a) FACS analysis of CSFE stained GD25β1 fibroblasts before plating (stained cells) and after formation of 3D culture (stained 3D cells). (b) Immunohistochemical staining with anti‐cyclin D antibodies of paraffin wax embedded sections from control monolayer culture (2D) and three‐dimensional culture (3D) of GD25β1 fibroblasts. Sections were counterstained with methyl green for visualization of nuclei. Cyclin D positive nuclei appear dark brown (arrows). (c) Western blot analysis of level of activated ERK1/2 (pERK1/2) and expression of cyclin D (cyclin D) in samples prepared at different time points (days in culture) of development of the 3D culture. Internal controls, performed with antibodies against total ERK1/2 (tERK1/2) and tubulin (Tubulin), were used for normalization of loading and determination of fold change of studied molecules (graph). Error bars represent ±SE. Results from at least three independent experiments.
Figure 3.
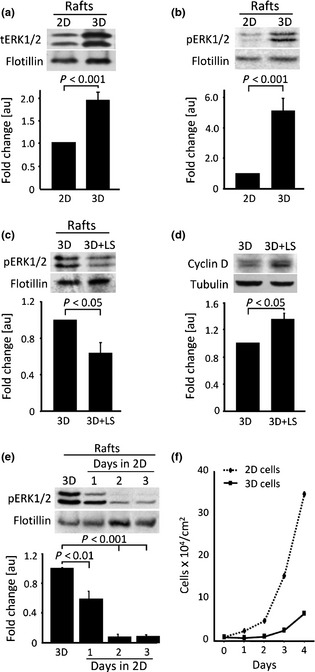
Relationship between proliferation in 3D cell culture and the amount of phosphorylated ERK1/2 localized at lipid rafts. Western blot determination and quantification of the amount of: (a) Total ERK1/2 (tERK1/2) in detergent‐insoluble fraction (Rafts) isolated from monolayer (2D) and three‐dimensional (3D) culture of GD25β1 fibroblasts. Flotillin was used as internal control for determination of the fold change of the amount of total ERK1/2 (graph); (b) Phosphorylated ERK1/2 (pERK1/2) in detergent‐insoluble fraction (Rafts) isolated from monolayer (2D) and three‐dimensional (3D) culture of GD25β1 fibroblasts. Flotillin was used as internal control for determination of the fold change of the amount of phosphorylated ERK1/2 (graph); (c) Phosphorylated ERK1/2 (pERK1/2) in detergent‐insoluble fraction (Rafts) isolated from control three‐dimensional culture (3D) or 3D culture treated with lovastatin (3d + LS). Flotillin was used as internal control for determination of the fold change of the amount of phosphorylated ERK1/2 (graph); (d) Cyclin D in control three‐dimensional culture (3D) or 3D culture treated with lovastatin (3d + LS). Tubulin was used as internal control for determination of the fold change of cyclin D expression (graph); (e) Phosphorylated ERK1/2 (pERK1/2) in detergent‐insoluble fraction (Rafts) isolated from three‐dimensional (3D) culture or cells from 3D culture plated as monolayer for the indicated time periods (days in 2D). Flotillin was used as internal control for determination of the fold change of the amount of phosphorylated ERK1/2 (graph). (f) Growth curve of monolayer GD25β1 fibroblasts (2D cells) and GD25β1 fibroblasts from three‐dimensional culture (3D cells) plated under conventional monolayer conditions. Error bars represent ±SE. The results are from at least three independent experiments.
Linear growth of the 3D cell population, as a consequence of slowed proliferation, could have been a result of adverse conditions during the culturing process. 3D culture could be suffering from lack of nutrients, cell ageing or apoptosis. To test these possibilities, we cultured GD25β1 fibroblasts in media with higher glucose (1×, 2× or 3×; 4.5, 9 or 13.5 g/l respectively), amino acids (2× and 4×) or serum (10%, 20% and 40%) concentrations. Increased nutrients did not result in statistically significant change in proliferation levels (Fig. S2). Thus, we concluded that the main nutritious components were not the factor, limiting proliferation in 3D cultures. This result was further supported by flow cytometry data, indicating early apoptotic cells of around 5% in 2D and 3% in 3D cutures (Fig. S3a). More detailed study of the apoptotic process indicated statistically significant 3‐fold reduction in amounts of active caspase 3 in 5‐day‐old 3D culture compared to cells grown as a monolayer (Fig. S3b). An even stronger reduction of this apoptotic marker was observed in 3D cultures by the tenth day of culturing. Cell ageing, a physiological process that could lead to cell lower proliferation in the culture, was also investigated by determining β‐galactosidase activity. Embryonic P cell line after passage 25 was used as a positive control 33. Results showed 5.5% ageing cells in confluent monolayer culture and 2.6% (P < 0.01) ageing cells in 3D culture (Fig. 1d), hence culturing in 3D conditions was even protective against ageing and could not account for the observed switch from exponential to linear growth. Taken together, these results indicated that culturing GD25β1 fibroblasts for 5 days (4 days post‐confluency) was sufficient to produce a large fibroblast population, embedded in naturally synthesized ECM, mimicking general features of 3D organization of living tissues; therefore, this time point was selected for all further experiments.
Reduced proliferation in 3D cell culture was not a result of suppressed ERK1/2 phosphorylation
The switch from exponential to linear growth, established for 3D culture, could be an indication that division was restricted to a fixed number of cells only. Indeed, calculations from the growth curve specified that up to the 12th post‐confluence day, the mean number of dividing cells remained about 1 × 10⁵ ± 0.1 cells/cm2 per day. A possibility existed that an identical, small population of cells with strong proliferation capacity underwent cell divisions, thus accounting for linear growth of 3D culture. To test this presumption, we determined numbers of cell divisions, performed by every cell during formation of 3D cultures. GD25β1 fibroblasts were stained with the vital dye CFSE, plated and cultured for 5 days. This is suitable for proliferation monitoring due to its ability to couple to intracellular proteins, thus halving mother cell fluorescence within daughter cells, during each cell division. Flow cytometric analysis of fluorescence intensity revealed that 94% of cells exhibited similarly reduced fluorescence after 5 days culturing, whereas only 6% of cells had preserved a level comparable to initial high fluorescence intensity (Fig. 2a). These results demonstrated that almost all cells in the 3D culture had been involved in identical numbers of cell divisions and ruled out the possibility of existence of a cell subpopulation with unique proliferation potential.
The established constant number of proliferating cells could also be related to presence of specific locations within the 3D culture where more favourable conditions for cell growth existed (for example, surface of the culture). To examine this possibility, we performed immunohistochemical analysis with antibodies against cyclin D1 – one of the main regulators of cell cycle progression 34. Results showed that dividing fibroblasts were diffusely dispersed throughout the 3D culture and were not localized as a confined population (Fig. 2b, lower panel).
Ruling out the existence of a discrete population and a specific location, related to cell proliferation within the 3D culture, we looked for changes in main signalling molecules, involved in cell cycle regulation. Western blot analysis revealed gradual reduction in cyclin D1 expression reaching 70% (P < 0.01) by the fifth day of development of the 3D culture, compared to a confluent monolayer (day 1), confirming the observed constant decrease in dividing cells (Fig. 2c). Main upstream kinases in the signalling pathway, regulating cyclin D1 expression are ERK1/2 9. Positive dependence between cyclin D1 expression and phosphorylation of ERK1/2 at Thr202/185 and Tyr204/187 has been repeatedly confirmed in cell cultures and in vivo experiments. Unexpectedly, level of ERK1/2 activation in the GD25β1 fibroblasts from the 3D culture did not show correlative changes that could account for established suppression of cyclin D1 expression. Western blot analysis with phosphospecific antibody indicated only slight reduction in phospho ERK1/2 throughout the 5‐day period of development of the 3D culture, but the registered changes were not statistically significant (Fig. 2c). The established discrepancy prompted us to investigate further the role of ERK1/2 in 3D cell proliferation.
Proliferation in 3D cell culture showed inverse correlation with ERK1/2 localization in lipid rafts
ERK1/2 exerts its kinase activity on a wide range of substrates, localized in different cell compartments, including induction of cell proliferation after translocation to the nucleus, through active and passive processes 16, 35. Strong suppression of cyclin D1 expression combined with unchanged levels of ERK1/2 phosphorylation in the 3D culture implied a possibility for inhibited nuclear translocation of ERK1/2 and plausible localization in other cell compartments.
Our previous results, performed on GD25β1 fibroblasts grown in 3D culture, showed 30% increase in membrane cholesterol as well as sphingomyelin content, both being major lipid components of membrane raft domains 7. As caveolae have been related to the ERK1/2 signalling cascade 17, we analyzed caveolin content of the 3D cell culture. Experiments showed almost double total caveolin 1 levels (P < 0.01) when compared to confluent control monolayer culture (Fig. S4). This result was in accordance with our previous data indicating increased presence of lipid rafts in 3D cells. To test for possible confinement of ERK1/2 within caveolin containing rafts, we prepared detergent‐insoluble membrane fractions and probed them with antibody against total and phosphorylated ERK1/2. Western blotting results demonstrated double total ERK1/2 and 5‐fold (P < 0.05) increase of activated ERK1/2 in the raft fraction of GD25β1 fibroblasts in the 3D culture compared to 2D confluent monolayers (Fig. 3a,b). This significant enrichment of 3D rafts with phosphoERK1/2 was in accordance with our hypothesis of hampered nuclear translocation of the activated form of this kinase. To test it further, we used lovastatin, an inhibitor of enzyme HMGR (3‐hydroxy‐3‐methylglutaryl CoA reductase) of the mevalonate pathway 36, to reduce levels of cholesterol by inhibiting its biosynthesis and as a consequence – to perturb lipid rafts. As lovastatin induces G1 arrest in normal and malignant cell, cultured as conventional monolayers 37, treatment of GD25β1 fibroblasts was initiated after 3 days post‐confluence culturing, and was continued for an additional 2 days. Addition of 2.5 μm lovastatin to culture medium led to reduction in membrane cholesterol content by almost 50% (0.477 ± 0.021 μg/mg cholesterol/total phospholipids in non‐treated and 0.235 ± 0.017 μg/mg cholesterol/total phospholipids in lovastatin‐treated 3D culture cells) and parallel decrease by 40% of phosphorylated ERK1/2, localized at the detergent‐insoluble membrane fraction (Fig. 3c). Concomitantly, total level of phosphoERK1/2 remained unchanged in both treated and untreated 3D cultures (Fig. S5). Probing for changes in proliferation and cyclin D1 expression, we registered 18% increase in proliferation of 3D cultures at the end of lovastatin treatment (Fig. 5b) and increase in cyclin D1 expression by 37% (P < 0.05) (Fig. 3d). These results confirmed the existence of an inverse correlation between phosphoERK1/2 localization in lipid rafts and proliferation level of the 3D culture cells and supported our initial hypothesis that regulation of cell division in tissue‐like 3D culture is controlled, at least in part, by this specific sequestration of activated ERK1/2.
To test this hypothesis under more physiological conditions and without the use of inhibitors that may have adverse side effects, we performed ‘reverse’ experiments. We cultured fibroblasts derived from 5‐day‐old 3D cultures, back as a monolayer to promote exponential growth. During the first 24 h, there was no change in proliferation levels, followed by a slight increase in cell population growth during day 2 and just at day 3, restoration of exponential growth, characteristic for monolayer cultures, was observed (Fig. 3f). According to our hypothesis, restoration of exponential growth should be preceded by dissociation of ERK1/2 from lipid raft domains, thus leading to activation of cyclin D1 expression. Western blot analyses confirmed that 24 h after transition from 3D to 2D environment, levels of phosphorylated ERK1/2 in the detergent‐resistant fraction reduced by 40% (P < 0.01), reaching only 8% on day 2 after the transition (Fig. 3e). Four‐fold increase in level of cyclin D1 was also observed 24 h after the transition of cells to monolayer conditions (Fig. S6), proving our initial suggestion for a specific role of raft‐confined ERK in proliferation of cells in 3D tissue‐like culture.
Discussion
Conventional cell culturing has been used for decades as a method of growing cells outside the living organism. Taking a cell from the soft and elastic environment of the tissue and introducing it to the rigid adhesive surface of a culture vessel induces numerous adjustments in signalling pathways, manifest as changes in cell metabolism, physiology and behaviour, necessary for adaptation to the new environment. We described in this article that a 3D culture, based on GD25β1 fibroblasts, provided an environment, resembling normal healthy tissue, thus allowing study of cell processes in in vivo‐like settings. Native ECM, naturally synthesized and organized by the fibroblasts, presented a better environment for overall cell existence. 3D culturing did not induce cell ageing, but quite the contrary, led to reduction in number of aged cells observed in the 3D culture, compared to monolayer culture. These results correlate well with the data presented by Herbig et al., showing only 2% ageing cells in subcutaneous parts of skin biopsies of young primates 38. Investigation of apoptosis in native 3D cultures even showed reduction of this process compared to conventional monolayer cultures. Furthermore, addition of excess of glucose, amino acids or serum did not influence development of the 3D culture, and yet, culturing GD25β1 fibroblasts under these conditions resulted in a switch from exponential to linear growth. Established alterations in 3D cells brought them closer to in vivo states where fibroblasts divide seldom and have smaller body size, compared to in vitro conditions 39, and organize specific 3D matrix adhesions 2. Thus, the 3D cell culture model developed provided a useful tool for studying cell proliferation in tissue‐like environment.
A possible explanation of growth of the 3D culture could be change in the substrate's stiffness. Studies have already confirmed that natural 3D matrices are significantly softer than 2D surfaces 2, and are capable of reducing cell proliferation 40. It should be noted, however, that results for proliferation in 3D conditions vary and depend strongly on the method of the 3D culture preparation. Growing primary human fibroblasts in mouse cell‐derived matrices, which have been denuded of mouse cells, results in increased proliferation 2. Probably, even though a naturally synthesized and soft ECM is being used, during processes of preparation, cell debris still remain meshed with fibres of the matrix, creating an environment resembling injured tissue. Such surroundings would stimulate fibroblast activation and proliferation. In support of this possibility is our finding indicating increased expression of α smooth muscle actin in cells grown in denuded matrices, and considerably suppressed expression of this marker for fibroblast proliferation in GD25β1 3D culture, where denudation was not applied (our unpublished results). All these data indicate that environmental rigidity and method of production of 3D culture preparation are crucial factors to be considered in the creation of in vivo‐like culturing conditions, but still did not provide the molecular basis, underlying the observed reduction in cell proliferation in the present study.
The approximately constant number of dividing cells (about 1 × 10⁵ cells/cm2 per day) in growing 3D culture suggests steady decline in percentage of proliferating cells with advancement of culturing days. This, along with the finding that almost all cells in the 3D culture underwent the same number of cell divisions, implies restriction of entry into S phase of the cell cycle. Accordingly, we found a reduction of up to 70% cyclin D expression after 5 days culture under 3D conditions. D‐type cyclins are synthesized in response to growth factor stimulation and are rapidly degraded when mitogens are withdrawn 41. Yet, increasing the amount of serum to 20% or even 40% did not influence growth rate of 3D cultures, implying that availability of growth factors was not the critical factor, responsible for cyclin D reduction. Furthermore, the steady‐state levels of phosphorylated ERK1/2 in 3D cells, which is the upstream regulator of cyclin D expression 42 was comparable to the level, established for proliferating cells, grown as a conventional monolayer (Fig. S7). A possible reason for the registered low cyclin D1 expression could be related to cytoplasmic or membrane retention of activated ERK1/2 kinase, leading to impaired nuclear translocation – an obligatory event for cyclin production 43. Our previous results showed increase of membrane cholesterol and sphingomyelin in GD25β1 fibroblasts, grown as a 3D culture, suggesting increased relative content of lipid raft domains 7. At the same time, here, we have demonstrated that these culturing conditions led to almost double content of caveolin – another raft component, related to the mitogen‐activated protein kinase cascade. Probing the detergent‐resistant membrane fraction for presence of activated ERK1/2, we found 5‐fold increase of this kinase in the raft fraction, isolated from the 3D culture. Likewise, immunoelectron microscopy studies have shown that ERK1/2 is concentrated in plasma membrane caveolae 17. In addition, research based on epithelial cells has revealed translocation of phosphorylated ERK1/2 to caveolin lipid rafts due to reduction in substrate rigidity 44. As cells in 3D culture are surrounded by naturally soft ECM, all these results suggest that accumulation of activated ERK1/2 into lipid rafts of different cell types may be a common phenomenon, taking place when the substrate stiffness is low. At present, the precise molecular interactions responsible for raft localization of ERK1/2 remain uncertain. It could be achieved either through direct interaction with caveolin scaffolding domain or could be mediated by lipids or other members of the ERK1/2 signalling cascade, which also have been identified as caveolae components 17, 20.
According to the widely accepted hypothesis, caveolin 1 scaffolding domain generally acts as an inhibitor of signalling molecules, present in caveolae 45. In some specific cases, involving ERK1/2, activation is registered, but it is followed by rapid departure from caveolae and appearance of the activated enzyme in the cytoplasm 17. These data do not agree with our results demonstrating steady‐state levels of active ERK1/2 confined in caveolin‐containing raft domains. Thus, we tend to concur with the notion of Liu et al., suggesting that caveolin probably modulates signal transduction through an interaction with raft lipids rather than raft proteins 46. As the molecular order and lateral lipid organization of raft domains isolated from GD25β1 3D culture are different from rafts obtained from monolayer GD25β1 cells 47, it is quite possible that specific interactions, typical for a 3D in vivo‐like environment, are responsible for retention of total as well as activated ERK1/2 in the detergent‐resistant membrane fraction of the 3D culture.
These findings support our hypothesis that ERK1/2 might be sequestered in membrane raft domains of fibroblasts, grown in a soft and elastic environment of native 3D culture, which in turn prevented it from nuclear translocation and stimulation of cell proliferation. To further assess this possibility and to verify physiological significance of this retarded nuclear import of ERK1/2, we reduced relative content of raft domains by interfering with cholesterol biosynthesis. Treatment with lovastatin caused reduction of cholesterol content and decrease of raft‐associated active ERK1/2 by 40%, but without changes in total level of activated form of this kinase. Unlike well‐established in vitro and in vivo effect of statins, where suppression of cell proliferation is observed 48, we found small (18%) but statistically significant increases in proliferation in the in vivo‐like 3D culture accompanied by increase in cyclin D expression. It should be noted that these results were obtained after treatment with low concentrations of lovastatin (2.5 μm) in cholesterol‐lacking medium – conditions that were sufficient to interfere with cholesterol synthesis, but probably mild enough to induce G1 arrest for which much higher concentrations of lovastatin are required 48. Established inverse correlation between amounts of raft‐confined phosphorylated ERK1/2 and cell proliferation in the 3D culture was further confirmed by changing culture conditions – from 3D, back to conventional monolayer. Plating trypsinized cells from 3D culture on flat and rigid surface of a conventional Petri dish, induced reversal of linear growth back to exponential proliferation. This was preceded by a longer lag phase than that exhibited by control cells and clearly displayed 5‐fold reduction in the amount of activated ERK1/2 present in the raft fraction.
In conclusion, our findings suggest that cells, grown in 3D in vivo‐like conditions, may use additional mechanism for controlling cell proliferation. It involves confinement of activated ERK1/2 into caveolin‐containing membrane raft domains, thus preventing its nuclear translocation, stimulation of cyclin D expression and cell cycle entry. At present, we cannot rule out the possibility that raft‐localized and activated ERK1/2 fulfils other functions related to the existence of cells in a 3D, in vivo‐like environment. Further research, employing in vivo experiments or studies using 3D cultures, approximating in vivo conditions, as those used in this work, will clarify this possibility.
Supporting information
Fig. S1 Expression levels of major extracellular matrix components in three‐dimensional cell culture.
Fig. S2 Characterization of the growth properties of the three‐dimensional culture in the presence of increased amounts of nutrients.
Fig. S3 Evaluation of the apoptosis in GD25β1 fibroblasts, grown as 3D culture.
Fig. S4 Characterization of caveolin content of the 3D cell culture.
Fig. S5 Effect of lovastatin treatment on proliferation of GD25β1 fibroblasts, grown as 3D culture.
Fig. S6 Changes in cyclin D1 expression during transition from 3D culture to conventional monolayer.
Fig. S7 Evaluation of the steady‐state level of ERK1/2 phosphorylation in GD25β1 fibroblasts, grown as 3D culture.
Acknowledgements
This work is supported by Grant № ДДBУ02/9 by the Bulgarian National Science Fund.
References
- 1. Evangelatov A, Pankov R (2013) The evolution of three‐dimensional cell cultures towards unimpeded regenerative medicine and tissue engineering. In: Andrades JA, ed. Regenerative Medicine and Tissue Engineering, ISBN: 978‐953‐51‐1108‐5, InTech. http://www.intechopen.com/books/regenerative-medicine-and-tissueengineering/the-evolution-of-three-dimensional-cell-cultures-towardsunimpeded-regenerative-medicine-and-tissue (accessed 8 May 2014). [Google Scholar]
- 2. Cukierman E, Pankov R, Stevens DR, Yamada KM (2001) Taking cell‐matrix adhesions to the third dimension. Science 294, 1708–1712. [DOI] [PubMed] [Google Scholar]
- 3. Ahlfors J‐EW, Billiar KL (2007) Biomechanical and biochemical characteristics of a human fibroblast‐produced and remodeled matrix. Biomaterials 28, 2183–2191. [DOI] [PubMed] [Google Scholar]
- 4. Clark RA, McCoy GA, Folkvord JM, McPherson JM (1997) TGF‐beta 1 stimulates cultured human fibroblasts to proliferate and produce tissue‐like fibroplasia: a fibronectin matrix‐dependent event. J. Cell. Physiol. 170, 69–80. [DOI] [PubMed] [Google Scholar]
- 5. Cukierman E, Pankov R, Yamada KM (2002) Cell interactions with three‐dimensional matrices. Curr. Opin. Cell Biol. 14, 633–639. [DOI] [PubMed] [Google Scholar]
- 6. Damianova R, Stefanova N, Cukierman E, Momchilova A, Pankov R (2008) Three‐dimensional matrix induces sustained activation of ERK1/2 via Src/Ras/Raf signaling pathway. Cell Biol. Int. 32, 229–234. [DOI] [PubMed] [Google Scholar]
- 7. Stefanova N, Staneva G, Petkova D, Lupanova T, Pankov R, Momchilova A (2009) Cell culturing in a three‐dimensional matrix affects the localization and properties of plasma membrane cholesterol. Cell Biol. Int. 33, 1079–1086. [DOI] [PubMed] [Google Scholar]
- 8. Meloche S, Pouyssegur J (2007) The ERK1/2 mitogen‐activated protein kinase pathway as a master regulator of the G1‐ to S‐phase transition. Oncogene 26, 3227–3239. [DOI] [PubMed] [Google Scholar]
- 9. Lavoie JN, L'Allemain G, Brunet A, Muller R, Pouyssegur J (1996) Cyclin D1 expression is regulated positively by the p42/p44MAPK and negatively by the p38/HOGMAPK pathway. J. Biol. Chem. 271, 20608–20616. [DOI] [PubMed] [Google Scholar]
- 10. Murphy LO, Blenis J (2006) MAPK signal specificity: the right place at the right time. Trends Biochem. Sci. 31, 268–275. [DOI] [PubMed] [Google Scholar]
- 11. Balmanno K, Cook SJ (1999) Sustained MAP kinase activation is required for the expression of cyclin D1, p21Cip1 and a subset of AP‐1 proteins in CCL39 cells. Oncogene 18, 3085–3097. [DOI] [PubMed] [Google Scholar]
- 12. Harding A, Tian T, Westbury E, Frische E, Hancock JF (2005) Subcellular localization determines MAP kinase signal output. Curr. Biol. 15, 869–873. [DOI] [PubMed] [Google Scholar]
- 13. Chen RH, Sarnecki C, Blenis J (1992) Nuclear localization and regulation of erk‐ and rsk‐encoded protein kinases. Mol. Cell. Biol. 12, 915–927. [DOI] [PMC free article] [PubMed] [Google Scholar]
- 14. Lenormand P, Sardet C, Pages G, L'Allemain G, Brunet A, Pouyssegur J (1993) Growth factors induce nuclear translocation of MAP kinases (p42mapk and p44mapk) but not of their activator MAP kinase kinase (p45mapkk) in fibroblasts. J. Cell Biol. 122, 1079–1088. [DOI] [PMC free article] [PubMed] [Google Scholar]
- 15. Gonzalez FA, Seth A, Raden DL, Bowman DS, Fay FS, Davis RJ (1993) Serum‐induced translocation of mitogen‐activated protein kinase to the cell surface ruffling membrane and the nucleus. J. Cell Biol. 122, 1089–1101. [DOI] [PMC free article] [PubMed] [Google Scholar]
- 16. Roskoski R Jr (2012) ERK1/2 MAP kinases: structure, function, and regulation. Pharmacol. Res. 66, 105–143. [DOI] [PubMed] [Google Scholar]
- 17. Liu P, Ying Y, Anderson RG (1997) Platelet‐derived growth factor activates mitogen‐activated protein kinase in isolated caveolae. Proc. Natl. Acad. Sci. USA 94, 13666–13670. [DOI] [PMC free article] [PubMed] [Google Scholar]
- 18. Boscher C, Nabi IR (2012) Caveolin‐1: role in cell signaling. Adv. Exp. Med. Biol. 729, 29–50. [DOI] [PubMed] [Google Scholar]
- 19. Yang N, Huang Y, Jiang J, Frank SJ (2004) Caveolar and lipid raft localization of the growth hormone receptor and its signaling elements: impact on growth hormone signaling. J. Biol. Chem. 279, 20898–20905. [DOI] [PubMed] [Google Scholar]
- 20. Engelman JA, Chu C, Lin A, Jo H, Ikezu T, Okamoto T et al (1998) Caveolin‐mediated regulation of signaling along the p42/44 MAP kinase cascade in vivo. A role for the caveolin‐scaffolding domain. FEBS Lett. 428, 205–211. [DOI] [PubMed] [Google Scholar]
- 21. Drab M, Verkade P, Elger M, Kasper M, Lohn M, Lauterbach B et al (2001) Loss of caveolae, vascular dysfunction, and pulmonary defects in caveolin‐1 gene‐disrupted mice. Science 293, 2449–2452. [DOI] [PubMed] [Google Scholar]
- 22. Galbiati F, Volonte D, Engelman JA, Watanabe G, Burk R, Pestell RG et al (1998) Targeted downregulation of caveolin‐1 is sufficient to drive cell transformation and hyperactivate the p42/44 MAP kinase cascade. EMBO J. 17, 6633–6648. [DOI] [PMC free article] [PubMed] [Google Scholar]
- 23. Galbiati F, Volonte D, Liu J, Capozza F, Frank PG, Zhu L et al (2001) Caveolin‐1 expression negatively regulates cell cycle progression by inducing G(0)/G(1) arrest via a p53/p21(WAF1/Cip1)‐dependent mechanism. Mol. Biol. Cell 12, 2229–2244. [DOI] [PMC free article] [PubMed] [Google Scholar]
- 24. Xie L, Frank PG, Lisanti MP, Sowa G (2010) Endothelial cells isolated from caveolin‐2 knockout mice display higher proliferation rate and cell cycle progression relative to their wild‐type counterparts. Am. J. Physiol. Cell Physiol. 298, C693–C701. [DOI] [PMC free article] [PubMed] [Google Scholar]
- 25. Ballard‐Croft C, Locklar AC, Kristo G, Lasley RD (2006) Regional myocardial ischemia‐induced activation of MAPKs is associated with subcellular redistribution of caveolin and cholesterol. Am. J. Physiol. Heart Circ. Physiol. 291, H658–H667. [DOI] [PubMed] [Google Scholar]
- 26. Volonte D, Liu Y, Galbiati F (2005) The modulation of caveolin‐1 expression controls satellite cell activation during muscle repair. FASEB J. 19, 237–239. [DOI] [PubMed] [Google Scholar]
- 27. Fujita Y, Maruyama S, Kogo H, Matsuo S, Fujimoto T (2004) Caveolin‐1 in mesangial cells suppresses MAP kinase activation and cell proliferation induced by bFGF and PDGF. Kidney Int. 66, 1794–1804. [DOI] [PubMed] [Google Scholar]
- 28. Furuchi T, Anderson RG (1998) Cholesterol depletion of caveolae causes hyperactivation of extracellular signal‐related kinase (ERK). J. Biol. Chem. 273, 21099–21104. [DOI] [PubMed] [Google Scholar]
- 29. Kabouridis PS, Janzen J, Magee AL, Ley SC (2000) Cholesterol depletion disrupts lipid rafts and modulates the activity of multiple signaling pathways in T lymphocytes. Eur. J. Immunol. 30, 954–963. [DOI] [PubMed] [Google Scholar]
- 30. Quest AF, Leyton L, Parraga M (2004) Caveolins, caveolae, and lipid rafts in cellular transport, signaling, and disease. Biochem. Cell Biol. 82, 129–144. [DOI] [PubMed] [Google Scholar]
- 31. Razani B, Woodman SE, Lisanti MP (2002) Caveolae: from cell biology to animal physiology. Pharmacol. Rev. 54, 431–467. [DOI] [PubMed] [Google Scholar]
- 32. Pankov R, Cukierman E, Clark K, Matsumoto K, Hahn C, Poulin B et al (2003) Specific beta1 integrin site selectively regulates Akt/protein kinase B signaling via local activation of protein phosphatase 2A. J. Biol. Chem. 278, 18671–18681. [DOI] [PubMed] [Google Scholar]
- 33. Debacq‐Chainiaux F, Erusalimsky JD, Campisi J, Toussaint O (2009) Protocols to detect senescence‐associated beta‐galactosidase (SA‐betagal) activity, a biomarker of senescent cells in culture and in vivo. Nat. Protoc. 4, 1798–1806. [DOI] [PubMed] [Google Scholar]
- 34. Quelle DE, Ashmun RA, Shurtleff SA, Kato JY, Bar‐Sagi D, Roussel MF et al (1993) Overexpression of mouse D‐type cyclins accelerates G1 phase in rodent fibroblasts. Genes Dev. 7, 1559–15571. [DOI] [PubMed] [Google Scholar]
- 35. Yoon S, Seger R (2006) The extracellular signal‐regulated kinase: multiple substrates regulate diverse cellular functions. Growth Factors 24, 21–44. [DOI] [PubMed] [Google Scholar]
- 36. Singh RP, Kumar R, Kapur N (2003) Molecular regulation of cholesterol biosynthesis: implications in carcinogenesis. J. Environ. Pathol. Toxicol. Oncol. 22, 75–92. [DOI] [PubMed] [Google Scholar]
- 37. Keyomarsi K, Sandoval L, Band V, Pardee AB (1991) Synchronization of tumor and normal cells from G1 to multiple cell cycles by lovastatin. Cancer Res. 51, 3602–3609. [PubMed] [Google Scholar]
- 38. Herbig U, Ferreira M, Condel L, Carey D, Sedivy JM (2006) Cellular senescence in aging primates. Science 311, 1257. [DOI] [PubMed] [Google Scholar]
- 39. Echave P, Conlon IJ, Lloyd AC (2007) Cell size regulation in mammalian cells. Cell Cycle 6, 218–224. [DOI] [PubMed] [Google Scholar]
- 40. Ghosh K, Pan Z, Guan E, Ge S, Liu Y, Nakamura T et al (2007) Cell adaptation to a physiologically relevant ECM mimic with different viscoelastic properties. Biomaterials 28, 671–679. [DOI] [PMC free article] [PubMed] [Google Scholar]
- 41. Sherr CJ (1994) G1 phase progression: cycling on cue. Cell 79, 551–555. [DOI] [PubMed] [Google Scholar]
- 42. Lavoie JN, Rivard N, L'Allemain G, Pouyssegur J (1996) A temporal and biochemical link between growth factor‐activated MAP kinases, cyclin D1 induction and cell cycle entry. Prog. Cell Cycle Res. 2, 49–58. [DOI] [PubMed] [Google Scholar]
- 43. Brunet A, Roux D, Lenormand P, Dowd S, Keyse S, Pouyssegur J (1999) Nuclear translocation of p42/p44 mitogen‐activated protein kinase is required for growth factor‐induced gene expression and cell cycle entry. EMBO J. 18, 664–674. [DOI] [PMC free article] [PubMed] [Google Scholar]
- 44. Wei WC, Hsu YC, Chiu WT, Wang CZ, Wu CM, Wang YK et al (2008) Low substratum rigidity of collagen gel promotes ERK phosphorylation via lipid raft to augment cell migration. J. Cell. Biochem. 103, 1111–1124. [DOI] [PubMed] [Google Scholar]
- 45. Okamoto T, Schlegel A, Scherer PE, Lisanti MP (1998) Caveolins, a family of scaffolding proteins for organizing “preassembled signaling complexes” at the plasma membrane. J. Biol. Chem. 273, 5419–5422. [DOI] [PubMed] [Google Scholar]
- 46. Liu P, Rudick M, Anderson RG (2002) Multiple functions of caveolin‐1. J. Biol. Chem. 277, 41295–41298. [DOI] [PubMed] [Google Scholar]
- 47. Staneva G, Lupanova T, Chachaty C, Petkova D, Koumanov K, Pankov R et al (2011) Structural organization of plasma membrane lipids isolated from cells cultured as a monolayer and in tissue‐like conditions. J. Colloid Interface Sci. 359, 202–209. [DOI] [PubMed] [Google Scholar]
- 48. Javanmoghadam‐Kamrani S, Keyomarsi K (2008) Synchronization of the cell cycle using lovastatin. Cell Cycle 7, 2434–2440. [DOI] [PubMed] [Google Scholar]
Associated Data
This section collects any data citations, data availability statements, or supplementary materials included in this article.
Supplementary Materials
Fig. S1 Expression levels of major extracellular matrix components in three‐dimensional cell culture.
Fig. S2 Characterization of the growth properties of the three‐dimensional culture in the presence of increased amounts of nutrients.
Fig. S3 Evaluation of the apoptosis in GD25β1 fibroblasts, grown as 3D culture.
Fig. S4 Characterization of caveolin content of the 3D cell culture.
Fig. S5 Effect of lovastatin treatment on proliferation of GD25β1 fibroblasts, grown as 3D culture.
Fig. S6 Changes in cyclin D1 expression during transition from 3D culture to conventional monolayer.
Fig. S7 Evaluation of the steady‐state level of ERK1/2 phosphorylation in GD25β1 fibroblasts, grown as 3D culture.