

Abstract
Objectives: Transplantation of endothelial progenitor cells (EPCs) is a promising approach for revascularization of tissue. We have used a natural and biocompatible biopolymer, fibrin, to induce cell population growth, differentiation and functional activity of EPCs.
Materials and methods: Peripheral blood mononuclear cells were cultured for 1 week to obtain early EPCs. Fibrin was characterized for stiffness and capability to sustain cell population expansion at different fibrinogen–thrombin ratios. Viability, differentiation and angiogenic properties of EPCs were evaluated and compared to those of EPCs grown on fibronectin.
Results: Fibrin had a nanometric fibrous structure forming a porous network. Fibrinogen concentration significantly influenced fibrin stiffness and cell growth: 9 mg/ml fibrinogen and 25 U/ml thrombin was the best ratio for enhanced cell viability. Moreover, cell viability was significantly higher on fibrin compared to being on fibronectin. Even though no significant difference was observed in expression of endothelial markers, culture on fibrin elicited marked induction of stem cell markers OCT 3/4 and NANOG. In vitro angiogenesis assay on Matrigel showed that EPCs grown on fibrin retain angiogenetic capability as EPCs grown on fibronectin, but significantly better release of cytokines involved in cell recruitment was produced by EPC grown on fibrin.
Conclusion: Fibrin is a suitable matrix for EPC growth, differentiation and angiogenesis capability, suggesting that fibrin gel may be very useful for regenerative medicine.
Introduction
A consistent limitation of cell therapy is the very low rate of sustained cell engraftment, initially caused by mechanical leakage of cells (1). Biodegradable scaffolds providing in situ cell retention and avoiding non‐specific homing are required in cell therapy applications. Fibrin, obtained by enzymatic polymerization of fibrinogen, catalysed by thrombin, is a natural biocompatible biopolymer (2), suitable for healing and angiogenesis (3), utilizing the body’s natural healing capacity. Fibrin supports population expansion, migration and proliferation of several cell types including endothelial cells (4), fibroblasts (5), keratinocytes (6), myofibroblasts (7) and mesenchymal stem cells (8). Moreover, fibrin itself has been shown to promote angiogenesis and perfusion in animal models of hind limb ischaemia (9); it has also been used as a cell delivery vehicle to reduce ischaemic myocardium (10, 11, 12, 13). We have recently demonstrated that a fibrin composite scaffold provides local and controlled spatial–temporal release of vascular endothelial growth factor (VEGF) and bFGF (14, 15).
An increased body of data from the first report of endothelial progenitor cells (EPCs) (16), suggests that these cells, mobilized from bone marrow into peripheral blood, contribute to vascular repair and have an emerging role in cardiovascular diseases (17). However, there is significant heterogeneity among EPC populations. Peripheral blood indeed contains at least two types of EPC, defined as early and late, with different morphologies, growth patterns and functional properties (18). They are obtained by in vitro culture using different coatings and media. In particular, early EPCs appear within 4–7 days culture of mononuclear cells, express both endothelial and monocytic markers (CD31; von Willebrand factor, vWF; vascular endothelial cadherin, VE‐cadherin; kinase‐derived receptor, KDR; CD14) (19) and release proangiogenic growth factors, such as VEGF and hepatocyte growth factor (HGF), resulting in enhanced angiogenesis (19, 20). They typically do not display colony formation, and neither proliferate nor form vascular tubules even if they can participate in tubule formation with endothelial cells (21, 22). Late EPCs develop 2–3 weeks after plating, expressing only endothelial markers (23, 24). They are very rare, form cobblestone‐like colonies with high proliferative potential and have the potential to form tubules in vitro (18, 25).
To date in regenerative medicine, biomimetic composite matrices containing fibrin, fibronectin, gelatine plus various growth factors have been used only with late EPCs (24). However, late EPCs are first cultured for 4–5 weeks on fibronectin, then harvested and seeded on fibrin (25, 26). The effect of fibrin on early EPC growth, without preliminary seeding on fibronectin, has never been assessed.
Moreover, only early EPCs have been used in clinical trials, demonstrating feasibility, safety and efficacy for their transplantation in patients with acute myocardial infarction or idiopathic pulmonary arterial hypertension (26, 27, 28). The limit of EPC cell therapy stems from their low rate of engraftment and non‐specific homing.
Thus, the aim of this study has been to combine potential of early EPCs with advantages of a biocompatible matrix, suitable for their growth and engraftment.
In this study, we then investigated:
-
1
structure and mechanical characteristics of fibrin gels made with different fibrinogen/thrombin ratios;
-
2
whether fibrin could be a functional biological matrix for EPC growth, differentiation and angiogenesis.
Materials and methods
Preparation of fibrin
Fibrin gels were prepared from freeze‐dried human fibrinogen and freeze‐dried human thrombin (kindly provided by Kedrion S.p.A., Lucca, Italy). The fibrinogen did not contain either fibronectin or any growth factors. Citrate buffer solution containing 60 mg/ml human fibrinogen and an aqueous solution containing 1250 U/ml human thrombin and 275 mm CaCl2 were prepared. Then, the two solutions were diluted accordingly and the two components mixed 1:1 to form a fibrin clot (final volume: 150 μl/cm2). Briefly, reconstituted fibrinogen solution was added to each well of cell culture multi‐well plates (Greiner, Frickenhausen, Germany), or glass chamber slides (BD Biosciences, San Jose, CA, USA); thereafter, thrombin solution was overlaid on top of the fibrinogen solution and mixed by swirling and tilting the plates. Gels were maintained for 1 h at 37 °C and 5% CO2 before cell seeding.
Structure of the fibrin gel was modified by varying fibrinogen concentration or thrombin activity (Table 1). Effects of these changes were studied by atomic force microscopy (AFM) for gel stiffness, and by WST‐1 colorimetric assay for cell number, in order to obtain the best combination for endothelial progenitor cell growth. Final concentration of 9 mg/ml fibrinogen and 25 U/ml of thrombin, referred to as 9/25, was used for all further experiments.
Table 1.
Final concentrations of the fibrinogen and thrombin solutions used to prepare the fibrin scaffolds
| Fibrinogen (mg/ml) | Thrombin (U/ml) |
|---|---|
| 9 | 25 |
| 18 | 25 |
| 36 | 25 |
| 9 | 6 |
| 9 | 12.5 |
| 9 | 50 |
Fibrin ultrastructure
Structure of fibrin gels was assessed by AFM and cryo‐scanning electron microscopy (Cryo‐SEM).
Atomic force microscopy. Fibrin gels were analysed using an AFM multimode microscope equipped with a Nanoscope IV controller (Veeco Instr., Santa Barbara, CA, USA) and a PicoForce stage, allowing for scanning in the Z direction (J‐type scanner). A special cantilever (elastic constant K = 4.5 N/m; Novascan Technologies Inc., Ames, IA, USA) was used to test gel stiffness. For imaging, a silicon nitride RTESP cantilever (Veeco Metrology Inc, Goleta, CA, US) was used. Both tapping mode and contact mode were used to study fibrin structure.
Cryo‐scanning electron microscopy. Fibrin gel with or without cells was cryo‐fixed in liquid nitrogen, transferred to the Cryo Unit SCU 020 (Bal‐Tec, Balzers, Liechtenstein) and freeze‐fractured using a motor‐driven fracturing microtome at −120 °C. Use of very low temperatures offers the opportunity of observation and microanalysis of biological specimens under conditions that are closely related to the natural state. After fracturing, frozen‐hydrated samples were surface etched for 2 min at −80 °C under high vacuum (<2 × 10⁻⁴ Pa) and sputter‐coated with 10 nm gold particles in argon atmosphere (<2.2 × 10⁻² Pa). For image analysis, freeze‐fractured samples were transferred to the SCU 020 cryo‐stage (−180 °C) inside the SEM (SEM 515; Philips, Eindhoven, The Netherlands) and examined at acceleration voltage of 8 kV. Slow‐scan images were digitized at 768 × 576 pixels (256 grey levels) and analysed using AnalySIS 2.1 (Soft‐Imaging Software, GmbH, Muenster, Germany). Sizes of reticulate meshes were measured interactively on digital Cryo‐SEM images. Observation of freeze‐fractured frozen‐hydrated fibrin samples by Cryo‐SEM, maintaining the original gas fraction, enabled highlighting of internal microarchitectural structural aspects.
Cell culture
EPCs were obtained from peripheral blood mononuclear cells (PBMCs) isolated from the buffy coats of healthy blood donors by centrifugation through Lymphoprep (Nycomed, Oslo, Norway) density gradient. PBMCs (1 × 10⁶/cm2) were seeded on fibrin; cells cultured on 2 μg/cm2 fibronectin (Calbiochem, Darmstadt, Germany) were used as control. For coating culture plates with fibronectin, a 20 μg/ml dilution in physiological saline (0.9% NaCl) was prepared, starting from 1 mg/ml human plasma fibronectin. Then 100 μl/cm2 was added to multi‐well plates or chamber slides. Plates were swirled gently to completely coat the growth surface. After remaining at room temperature for 30 min, fibronectin excess was removed and cells were seeded.
Cells were cultured in endothelial basal medium (EBM‐2; Lonza, Walkersville, MD, USA) supplemented with EGM‐2‐MV‐SingleQuots containing VEGF, basic fibroblast growth factor, insulin‐like growth factor‐1, epidermal growth factor, ascorbic acid, hydrocortisone and 5% foetal bovine serum (FBS; Lonza) (29). After 3 days culture, non‐adherent cells were removed by gentle aspiration and new complete medium was added; cells were then cultured for up to 2 weeks. Cell viability, their ability to differentiate into early EPCs and EPC functional activity were investigated. In each experiment, EPCs cultured on fibrin were compared to EPCs cultured on fibronectin.
For angiogenesis assay, human umbilical vein endothelial cells (HUVECs) were isolated from fresh human umbilical cords by incubation with collagenase (Invitrogen, Auckland, New Zealand) and cultured to confluence on gelatine (Sigma, St Louis, MO, USA)‐coated flasks in Medium 199 (Lonza) containing 20% heat‐inactivated FBS, penicillin/streptomycin, HEPES (all from Lonza), glutamine (Sigma), heparin (Biologici Italia Laboratories, Novate Milanese, Italy) and bovine retina‐derived extract (29). After expansion to confluence, cells were detached by trypsinization and used for in vitro angiogenesis assay.
Cell viability
To assess cell viability, calcein acetoxymethyl ester (Calcein AM; Molecular Probes, Invitrogen, Eugene, OR, USA), a non‐fluorescent, cell‐permeant compound hydrolysed by intracellular esterases into a fluorescent anion in live cells, was used. Briefly, cells were cultured on eight‐well chamber slides for 1 week as described earlier, before incubation in 5 μm calcein‐AM for 30 min at 37 °C and 5% CO2. Cells were examined by confocal laser scanning microscopy (CLSM; Nikon eclipse TE 2000‐U).
Cell number assay
Colorimetric assay based on cleavage of tetrazolium salt WST‐1 (4‐[3‐(4‐Iodophenyl)‐2‐(4‐nitrophenyl)‐2H‐5‐tetrazolium]‐1,3‐benzene disulphonate; Roche Applied Science, Mannheim, Germany) was used to evaluate cell proliferation in different fibrinogen and thrombin combinations and to compare the cell population growth of those grown on fibronectin. According to the manufacturer’s instructions, a calibration curve between absorbance and cell number was first obtained by use of cell suspensions at different cell densities, as absorbance directly correlates with number of viable cells. Briefly, cells cultured on 96‐well plates in triplicate were incubated with WST‐1 (10 μl/well) for 4 h at 37 °C and 5% CO2. Then, medium containing WST‐1 was transferred to a new multi‐well plate and formazan dye was quantified by measuring optical density at 450/655 nm, using a multiplate reader (Titertek Multiscan Plus, Helsinki, Finland). Optical density of control wells containing growth medium and coated with fibrin or fibronectin was subtracted from that of samples with cells.
Cell characterization
Flow cytometry analysis. To evaluate ability of PBMCs to differentiate into early EPCs, the following monoclonal antibodies were used: anti‐KDR‐PE (R&D Systems, Minneapolis, MN, USA), anti‐VE‐cadherin (Santa Cruz, Heidelberg, Germany), anti‐CD31‐FITC (Beckman Coulter, Marseille, France), anti‐vWF (Santa Cruz) and anti‐CD14‐PE (BD Biosciences). Cells were detached from six‐well plates by incubation with trypsin–EDTA (Lonza) and labelled (5 × 10⁵ cells/sample) for 20 min at room temperature with the antibodies, at 5 μg/ml final concentration. For analysis of VE‐cadherin and vWF, cells were further incubated with FITC‐conjugated goat anti‐mouse IgG1 antibody (Santa Cruz, final concentration: 5 μg/ml). Appropriate isotype was used as negative control. Cells were analysed using a FACscan (BD Biosciences), acquiring 1 × 10⁴ events.
Confocal laser scanning microscopy. Cells were grown on eight‐well chamber slides, fixed in 4% paraformaldheyde and permeabilized with 0.1% Triton‐X, before incubation with anti‐human vWF, VE‐cadherin, KDR or vimentin for 1 h at room temperature. All antibodies were purchased from SantaCruz and were diluted 1:50 in 2% FBS/PBS. Cells were then labelled with anti‐mouse IgG1‐FITC (Santa Cruz; diluted 1:200). Finally, for counterstaining cell nuclei, 4,6‐diamidino‐2‐phenylindole (DAPI; Invitrogen) was added. To evaluate whether there was cell migration inside clots, Z‐stack analysis was performed. Preparations were examined using a Nikon eclipse TE 2000‐U CLSM.
To evaluate protein expression of stem cell markers, cells grown on eight‐well chamber slides were fixed for 15 min in 4% paraformaldheyde and permeabilized by 0.05% Triton X‐100 for 30 min, before incubation with the following primary monoclonal antibodies against: OCT 3/4 (Santa Cruz Biotechnology, Santa Cruz, CA, USA) and NANOG (Becton Dickinson, San Jose, CA, USA). Alexa Fluor® 488 anti‐mouse IgG was used as secondary antibody. Slides were then mounted in Prolong® Gold antifade reagent with DAPI (Invitrogen). Samples were inspected by confocal microscopy (Nikon Inverted Microscope TiE equipped with a Nikon Confocal Laser System A1Rsi. Software for image analysis: NIS Elements C 3.06).
RNA isolation and reverse transcription. Cells cultured for 4, 7 or 14 days on six‐well plates were harvested and total RNA was isolated by using RNeasy mini kit (Qiagen, Hilden, Germany) according to the manufacturer’s instructions. RNA concentration and purity were calculated by measuring absorbance at 260 and 280 nm using a spectrophotometer. Quality of the RNA was assessed by 1% agarose gel electrophoresis. Reverse transcription was performed using 1 μg of total RNA in a final volume of 20 μl, using iScript First Strand synthesis kit (Bio‐Rad, Hercules, CA, USA).
Real‐time PCR (Quantitative PCR, QPCR). Quantitative real‐time PCR was performed using a MiniOpticon Real‐Time PCR System (Bio‐Rad) and SYBR Green I chemistry (Bio‐Rad). As control, level of HPRT mRNA was determined in the real‐time PCR assay of each RNA sample and to correct for experimental variation. The following primer sequences, designed by Bio‐Rad, using a software program (Beacon Designer 7.0, mFold), were used: VEGFa forward primer was 5′‐CGAGTACATCTTCAAGCCATCCTG‐3′; and reverse primer was 5′‐TGGTGAGGTTTGATCCGCATAATC‐3′. The OCT 3/4 forward primer was 5′‐GGTGGAGGAAGCTGACAACAATG‐3′ and reverse primer was 5′‐CTCTCACTCGGTTCTCGATACTGG‐3′. These sequences bind both OCT 3/4 isoforms, cytosolic (B isoform) and nuclear (A isoform).
NANOG forward primer was 5′‐GAACTCTCCAACATCCTGAACCTC‐3′ and reverse primer was 5′‐TGCGTCACACCATTGCTATTCTTC‐3′. As NANOG gene displays a high number of non‐functional pseudogenes (10 processed pseudogenes arising from retrotransposition of mRNA and designated NANOGP2 to NANOGP11, and a duplication pseudogene, designated NANOGP1), to detect NANOG mRNA specifically, we chose a pair of oligos unable to recognize mRNA sequences possibly encoded by these pseudogenes. HPRT forward primer was 5′‐AGACTTTGCTTTCCTTGGTCAGG‐3′, and reverse primer was 5′‐GTCTGGCTTATATCCAACACTTCG‐3′.
For QPCRs, final reaction mixture contained 1 μl of cDNA, 300 nmol/l of each primer, 7.5 μl of iQ SYBR green Supermix (Bio‐Rad), and RNase‐free water to make up the reaction mixture volume to 15 μl. All reactions were run in duplicate. PCR was performed with a ‘hot‐start’ denaturation step at 95 °C for 3 min, followed by 40 cycles at 95 °C for 5 s and 60 °C for 20 s. SYBR green fluorescence was read throughout the reaction, allowing continuous monitoring of the amount of amplified PCR product. Specificity of amplification was confirmed by melting‐curve analysis from a subsequent temperature ramp from 60 to 95 ° C. Amplification efficiency was close to 100% for all primer pairs. Comparative Ct (threshold cycle) method normalized to HPRT RNA, a stable RNA in our experimental conditions, was used to analyse relative changes in gene expression (amount of target = 2−ΔΔCt). HPRT was chosen after testing five housekeeping genes to find a valid reference for data normalization (GAPDH, RPL11, RPL13, 18s and HPRT). Data resulted from independent experiments.
EPC angiogenic activity
Matrigel assay. To evaluate EPC angiogenesis potential, EPCs detached from six‐well plates were labelled with chloromethylbenzamido (CM‐DiI; Molecular Probes) and HUVECs were labelled with dioxacarbocyanine (DiO; Molecular Probes). Cells at ratio of 1:4 (EPC/HUVEC) were co‐plated on 10 mg/ml of Matrigel (BD Biosciences). Matrigel was thawed on ice at 4 °C and used to coat 24‐well plates for 30 min at 37 °C. Cells were monitored and photographed using a fluorescence microscope (Nikon, Sesto Fiorentino, Italy) after 21 h incubation at 37 °C. Five independent images were taken for each well and colocalized fluorescence of EPCs and HUVECs per low power field was quantified using a modified version of Image J 1.38X software. Results were expressed as mean colocalized fluorescence (pixels) between EPC/HUVEC. To quantify angiogenic structures formed by HUVECs in presence of EPC detached from fibrin or fibronectin, representative fields from each experimental setting were taken and total length of capillary tubes per field was calculated as well as number of branch points, using plug‐in AngioJ Image J software. Results for different experimental groups were expressed as mean ± SEM from three independent experiments. Representative pictures at higher magnification were also taken.
Cytokine release. To assess paracrine activity of EPCs, release of a panel of 50 cytokines (Table 2) was evaluated by Bio‐Plex systems (Bio‐Rad Laboratories). The Bio‐Plex system is a multiplex analysis combining the principle of sandwich immunoassay with Luminex assay, enabling simultaneous quantification of up to 100 analyses in a single microplate well. By use of fluorescently dyed microbeads and flow cytometry, this system measures biochemical reactions that occur on the surface of the microspheres. Briefly, after 7 or 14 days culture on 96‐well plates, EPC culture medium was changed with EBM‐2 with 1% FBS and collected after 6 h. Media were stored at −80 °C until analysis. These data were compared with cytokines released from HUVECs and cells grown on fibronectin.
Table 2.
List of the 50 cytokines analysed by bioplex assay
| Inflammatory cytokines | Anti‐inflammatory cytokines | Chemokines | Growth factors | Adhesion molecules |
|---|---|---|---|---|
| IL‐1α | IL‐1ra | IL‐16 | b‐FGF | ICAM |
| IL‐1β | IL‐4 | IP‐10 | HGF | VCAM |
| IL‐2 | IL‐10 | MIG | VEGF | |
| IL‐2α | IL‐13 | MIP‐1α | PDGF‐BB | |
| IL‐3 | MIP‐1β | b‐NGF | ||
| IL‐5 | SDF‐1α | SCGF‐β | ||
| IL‐6 | GRO‐α | |||
| IL‐7 | MCP‐3 | |||
| IL‐8 | RANTES | |||
| IL‐9 | EOTAXIN | |||
| IL‐12 (p‐40) | G‐CSF | |||
| IL‐12 (p‐70) | CTACK | |||
| IL‐15 | SCF | |||
| IL‐17 | M‐CSF | |||
| IL‐18 | TRAIL | |||
| TNF‐α | LIF | |||
| GM‐CSF | TNF‐β | |||
| MIF | ||||
| MCP‐1 | ||||
| IFN‐γ | ||||
| IFN‐α2 |
b‐FGF, basic fibroblast growth factor; b‐NGF, beta‐nerve growth factor; CTACK, cutaneous T‐cell‐attracting chemokine; G‐CSF, granulocyte‐colony stimulating factor; GM‐CSF, granulocyte‐macrophage colony stimulating factor; GRO, growth related oncogene; HGF, hepatocyte growth factor; ICAM, intercellular adhesion molecule; IFN, interferon; IL, interleukin; IL‐1 ra, interleukin‐1 receptor antagonist; LIF, leukaemia inhibitory factor; MCP, monocyte chemotactic protein; M‐CSF, macrophage colony stimulating factor; MIF, macrophage migration inhibitory factor; MIG, monokine induced by interferon‐γ; MIP, macrophage inflammatory protein; PDGF, platelet‐derived growth factor; RANTES, regulated upon activation, normal T cell expressed and secreted; SCGF, stem cell growth factor; SDF, stromal cell‐derived factor; TNF, tumour necrosis factor; TRAIL, tumour necrosis factor‐related apoptosis inducing ligand; VCAM, vascular cell adhesion molecule; VEGF, vascular endothelial growth factor.
Measurements and data analysis of all assays were performed using the Bio‐Plex System in combination with Bio‐Plex Manager software. Data were normalized to cell number.
Data presentation and statistical analysis
Data are presented as mean ± SEM of n independent experiments. Comparisons were made using Student’s t‐test or by ANOVA when appropriate. Values of P < 0.05 were considered statistically significant.
Results
Effect of fibrin composition on gel stiffness and cell population growth
Force–distance curves (measurement of stiffness of fibrin samples) showed that increasing fibrinogen concentration significantly enhanced gel stiffness (9/25: 0.026 ± 0.003 N/m; 18/25: 0.0423 ± 0.00415 N/m; 36/25: 0.2495 ± 0.0045 N/m, **versus 36/25 P < 0.01; Fig. 1a), and on the contrary, thrombin activity did not show any effect (data not shown).
Figure 1.

Effect of fibrinogen concentration on fibrin stiffness and cell growth. (a) Stiffness measure of the different fibrin scaffolds. Stiffness was increased with higher fibrinogen concentration (**P < 0.01 for 9/25 versus 36/25). (b) WST‐1 assay. Cell growth was reduced with increasing fibrinogen concentration (**P < 0.05 for 9/25 versus 36/25). Mean ± SEM of three different experiments.
As mechanical properties of substrates may influence cell proliferation (30, 31, 32), identical fibrin concentrations and thrombin activities were used. Increase in fibrinogen concentration reduced cell growth (9/25: 0.519 ± 0.060 a.u; 18/25: 0.383 ± 0.060 a.u; 36/25: 0.229 ± 0.040 a.u., *versus 36/25, P < 0.05; n = 3; Fig. 1b), while thrombin had no significant effect (data not shown). According to the results, we decided to use 9 mg/ml fibrinogen concentration and 25 U/ml thrombin activity for subsequent experiments.
Microarchitecture of fibrin
Cryo‐SEM images of frozen‐hydrated fibrin showed that its internal microarchitecture constituted a complex plot of filaments producing micropores of very different diameters (10–100 μm) both on the same fracture plane and more in depth (Fig. 2a), that allowed cells to colonize the pores. Class of frequency analysis of porous surfaces revealed that 1/3 of pores had dimensions from 30 to 60 μm2 (Fig. 2b). AFM analysis showed a nanometric fibrous structure (Fig. 2c). Average diameter of fibres was in the order of 150–200 nm for thicker fibres and 50 nm for thinner fibres, while heights of fibres varied from 10 to 70 nm according to their thicknesses.
Figure 2.

Ultrastructural characteristics of fibrin. (a) Cryo‐SEM images of freeze‐fractured fibrin and (b) histogram representing frequency classes of porous surface areas. The internal microarchitecture is constituted by a complex plot of filaments producing micropores of very different size (10–100 μm) that allow cells to colonize the pores. Scale bar = 10 μm. (c) AFM friction image evidences a nanometric fibrous structure, the average diameter (on plane xy) of fibrin fibres is about 150–200 nm for the thicker fibres and 50 nm for the thinner fibres. In the representative height image the red line shows the section analysed for the measure of fibres’ height (on plane z) and the relative plot shows the height range (10–70 nm).
Cell viability
Cell viability after 1 week of culture on fibrin was evaluated by calcein‐AM staining and compared to viability of cells cultured on fibronectin. CLSM showed presence of viable cells both on fibrin (Fig. 3a) and on fibronectin (Fig. 3b). To investigate whether fibrin retained a higher number of cells compared to fibronectin, WST‐1 assay was performed. Cell number was significantly higher on fibrin than on fibronectin (fibrin: 0.519 ± 0.06 O.D. versus fibronectin: 0.281 ± 0.036 O.D., P < 0.05; Fig. 3c).
Figure 3.
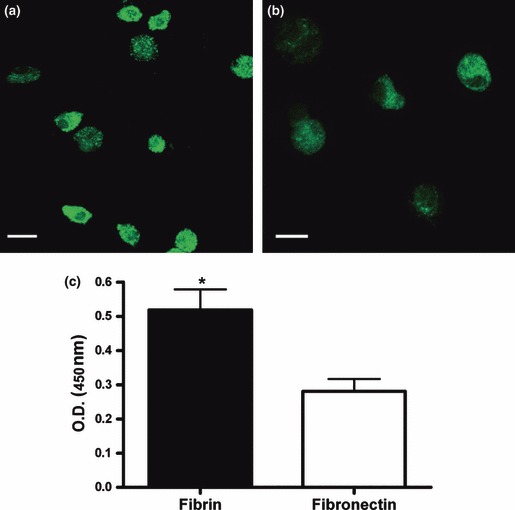
Cell viability. Cells cultured for 1 week on fibrin (a) or fibronectin (b) were incubated with calcein‐AM. Viable cells are evidenced by the presence of green staining in cell cytoplasm. Representative confocal laser scanning microphotographs are shown (n = 3). Scale bar = 10 μm. (c) Cells cultured for 1 week on fibrin or fibronectin were incubated with the tetrazolium salt WST‐1 for 4 h at 37 °C to produce a formazan dye, quantified by measuring the optical density at 450/655 nm. *P < 0.05. Mean ± SEM of three different experiments.
EPC differentiation
Figure 4 shows flow cytometry analysis of PBMC‐derived EPCs cultured for 1 week, either on fibronectin (a) or on fibrin (b). EPCs grown on fibrin expressed endothelial markers at a level comparable to those on fibronectin (p = n.s.): vWF (28 ± 11% versus 39 ± 15%), VE‐cadherin (24 ± 7% versus 35 ± 13%), KDR (57 ± 20% versus 66 ± 13%) and CD31 (24 ± 9% versus 20 ± 14%). CD14, a monocyte marker consistent with phenotype of early EPCs, was also present on both fibrin (62 ± 11%) and fibronectin (64 ± 8%). These data are comparable to those reported in the literature (21).
Figure 4.
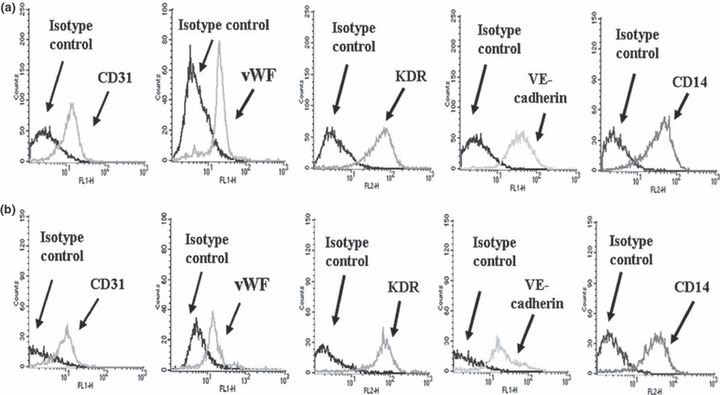
EPC phenotype by flow cytometry. Representative flow cytometric analysis (n = 8) of markers of EPCs cultured for 1 week on fibronectin (a) or on fibrin (b). CD31, vWF, KDR, VE‐cadherin and CD14 staining histograms are shown, compared with their isotype control. Fluorescence intensity, proportional to the surface abundance of the antigen detected by the fluorescent‐labelled monoclonal antibody, is reported on the abscissa, while cell number is reported on the ordinate.
CSLM also confirmed that EPCs grown on fibrin expressed endothelial antigens (vWF, KDR, Ve‐Cadherin) at a comparable level to those on fibronectin at day 7. After 2 weeks culture, a high number of EPCs was present only on fibrin (Fig. 5a–n). Staining for vimentin (Fig. 5o–q) revealed presence of three different cell morphologies on fibronectin (o): small round cells with a thin cytoplasmic ring around a central nucleus; larger irregular cells, poorly elongated; and bipolar elongated cells with a central nucleus. The three kinds of cell were present in the same percentages. On fibrin (p), most cells had a round shape, frequently aggregated in small clusters, and only a few elongated cells were present.
Figure 5.
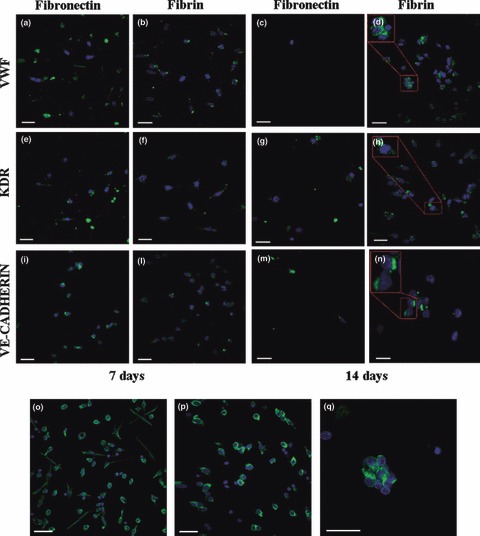
EPC phenotype and morphology by confocal laser scanning microscopy. EPCs were cultured either on fibronectin (left) or on fibrin (right), before staining with monoclonal antibodies for vWF (a–d), KDR (e–h) and Ve‐cadherin (i–l). The expression of the endothelial markers was evaluated at 7 (a, b, e, f, i, j) and 14 days (c, d, g, h, k, l). DAPI (blue) was added for counterstaining of cell nuclei. The expression of the endothelial antigens by EPCs grown on fibrin and fibronectin was comparable at day 7. At day 14, a high number of stained cells was observed only on fibrin. Scale bar = 20 μm. Vimentin staining (green) of EPC cultured for 1 week on fibronectin (m) or on fibrin (n). DAPI (blue) was added for counterstaining of cell nuclei. On fibronectin (m), three different cell morphologies were observed: small round cells with a thin cytoplasm ring around a central nucleus (1); larger irregular cells, scarcely elongated (2); bipolar elongated cells, with a central nucleus (3). On fibrin (n), most cells had a round shape (2), frequently aggregated in small clusters (o), and only a few elongated cells were present (1). Scale bar = 10 μm.
Even if cells were not embedded in fibrin, they were able to migrate inside the clot, as confirmed by confocal laser scanning analysis of Z‐stacks (Fig. 6).
Figure 6.
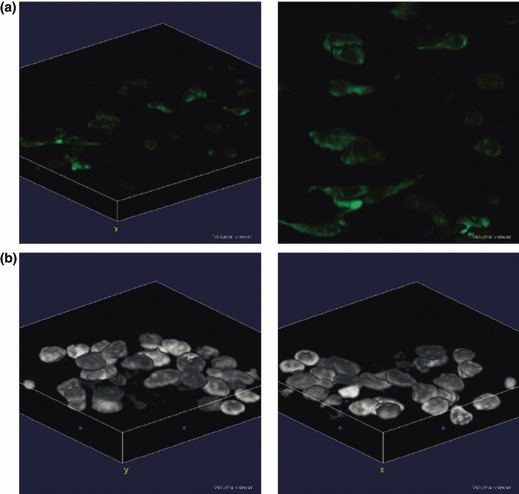
Z‐stack analysis of EPCs grown on fibrin. (a) EPCs were stained with an anti‐Vimentin monoclonal antibody and a FITC‐conjugated secondary antibody. (b) 3D analysis of EPC nuclei stained with DAPI.
Expression of stem cell markers
Expression of the two transcription factors OCT 3/4 and NANOG was assessed at RNA level, after 4, 7 or 14 days culture (Fig. 7a). mRNA expression of NANOG and OCT 3/4 at both 4 and 7 days was significantly higher on fibrin than on fibronectin (P < 0.005 for both genes). At 14 days, we observed down‐regulation of both mRNAs even if expression remained significantly higher on fibrin than on fibronectin (P < 0.05 for NANOG and P < 0.005 for OCT 3/4, n = 6). Protein expression of OCT 3/4 and NANOG was assessed by CLSM. EPCs cultured on fibrin (Fig. 7b) showed greater positive staining compared to EPCs cultured on fibronectin at different time points evaluated, confirming ability of fibrin to elicit those markers in EPCs.
Figure 7.

Expression of stem cell markers. (a) Expression of NANOG and OCT 3/4 by Real‐time RT‐PCR at 4, 7 and 14 days. The expression of NANOG and OCT 3/4 was significantly higher on fibrin than on fibronectin at both 4 and 7 days (***P < 0.005). After 14 days, there was a down‐regulation in stem cell marker expression even if the expression remained significantly higher on fibrin (*P < 0.05 for NANOG and ***P < 0.005 for OCT 3/4). Mean ± SEM of six different experiments. (b) Expression of OCT 3/4 and NANOG protein by confocal microscopy. The OCT 3/4 and NANOG protein expression was mainly visible on fibrin at 4–7 and 14 days. Scale bar: 10 μm.
In vitro angiogenesis assay
Ability of EPCs to participate in tubular structures formed by HUVECs on Matrigel was assessed, co‐plating these two cell types. The average ratio between EPCs (red) and HUVEC (green) per low power field was comparable (p = n.s.) when EPCs were grown on fibronectin (Fig. 8a: 31.59 ± 5.70 a.u.) or on fibrin (Fig. 8d: 41.79 ± 1.36 a.u.). EPCs detached from fibrin did not show any ability to form tubules when seeded alone on Matrigel, no different from EPCs grown on fibronectin (data not shown).
Figure 8.
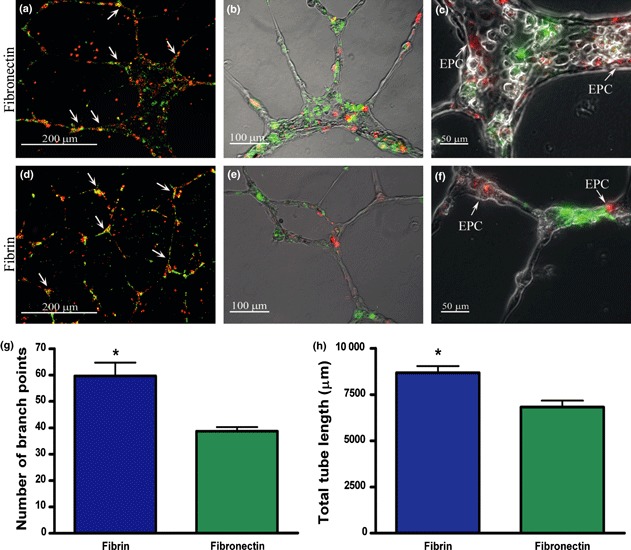
EPC contribution in tubules formed by human umbilical vein endothelial cells (HUVECs) on Matrigel. Cells were observed under a fluorescent microscope and pictures taken at lower magnification were used for fluorescence quantification. Representative merged pictures of EPCs grown on fibronectin (a) and fibrin (d) are shown. The average ratio between EPCs (red) and HUVEC (green) per low power field was comparable (p = n.s.) between EPCs grown on fibrin (41.79 ± 1.36 a.u.) or EPCs grown on fibronectin (31.59 ± 5.70 a.u.). Figure 7b,e show the merged images of labelled cells in the bright field to visualize the structure of tubes better. Figure 7c,f are a magnification of tubular structures, showing the distribution of EPC on capillary structures formed by HUVECs. Scale bars: 200 μm (a, d), 100 μm (b, e), 50 μm (c, f). Number of branch points (g) and total tube length (h) of HUVEC networks were also calculated. Ability of HUVEC to form capillary‐like sprouts was significantly higher when co‐plated with EPCs detached from fibrin than from fibronectin (*P < 0.05). Mean ± SEM from three experiments.
Structures formed by HUVECs in the presence of EPCs derived from fibrin or fibronectin were also quantified by measuring two parameters: total tube length (Fig. 8g) and number of branch points (Fig. 8h). Ability of HUVECs to form tubules was significantly higher when co‐plated with EPCs detached from fibrin compared to EPCs grown on fibronectin (*P < 0.05).
Cytokine release
Of the 50 cytokines measured in cell culture supernatants, EPCs cultured on fibrin released 11 cytokines at detectable levels: interferon γ inducible protein 10 (IP‐10), platelet‐derived growth factor (PDGF‐BB), interleukin 8 (IL‐8), interleukin 16 (IL‐16), monokine induced by interferon‐γ (MIG), macrophage migration inhibitory factor (MIF), stromal cell‐derived factor (SDF‐1α), growth‐related oncogene α (GRO‐α), monocyte chemotactic protein‐1 (MCP‐1), macrophage colony stimulating factor (M‐CSF) and HGF.
As a whole (Fig. 9), cytokine release was statistically higher in EPC supernatants compared to HUVECs (δδ < 0.01; δδδ < 0.001 versus HUVECs). Most released cytokines (IL‐16, PDGF‐BB, MIF, SDF‐1, HGF, IP10, MIG) were statistically higher when EPCs were grown on fibrin than on fibronectin (*P < 0.05; ***P < 0.001 versus fibronectin), while MCFS, Gro‐α, IL‐8 and MCP‐1 were expressed in a comparable way on both matrices.
Figure 9.

Cytokine release by EPCs cultured either on fibrin or on fibronectin. Cytokine release was statistically increased in supernatants of EPC compared with HUVECs (δδ < 0.01; δδδ < 0.001 versus HUVECs, n = 5). IL‐16, PDGF‐BB, MIF, SDF‐1, HGF, IP10 and MIG were statistically higher when EPCs were grown on fibrin than on fibronectin (*P < 0.05; ***P < 0.001 versus fibronectin, n = 5), while MCFS, Gro‐α, IL‐8 and MCP‐1 were expressed in a comparable way on both matrices.
Discussion
The objective of this study was to provide a biomimetic niche in vitro to support cell population growth, differentiation and functional activity of early EPCs. Several studies suggest that EPCs cultured from peripheral blood offer new possibilities for achieving effective vascularization of ischaemic or injured tissue or for tissue engineering applications (33, 34). For successful transplantation, there is necessity for a microenvironment on which EPCs can survive and differentiate. Fibrin is an attractive matrix for cell delivery and tissue repair (3). The aim of our study was to test whether a matrix made of fibrin and characterized by absence of fibronectin and growth factors, could be a sufficient support for early EPC population growth and differentiation.
Until now, only late EPCs have been cultured on composite matrices containing fibrin, fibronectin, gelatine and various growth factors, and subsequently seeded in grafts (35), or used for tissue engineering applications (36, 37). In all these situations, however, cells are first cultured for 4–5 weeks on different matrices then harvested and seeded on fibrin.
Fibrin, mimicking extracellular matrix (ECM), can potentially affect cell differentiation processes (38, 39), as natural ECM is more than a simple physical support for cells. ECM plays a critical role by providing biochemical and biophysical cues that regulate cell behaviour, and regulates cell adhesion, proliferation and function by release of different growth factors. Moreover, good elasticity of fibrin gel is another essential aspect for its efficiency as a cell matrix (3). It is known that elasticity directs cell lineage specification and influences dynamics of the angiogenic process, modulating both cell migration (40) and cell traction forces (41). In a previous study (42), it has been demonstrated that mechanical and structural properties of fibrin matrices affected migration and capillary formation ability of endothelial cells. Fibrin has both elastic and viscous properties that can vary greatly, depending on clot structure and biochemical properties (43). It has recently been shown that fibrin fibres are extraordinary extensible and elastic (44), and these remarkable characteristics distinguish fibrin from all other characterized protein fibres (45).
Changes in fibrin component concentration and activity can generate gels with different mechanical properties that may influence proliferation and viability of different types of cells cultured on fibrin (30, 32, 46). However, this effect has never been tested on early EPCs. To choose the best ratio of fibrinogen concentration and thrombin activity for EPC growth, we assessed mechanical properties of fibrin by stiffness evaluation, an indirect measure of elasticity. It has been demonstrated that even if fibrin gel elasticity is related to fibrinogen and thrombin concentration, thrombin concentration influences kinetics of gelation, but not evolution of mechanical properties of the gel (47). Our results confirmed that changing concentration of fibrinogen significantly affected fibrin stiffness, while thrombin activity showed no significant effect. Moreover, increasing fibrinogen concentration reduced cell population growth, an effect that was not observed by varying thrombin activity. From these experiments, we chose to use 9 mg/ml fibrinogen and 25 U/ml thrombin for cell proliferation and differentiation.
Our results from microscopy techniques showed three‐dimensional complexity of our fibrin matrix, characterized by interconnected porous networks including both microporosity and macroporosity that guarantee excellent nutrition supply and ability of cells to colonize the pores, supported by nanometric fibrous structure, important to mimic the ECM. Fibrin obtained with our fibrinogen/thrombin ratio has also good elasticity properties as nanofibres, as their dimensions form a network that provides tensile strength and elasticity to the structure.
After choosing appropriate fibrin composition and assessing fibrin ultrastructure, ability of fibrin to support peripheral blood EPC growth, their differentiation towards endothelial‐like phenotype and their contribution to tubular structure formation were investigated.
As a cell source, we chose human peripheral blood circulating progenitors, because of ease of blood collection, and because it represents an autologous source for cells, thus avoiding necessity of immunosuppressive therapy. Peripheral blood contains at least two types of EPC, early and late, with different morphologies, proliferation rates, survival behaviours, gene expression profiles and secreting activities (20), leading to different functions in vitro. Despite such differences, they equally contribute to neovasculogenesis in vivo, as early EPCs secrete angiogenic cytokines that may activate adjacent endothelial cells and enhance angiogenesis, whereas late EPCs only supply a sufficient number of endothelial cells based on their high proliferation rate (18). To date, only early EPCs have been used in clinical trials (26, 27, 28) as an alternative to bone marrow cells, with comparable results. For these reasons, we decided to use early EPCs.
The summary of our results is that fibrin can supported growth and differentiation of early EPCs in a comparable way to fibronectin but in addition, fibrin retained larger amounts of functional cells over a longer time period.
Expressions of endothelial and monocyte markers were comparable when cells were grown either on fibrin or on fibronectin. Early EPC are not mature endothelial cells, retaining monocyte/macrophage lineage antigens on cell surfaces (19, 21). While on fibronectin, three different cell morphologies, equally distributed, were present, only two morphologies were observed on fibrin, one of them mostly present, with cells often aggregated in small clusters. This different distribution is probably due to fibrin structure, composed of a 3D network of fibres, with pores that allow cells to migrate inside, differently from fibronectin. We did not observe different phenotypes in terms of endothelial marker expression, as they were equally visible by confocal microscopy on cells with different morphologies.
Functional angiogenic properties of EPCs grown on fibrin were then evaluated in terms of capillary formation and paracrine secretory activity. Even if early EPCs had no capacity for de novo tubulogenesis by themselves (22), angiogenesis assay on Matrigel allows evaluation of their contribution to participation in synthesis of tubular structures. EPCs grown either on fibrin or fibronectin contributed in a comparable way to networks formed by HUVECs, however, tubular structures were more complex in the presence of EPCs grown on fibrin, as shown by a significantly higher total tube length and number of branch points. This result is probably a consequence of enhanced paracrine production of cytokines when EPCs were grown on fibrin.
The main recognized functional activity of early EPCs is their paracrine property. Indeed, early EPCs do not have any direct angiogenic effect (20), but induce indirect and humoral activity in host tissues (48), which amplifies effects. In our study, release profile of 50 cytokines, including inflammatory and anti‐inflammatory cytokines, chemokines, growth factors and adhesion molecules, was evaluated (Table 2). We found detectable expression of 11 cytokines. SDF‐1 and HGF, known to promote the mobilization and recruitment of circulating and tissue progenitor cells into ischaemic tissue (20), were significantly higher when EPCs were grown on fibrin. MCP‐1 and IL‐8, involved in recruitment of circulating inflammatory cells (49), with angiogenic and cardioprotective effects (50), had comparable levels when EPCs were cultured on each matrix. High paracrine release of some angiogenic and inflammatory factors by EPCs grown on fibrin allowed us to speculate that early EPCs transplanted with fibrin might accelerate the process of new blood vessel formation and regeneration of ischaemic tissues. The pro‐inflammatory character of early EPCs might be responsible for their therapeutic effects in setting post‐infarct repair in motion or collateral formation, making them ideal for cell therapy in post‐infarct treatment (49). Regarding direct effects of fibrin on cytokine release, it has been reported that fibrin and fibrinogen might actively modulate the inflammatory process by inducing synthesis of pro‐inflammatory cytokines from PBMCs (51). These findings support our results with EPCs.
Finally, an intriguing result came from the study of expression of NANOG and OCT 3/4 markers. Real‐time RT‐PCR showed significantly higher expression of these when cells were cultured on fibrin. These results have been also supported by protein expression evaluated by confocal laser scanning microscopy. NANOG and OCT 3/4 have been originally described in embryonic stem cells for maintenance of pluripotency (52, 53). Recently, these two markers have been demonstrated also in human adult stem cells from peripheral blood (54), cord blood (55) and bone marrow (56). Their expression could also play an important role in stem cell self‐renewal and in maintaining tissue homeostasis (57). Their presence in cells cultured on fibrin could be linked to a possible unique effect of fibrin as shown by others (58), or alternatively, linked to the nanometric structure of our gel (59). Retention of expression of NANOG and OCT 3/4 markers by fibrin is a very interesting result and it should be further investigated in transdifferentiation studies.
Our study demonstrates that fibrin provides an optimal matrix for growth, differentiation and engraftment of peripheral blood endothelial progenitor cells, acting as a sustained release reservoir for cell growth factors. Fibrin enhances cell retention and paracrine cytokine release, crucial for formation of new blood vessels and regeneration of ischaemic tissues.
In conclusion, these results suggest the use of our experimental matrix for regenerative medicine applications, as fibrin provides homogeneous cell distribution and in situ retention, avoiding homing of cells towards different organs far from a site that needing to be repaired.
To the best of our knowledge, this is the first study showing that early EPCs grown on fibrin have peculiar properties compared with EPCs grown on traditional fibronectin matrix. Importantly, we used a matrix that is commonly used in surgical settings as a glue, this has the advantage of being provided without addition of exogenous growth factors.
Acknowledgements
MCB is supported by a PhD fellowship of the University of Pisa. AM and CA are supported by the grant ‘Development of a new technology for 3D nanostructured scaffolds with potential cardiovascular applications’ of Regione Toscana.
We acknowledge the support of Regione Toscana for the Integrated Research Project ‘Development of a new technology for 3D nanostructured scaffolds with potential cardiovascular application’ and the support by Fondazione Cassa di Risparmio di Pisa for the Research Project ‘Self‐assembling nanostructured systems for regenerative therapy of ischaemic tissues’.
The authors wish to thank KEDRION S.p.A (Castelvecchio Pascoli, Lucca, Italy) for providing human fibrinogen and thrombin, and Dr M. Lemmi and Dr R. Arici for their excellent technical assistance.
References
- 1. Hamdi H, Furuta A, Bellamy V, Bel A, Puymirat E, Peyrard S et al. (2009) Cell delivery: intramyocardial injections or epicardial deposition? A head‐to‐head comparison Ann. Thorac. Surg. 87, 1196–1203. [DOI] [PubMed] [Google Scholar]
- 2. Shaikh FM, Callanan A, Kavanagh EG, Burke PE, Grace PA, McGloughlin TM (2008) Fibrin: a natural biodegradable scaffold in vascular tissue engineering. Cells Tissues Organs 188, 333–346. [DOI] [PubMed] [Google Scholar]
- 3. Janmey PA, Winer JP, Weisel JW (2009) Fibrin gels and their clinical and bioengineering applications. J. R. Soc. Interface 6, 1–10. [DOI] [PMC free article] [PubMed] [Google Scholar]
- 4. Nakatsu MN, Sainson RC, Aoto JN, Taylor KL, Aitkenhead M, Perez‐del‐Pulgar S et al. (2003) Angiogenic sprouting and capillary lumen formation modeled by human umbilical vein endothelial cells (HUVEC) in fibrin gels: the role of fibroblasts and Angiopoietin‐1. Microvasc. Res. 66, 102–112. [DOI] [PubMed] [Google Scholar]
- 5. Cox S, Cole M, Tawil B (2004) Behavior of human dermal fibroblasts in three‐dimensional fibrin clots: dependence on fibrinogen and thrombin concentration. Tissue Eng. 10, 942–954. [DOI] [PubMed] [Google Scholar]
- 6. Horch RE, Bannasch H, Kopp J, Andree C, Stark GB (1998) Single‐cell suspensions of cultured human keratinocytes in fibrin‐glue reconstitute the epidermis. Cell Transplant. 7, 309–317. [DOI] [PubMed] [Google Scholar]
- 7. Ye Q, Zund G, Benedikt P, Jockenhoevel S, Hoerstrup SP, Sakyama S et al. (2000) Fibrin gel as a three dimensional matrix in cardiovascular tissue engineering. Eur. J. Cardiothorac. Surg. 17, 587–591. [DOI] [PubMed] [Google Scholar]
- 8. Bensaid W, Triffitt JT, Blanchat C, Oudina K, Sedel L, Petite H (2003) A biodegradable fibrin scaffold for mesenchymal stem cell transplantation. Biomaterials 24, 2497–2502. [DOI] [PubMed] [Google Scholar]
- 9. Fan CL, Gao PJ, Gu YJ, Tang XF, Liu JJ, Wei J et al. (2006) Therapeutic angiogenesis by intramuscular injection of fibrin particles into ischaemic hind limbs. Clin. Exp. Pharmacol. Physiol. 33, 617–622. [DOI] [PubMed] [Google Scholar]
- 10. Christman KL, Vardanian AJ, Fang Q, Sievers RE, Fok HH, Lee RJ (2004) Injectable fibrin scaffold improves cell transplant survival, reduces infarct expansion, and induces neovasculature formation in ischemic myocardium. J. Am. Coll. Cardiol. 44, 654–660. [DOI] [PubMed] [Google Scholar]
- 11. Wong C, Inman E, Spaethe R, Helgerson S (2003) ) Fibrin‐based biomaterials to deliver human growth factors. Thromb. Haemost. 89, 573–582. [PubMed] [Google Scholar]
- 12. Sahni A, Francis CW (2000) Vascular endothelial growth factor binds to fibrinogen and fibrin and stimulates endothelial cell proliferation. Blood 96, 3772–3778. [PubMed] [Google Scholar]
- 13. Mittermayr R, Morton T, Hofmann M, Helgerson S, Van Griensven M, Redl H (2008) Sustained (rh)VEGF(165) release from a sprayed fibrin biomatrix induces angiogenesis, up‐regulation of endogenous VEGF‐R2, and reduces ischemic flap necrosis. Wound Repair Regen. 16, 542–550. [DOI] [PubMed] [Google Scholar]
- 14. Briganti E, Spiller D, Mirtelli C, Kull S, Counoupas C, Losi P et al. (2010) A composite fibrin‐based scaffold for controlled delivery of bioactive pro‐angiogenetic growth factors. J. Control Release 142, 14–21. [DOI] [PubMed] [Google Scholar]
- 15. Losi P, Briganti E, Magera A, Spiller D, Ristori C, Battolla B et al. (2010) Tissue response to poly(ether)urethane‐polydimethylsiloxane‐fibrin composite scaffolds for controlled delivery of pro‐angiogenic growth factors. Biomaterials 31, 5336–5344. [DOI] [PubMed] [Google Scholar]
- 16. Asahara T, Murohara T, Sullivan A, Silver M, Van der Zee R, Li T et al. (1997) Isolation of putative progenitor endothelial cells for angiogenesis. Science 275, 964–967. [DOI] [PubMed] [Google Scholar]
- 17. Balbarini A, Barsotti MC, Di Stefano R, Leone A, Santoni T (2007) Circulating endothelial progenitor cells characterization, function and relationship with cardiovascular risk factors. Curr. Pharm. Des. 13, 1699–1713. [DOI] [PubMed] [Google Scholar]
- 18. Hur J, Yoon CH, Kim HS, Choi JH, Kang HJ, Hwang KK et al. (2004) Characterization of two types of endothelial progenitor cells and their different contributions to neovasculogenesis. Arterioscler. Thromb. Vasc. Biol. 24, 288–293. [DOI] [PubMed] [Google Scholar]
- 19. Rehman J, Li J, Orschell CM, March KL (2003) Peripheral blood “endothelial progenitor cells” are derived from monocyte/macrophages and secrete angiogenic growth factors. Circulation 107, 1164–1169. [DOI] [PubMed] [Google Scholar]
- 20. Urbich C, Aicher A, Heeschen C, Dernbach E, Hofmann WK, Zeiher AM et al. (2005) Soluble factors released by endothelial progenitor cells promote migration of endothelial cells and cardiac resident progenitor cells. J. Mol. Cell. Cardiol. 39, 733–742. [DOI] [PubMed] [Google Scholar]
- 21. Kalka C, Masuda H, Takahashi T, Kalka‐Moll WM, Silver M, Kearney M et al. (2000) Transplantation of ex vivo expanded endothelial progenitor cells for therapeutic neovascularization. Proc. Natl. Acad. Sci. USA 97, 3422–3427. [DOI] [PMC free article] [PubMed] [Google Scholar]
- 22. Yoder MC, Mead LE, Prater D, Krier TR, Mroueh KN, Li F et al. (2007) Redefining endothelial progenitor cells via clonal analysis and hematopoietic stem/progenitor cell principals. Blood 109, 1801–1809. [DOI] [PMC free article] [PubMed] [Google Scholar]
- 23. Fuchs S, Hermanns MI, Kirkpatrick CJ (2006) Retention of a differentiated endothelial phenotype by outgrowth endothelial cells isolated from human peripheral blood and expanded in long‐term cultures. Cell Tissue Res. 326, 79–92. [DOI] [PubMed] [Google Scholar]
- 24. Deschaseaux F, Selmani Z, Falcoz PE, Mersin N, Meneveau N, Penfornis A et al. (2007) Two types of circulating endothelial progenitor cells in patients receiving long term therapy by HMG‐CoA reductase inhibitors. Eur. J. Pharmacol. 562, 111–118. [DOI] [PubMed] [Google Scholar]
- 25. Gulati R, Jevremovic D, Peterson TE, Chatterjee S, Shah V, Vile RG et al. (2003) Diverse origin and function of cells with endothelial phenotype obtained from adult human blood. Circ. Res. 93, 1023–1025. [DOI] [PubMed] [Google Scholar]
- 26. Schachinger V, Assmus B, Britten MB, Honold J, Lehmann R, Teupe C et al. (2004) Transplantation of progenitor cells and regeneration enhancement in acute myocardial infarction: final one‐year results of the TOPCARE‐AMI Trial. J. Am. Coll. Cardiol. 44, 1690–1699. [DOI] [PubMed] [Google Scholar]
- 27. Wang XX, Zhang FR, Shang YP, Zhu JH, Xie XD, Tao QM et al. (2007) Transplantation of autologous endothelial progenitor cells may be beneficial in patients with idiopathic pulmonary arterial hypertension: a pilot randomized controlled trial. J. Am. Coll. Cardiol. 49, 1566–1571. [DOI] [PubMed] [Google Scholar]
- 28. Zhu JH, Wang XX, Zhang FR, Shang YP, Tao QM, Zhu JH et al. (2008) Safety and efficacy of autologous endothelial progenitor cells transplantation in children with idiopathic pulmonary arterial hypertension: open‐label pilot study. Pediatr. Transplant. 12, 650–655. [DOI] [PubMed] [Google Scholar]
- 29. Di Stefano R, Santoni T, Barsotti MC, Armani C, Chifenti B, Guida C et al. (2002) Different growth conditions for peripheral blood endothelial progenitors. Cardiovasc. Radiat. Med. 3, 172–175. [DOI] [PubMed] [Google Scholar]
- 30. Sidelmann JJ, Gram J, Jespersen J, Kluft C (2000) Fibrin clot formation and lysis: basic mechanisms. Semin. Thromb. Hemost. 26, 605–618. [DOI] [PubMed] [Google Scholar]
- 31. Eyrich D, Brandl F, Appel B, Wiese H, Maier G, Wenzel M et al. (2007) Long‐term stable fibrin gels for cartilage engineering. Biomaterials 28, 55–65. [DOI] [PubMed] [Google Scholar]
- 32. Ho W, Tawil B, Dunn JC, Wu BM (2006) The behavior of human mesenchymal stem cells in 3D fibrin clots: dependence on fibrinogen concentration and clot structure. Tissue Eng. 12, 1587–1595. [DOI] [PubMed] [Google Scholar]
- 33. Finkenzeller G, Torio‐Padron N, Momeni A, Mehlhorn AT, Stark GB (2007) In vitro angiogenesis properties of endothelial progenitor cells: a promising tool for vascularization of ex vivo engineered tissues. Tissue Eng. 13, 1413–1420. [DOI] [PubMed] [Google Scholar]
- 34. Punshon G, Sales KM, Vara DS, Hamilton G, Seifalian AM (2008) Assessment of the potential of progenitor stem cells extracted from human peripheral blood for seeding a novel vascular graft material. Cell Prolif. 41, 321–335. [DOI] [PMC free article] [PubMed] [Google Scholar]
- 35. Sreerekha PR, Krishnan LK (2006) Cultivation of endothelial progenitor cells on fibrin matrix and layering on dacron/polytetrafluoroethylene vascular grafts. Artif. Organs 30, 242–249. [DOI] [PubMed] [Google Scholar]
- 36. Smadja DM, Basire A, Amelot A, Conte A, Bieche I, Le Bonniec BF et al. (2008) Thrombin bound to a fibrin clot confers angiogenic and haemostatic properties on endothelial progenitor cells. J. Cell. Mol. Med. 12, 975–986. [DOI] [PMC free article] [PubMed] [Google Scholar]
- 37. Thebaud NB, Bareille R, Remy M, Bourget C, Daculsi R, Bordenave L (2010) Human progenitor‐derived endothelial cells vs. venous endothelial cells for vascular tissue engineering: an in vitro study. J. Tissue Eng. Regen. Med. 4, 473–484. [DOI] [PubMed] [Google Scholar]
- 38. Prasad Chennazhy K, Krishnan LK (2005) Effect of passage number and matrix characteristics on differentiation of endothelial cells cultured for tissue engineering. Biomaterials 26, 5658–5667. [DOI] [PubMed] [Google Scholar]
- 39. Sreerekha PR, Divya P, Krishnan LK (2006) Adult stem cell homing and differentiation in vitro on composite fibrin matrix. Cell Prolif. 39, 301–312. [DOI] [PMC free article] [PubMed] [Google Scholar]
- 40. Discher DE, Janmey P, Wang YL (2005) Tissue cells feel and respond to the stiffness of their substrate. Science 310, 1139–1143. [DOI] [PubMed] [Google Scholar]
- 41. Ferrenq I, Tranqui L, Vailhe B, Gumery PY, Tracqui P (1997) Modelling biological gel contraction by cells: mechanocellular formulation and cell traction force quantification. Acta Biotheor. 45, 267–293. [DOI] [PubMed] [Google Scholar]
- 42. Nehls V, Drenckhahn D (1995) A microcarrier‐based cocultivation system for the investigation of factors and cells involved in angiogenesis in three‐dimensional fibrin matrices in vitro. Histochem. Cell Biol. 104, 459–466. [DOI] [PubMed] [Google Scholar]
- 43. Weisel JW (2004) The mechanical properties of fibrin for basic scientists and clinicians. Biophys. Chem. 112, 267–276. [DOI] [PubMed] [Google Scholar]
- 44. Liu W, Jawerth LM, Sparks EA, Falvo MR, Hantgan RR, Superfine R et al. (2006) Fibrin fibers have extraordinary extensibility and elasticity. Science 313, 634. [DOI] [PMC free article] [PubMed] [Google Scholar]
- 45. Guthold M, Liu W, Sparks EA, Jawerth LM, Peng L, Falvo M et al. (2007) A comparison of the mechanical and structural properties of fibrin fibers with other protein fibers. Cell Biochem. Biophys. 49, 165–181. [DOI] [PMC free article] [PubMed] [Google Scholar]
- 46. Eyrich D, Gopferich A, Blunk T (2006) Fibrin in tissue engineering. Adv. Exp. Med. Biol. 585, 379–392. [DOI] [PubMed] [Google Scholar]
- 47. Akpalo E, Larreta‐Garde V (2010) Increase of fibrin gel elasticity by enzymes: a kinetic approach. Acta Biomater. 6, 396–402. [DOI] [PubMed] [Google Scholar]
- 48. Cho HJ, Lee N, Lee JY, Choi YJ, Ii M, Wecker A et al. (2007) Role of host tissues for sustained humoral effects after endothelial progenitor cell transplantation into the ischemic heart. J. Exp. Med. 204, 3257–3269. [DOI] [PMC free article] [PubMed] [Google Scholar]
- 49. Zhang Y, Ingram DA, Murphy MP, Saadatzadeh MR, Mead LE, Prater DN et al. (2009) Release of proinflammatory mediators and expression of proinflammatory adhesion molecules by endothelial progenitor cells. Am. J. Physiol. Heart Circ. Physiol. 296, H1675–H1682. [DOI] [PMC free article] [PubMed] [Google Scholar]
- 50. Morimoto H, Takahashi M, Izawa A, Ise H, Hongo M, Kolattukudy PE et al. (2006) Cardiac overexpression of monocyte chemoattractant protein‐1 in transgenic mice prevents cardiac dysfunction and remodeling after myocardial infarction. Circ. Res. 99, 891–899. [DOI] [PubMed] [Google Scholar]
- 51. Jensen T, Kierulf P, Sandset PM, Klingenberg O, Joo GB, Godal HC et al. (2007) Fibrinogen and fibrin induce synthesis of proinflammatory cytokines from isolated peripheral blood mononuclear cells. Thromb. Haemost. 97, 822–829. [DOI] [PubMed] [Google Scholar]
- 52. Niwa H, Miyazaki J, Smith AG (2000) Quantitative expression of Oct‐3/4 defines differentiation, dedifferentiation or self‐renewal of ES cells. Nat. Genet. 24, 372–376. [DOI] [PubMed] [Google Scholar]
- 53. Chambers I, Colby D, Robertson M, Nichols J, Lee S, Tweedie S et al. (2003) Functional expression cloning of Nanog, a pluripotency sustaining factor in embryonic stem cells. Cell 113, 643–655. [DOI] [PubMed] [Google Scholar]
- 54. Romagnani P, Annunziato F, Liotta F, Lazzeri E, Mazzinghi B, Frosali F et al. (2005) CD14+CD34low cells with stem cell phenotypic and functional features are the major source of circulating endothelial progenitors. Circ. Res. 97, 314–322. [DOI] [PubMed] [Google Scholar]
- 55. Baal N, Reisinger K, Jahr H, Bohle RM, Liang O, Munstedt K et al. (2004) Expression of transcription factor Oct‐4 and other embryonic genes in CD133 positive cells from human umbilical cord blood. Thromb. Haemost. 92, 767–775. [DOI] [PubMed] [Google Scholar]
- 56. Kucia M, Wu W, Ratajczak MZ (2007) Bone marrow‐derived very small embryonic‐like stem cells: their developmental origin and biological significance. Dev. Dyn. 236, 3309–3320. [DOI] [PubMed] [Google Scholar]
- 57. Song N, Jia XS, Jia LL, Ma XB, Li F, Wang EH et al. (2009) Expression and role of Oct3/4, Nanog and Sox2 in regeneration of rat tracheal epithelium. Cell Prolif. 43, 49–55. [DOI] [PMC free article] [PubMed] [Google Scholar]
- 58. Ruger BM, Breuss J, Hollemann D, Yanagida G, Fischer MB, Mosberger I et al. (2008) Vascular morphogenesis by adult bone marrow progenitor cells in three‐dimensional fibrin matrices. Differentiation 76, 772–783. [DOI] [PubMed] [Google Scholar]
- 59. Gauthaman K, Venugopal JR, Yee FC, Peh GS, Ramakrishna S, Bongso A (2009) Nanofibrous substrates support colony formation and maintain stemness of human embryonic stem cells. J. Cell. Mol. Med. 13, 3475–3484. [DOI] [PMC free article] [PubMed] [Google Scholar]