

Abstract
Abstract. Analyses of DNA pattern provide an excellent tool to determine activity states of bacteria. Bacterial cell cycle behaviour is generally different from the eukaryotic one and is pre‐determined by the bacteria's diversity within the phylogenetic tree, and their metabolic traits. As a result, every species creates its specific proliferation pattern that differs from every other one. Up to now, just few bacterial species have been investigated and little information is available concerning DNA cycling even in already known species. This prevents understanding of the complexity and diversity of ongoing bacterial interactions in many ecosystems or in biotechnology. Flow cytometry is the only possible technique to shed light on the dynamics of bacterial communities and DNA patterns will help to unlock the hidden principles of their life. This review provides basic knowledge about the molecular background of bacterial cell cycling, discusses modes of cell cycle phases and presents techniques to both obtain DNA patterns and to combine the contained information with physiological cell states.
INTRODUCTION
Bacteria are the prevailing organisms of our biosphere. For example, 3.6 × 1029 microbial cells with a total cellular carbon content of about 3 × 10¹⁷ g are documented as living in the oceans. Bacteria are responsible for 98% of primary carbon production and are important mediators in all biogeochemical cycles (Sogin et al. 2006). Furthermore, the human intestinal microbiota was recently described as being composed of 1013–1014 microorganisms, with a collective genome containing at least 100 times as many genes as the human genome. The authors go on to describe humans as superorganisms whose metabolism represents an amalgamation of microbial and human attributes (Gill et al. 2006). Therefore, bacteria are integrated in numerous ways in human life and yet nearly no tools are available to reliably determine their activity in either natural bacterial communities or in the neighbourhood of other cells.
At this point, we suggest the analysis of bacterial DNA patterns that can be used substantially as an excellent tool for determining activity states of bacteria. The activity and performance of bacteria is frequently dependent on their population growth, the velocity of this growth and their physiological state. These are generally related to cell cycle events or at least they are considered to be related to distinct quantities of cellular DNA. Since DNA contents have been found to oscillate throughout the bacterial life cycles and also to be highly variable between different bacterial species, we found the analysis of these quantities to be useful to obtain status information of the species under investigation. Bacterial DNA quantities, aside from coded information, are an effective tool for understanding life cycle and survival behaviour of these microorganisms. This can be effectively followed by combining skilful cell culture techniques with analysis of chromosome contents involving fluorescent dyes and flow cytometry. The DNA patterns mirror the number of chromosomes inside individuals, the state of an individual in the cell cycle and population growth conditions as applied to a species.
Resulting DNA distribution patterns provide valuable information: an asynchronous growing population (a typical way of growth in nature) always contains individuals with different chromosome contents. The individuals are grouped to subpopulations with chromosome contents of Cn and C2n (eukaryotic‐like cell cycle: asymmetric or symmetric cell division, respectively), or Cxn (uncoupled DNA synthesis). Furthermore, number of subpopulations and number of individuals comprising the subpopulations create a characteristic pattern, which is determined by the kind of species investigated, the kind of substrate(s) supplied, as well as microenvironmental conditions available.
An overview is provided below of how bacterial DNA patterns are generated, which information can be obtained from the distribution of subpopulations and which patterns are already known. The review is intended to encourage the routine use of flow cytometry together with common cell culture techniques. In cases of community studies, flow cytometry is unparalleled in providing knowledge regarding bacterial activity states that lies hidden behind individual bacterial chromosome quantities.
Molecular background of bacterial cell cycle
Bacterial DNA accounts for only about 3–4% of the total cellular components (dry mass). Most bacteria possess one circular chromosome, the faithful replication of which has been extensively investigated, mainly in the Gram‐negative gammaproteobacterium Escherichia coli and the Gram‐negative alphaproteobacterium Caulobacter crescentus, as major research model organisms at the current time. Valuable overviews have been provided by McAdams & Shapiro (2003), Thanbichler et al. (2005) and Gitai et al. (2005b). Replication and cell division are tightly bound together via regulation, to ensure that each cell receives an accurate copy of its DNA to ensure survival. Because bacteria live mainly as single‐cell organisms, the mode of replication implicitly depends on microenvironmental conditions, and thus on the activated metabolic pathways as well as the metabolites, and energy available for the replication procedure. Over the last few years, knowledge on this has dramatically increased, largely due to the invention of high‐throughput technologies together with the availability of sequenced bacterial genomes (Nierman et al. 2001), analysis of gene expression and protein synthesis (e.g. 2966 predicted open reading frames, about 550 genes, which are regulated in a cell cycle‐dependent manner, Laub et al. 2000; expression of 979 proteins, Grunenfelder et al. 2001, both citations regarding C. crescentus).
Reliable bacterial proliferation requires replication of DNA, separating the replicated DNA molecules, segregation of sister chromosomes into daughter cells and coordination of these events with cell division. The DNA is composed of high energetic and independently supercoiled domains, with each of its topological regions uncoupled from the rest of the chromosome (Thanbichler et al. 2005). Replication starts at the origin, oriC, and passes off bidirectionally until two replication forks meet in the terminus region, ter, which is found opposite oriC. The initiation protein is DnaA which, after binding ATP, unwinds the A/T‐rich region near oriC, and is controlled by its antiplayer SeqA (for an overview, see Messer 2002; Kaguni 2006). Functioning of DnaA is described to be dependent on the number of its molecules, which needs to correlate with cell mass. Initiation occurs in every cell, when a certain cell mass per origin, the initiation mass, has been reached. The faster the growth, the higher the cell mass, the more origin copies are present in a bacterial cell (Atlung et al. 1987; Christensen et al. 1999). Whereas several determinants, which are involved in replication regulation, are located near the origin, those are involved in segregation are located in the terminus region (Louarn et al. 2005). Several concepts have been developed concerning how the chromosomes are distributed between mother and daughter cells (Gitai et al. 2005a). Initial concepts envisaged passive displacement of the chromosomes and were further developed into the transertion‐mediated segregation model. Here, chromosomes are described as being linked to the cell membrane and are simply separated via cell growth. A third model describes segregation as occurring by biased transcription. Another model focused on the stationary mid‐cell position of the replisome (in E. coli), in such a way that mother DNA was transported into the centre of the cell and the extruded daughter strands were directed into the developing nascent daughter cell compartments. Recent work implies that cytoskeletal structures might also be involved (Gitai et al. 2005b). It is well known that during replication, segregation and cell division, chromosomes move spatially through the cell to specific positions to ensure their correct organization and subcelluar placement (Niki et al. 2000; Viollier et al. 2004). Movement of the origin within the cell seems to be connected to growth rate; its speed reaches values of about 0.1–0.3 µm/min (overview by Thanbichler et al. 2005). In E. coli, some investigations suggest that newly replicated regions of the chromosome cohere to each other for a time before separating (Sunako et al. 2001; Li et al. 2002; Bates & Kleckner 2005) and that sister nucleoids might not be characterized by mirror symmetry (2006, 2005). The construction of a septum is a subsequent event, and starts with the assembly of cell division proteins like FtsZ, FtsA and ZipA. These form a Z ring, the maintenance of which, during the process of septation, is energy‐dependent (Rueda et al. 2003). Finally, in E. coli, the principle of the nucleoid occlusion law was verified, a mechanism by which bacteria prevent cell division until chromosome segregation has been completed (Roos et al. 2001; Wu & Errington 2004).
In C. crescentus, the cell cycle is coupled to a cellular differentiation programme (Jensen 2006). The daughter cell shows no replication activity. This is in contrast to the prosthekate, immobile and proliferating mother cell, which is bound to the soil surface, whereas the daughter cell exhibits swarming in the water body. Protein CtrA silences the Caulobacter origin of replication and needs to be proteolysed in stalked cells, thus preparing them to initiate DNA replication (Jenal & Fuchs 1998; Holtzendorff et al. 2004; Ryan et al. 2004; Brazhnik & Tyson 2006). For movement of the chromosome, DNA translocase FtsK has been implicated as being responsible. In Caulobacter, this is a highly conserved molecule, deposited near the terminus at the division site (Pease et al. 2005). Cell division is initiated by the translation of the septum‐forming ftsZ gene, followed by ftsQ and ftsA transcription during late S phase (short overview by Amick & Brun 2001). Transcription ftsQA appears to be a checkpoint, coupling DNA replication and cell division via CtrA rates (Wortinger et al. 2000). By combining analysis of the replication activity using flow cytometry and following location of the origin‐proximal part using LacI‐CFP binding to the lac operator cassette near the origin, Jensen (2006) found no cohesion of the newly replicated origin‐proximal regions of the chromosomes. This is in contrast to the events proceeding during chromosome separation in E. coli. However, a significant delay in separation of the replicated terminus regions was observed. Additionally, cell division seems to be initiated before the final segregation of the daughter chromosomes in Caulobacter, so it appears that nucleoid occlusion is not occurring as he implies for this species.
As is stressed by many researchers in this field (Gitai et al. 2005b), only the tip of an iceberg has yet been uncovered. Despite the two species mentioned above and some few other limited investigations, for example, Bacillus and Staphylococcus sp. (Wallberg et al. 1999) as well as Anabaena sp. (Sakr et al. 2006), just few studies have used flow cytometry to elucidate the proliferation mechanism in other bacteria. In addition, spatial and temporal dynamics of the involved machineries already investigated are far more sophisticated than had previously been thought.
Resolving bacterial cell cycle phases
Eukaryotic organisms present general cell cycle behaviour that is universal in so far as that it remains the same through successive rounds of replication and has been found to proceed and be regulated in similar ways in humans, animals, plants and even in yeast (Krishan et al. 2005; Achilles et al. 2006; Suda & Trávnièek 2006; Zucker 2006). This, however, is not true for the bacterial cell cycle (and also for the archaea). As close as eukaryotic roots are situated within the phylogenetic tree, considering the related mechanisms of eukayotic proliferation mechanisms, so far from each other are the ways of cell cycle operation in bacterial species (Angert 2005). Different metabolic traits possessed by bacteria and the strategies that enable them to live under completely different environmental conditions are mirrored by their diversity within the phylogenetic tree and are reflected in their way of proliferation. The eukaryotic cell cycle proceeds through phases G1, S, G2/M and G0, in which changed cytometric distributions are routinely used today to investigate human diseases (Potter & Wener 2005), virus impacts (Asmuth et al. 2005) or drug effects (Olive & Durand 2005; Schwock et al. 2005; Garner et al. 2006).
This universal mode of cell proliferation is only partly mirrored in bacterial cell cycle behaviour. The small dimensions of bacteria, and on occasion, the low concentrations of cells in specific cell states can, however, cause considerable analytical problems. Therefore, synchronized cultures have long been involved in bacterial cell cycle investigation because such approaches are amenable to classical analytical methods. For some species, these combined techniques provided information concerning cell cycle progression and regulation, which was sufficient to understand the functioning of a single cell. Cooper (1991) and Hemstetter et al. (2003) used synchronized cultures produced by the membrane elution method. Others synchronized growth of microorganisms to a lesser extent by continuous phasing (Fritsch et al. 2005), or use microorganisms where daughter and mother cells could easily be separated by their morphological characteristics and physiological behaviour, as in C. crescentus (Poindexter 1981; Marczynski & Shapiro 1995; Laub et al. 2000; Ryan et al. 2004; Jensen 2006). To date the only archeal genus species reported to be synchronized is Sulfolobus (Bernander 2000). The advantages of these techniques are that a relatively homogeneous population is obtained, and enough cell mass is available to investigate cell cycle events at the molecular level. Disadvantages are that these methods only work for a limited number of organisms because they require distinct physiological features and additionally they might impact cell physiology because of the type of the synchronization method. Therefore, up to now, synchronization has not been suitable for many species. In general, synchronization is relatively unstable and is lost after a few rounds of DNA replication. Furthermore, it has not been possible to synchronize cells grown in an uncoupling mode of replication. Another possibility to isolate larger amounts of similar cells in a cell cycle is fractionating via centrifugation. Many methods have been described for this application. However, in addition to the requirement that centrifugation requires distinct sedimentation behaviour of the subpopulations contained within the population (density and size of different cell types), the technique regularly produces blurred bands lacking in purity (Pertoft 2000; Müller et al. 2001).
Flow cytometry has turned out to be a suitable alternative for investigating the bacterial cell cycle. The technique has been shown to be suitable for probing the dynamics of individual cells within a microbial population and for characterizing their physiological status (Steen & Boye 1980; Skarstad et al. 1986; 1992, 1991). Following the proportion of cells in different subpopulations over time opens the possibility of determining quantities of cells inside a population that are just proliferating, about to divide, or in a separate stage from these two. These quantities provide information on how many individuals are proliferating, dividing or are inactive and waiting for better conditions before joining the cell cycle again.
Modes of bacterial DNA cell cycle phases
As early as 1958, Schaechter et al. (1958) made observations of bacterial growth and division behaviour. This was subsequently followed by the work of Donachie, Cooper and Helmstetter who presented an extensive narrative portrayal of the pattern of DNA replication (Helmstetter 1967, 1968, 1969; Donachie 1968; Helmstetter & Cooper 1968; Cooper 1969, 1979, 1990, 1991, 2004, 2006). They showed that the time for DNA replication (the C phase) and the time necessary for cell division (the D phase) were relatively invariant. There is also a third period B described by the authors. B is defined as the period between birth and the initiation of the C phase. This phase shortens if growth conditions improve until these are nearly optimal for swift growth. In such a situation B disappears. When analysed by flow cytometry, a pattern evolves which is similar to the patterns always obtained during eukaryotic cell cycle investigations. Therefore, populations behaving in such a way are declared to present eukaryotic‐like cell cycle behaviour. If growth rates are even higher, DNA synthesis can be continuous during the division cycle. Initiation of replication occurs again before the still running replication cycle is finished and cell division is completed. This behaviour is called uncoupled DNA synthesis.
These are the basic proliferation activities that can be easily followed by the DNA patterns obtained from flow cytometry. At an interdivision time of B + C + D, the first subpopulation in a typical DNA histogram contains the quantities of cells containing the single chromosome equivalent (Fig. 1; eukaryotic‐like cell cycle of Sphingomonas sp. LB126, grey distribution). The second subpopulation contains the cells with the double chromosome equivalent (Fig. 1; eukaryotic‐like cell cycle of Sphingomonas sp. LB126, black distribution), as shown at the double linear histogram position. In between are those cells that proliferate. These distributions change the more as the B time is diminished because of an increase in the growth rate. Uncoupled DNA synthesis is indicated by DNA contents with a minimum of more than one chromosome equivalent per cell and a maximum that represents many multiples of chromosomes that depends on the species cultivated and the growth conditions applied (Fig. 1; uncoupled DNA synthesis of E. coli K12). However, in between such limits all DNA contents are possible. This behaviour is very precisely and carefully documented by Cooper (1991).
Figure 1.
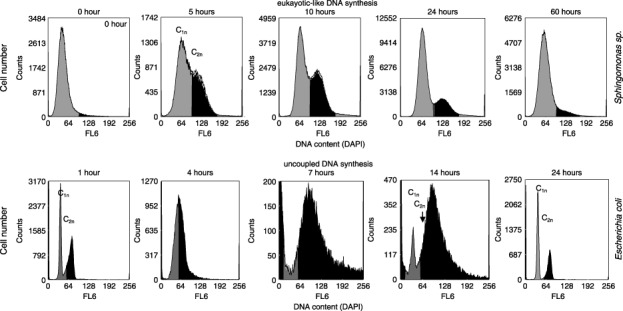
Eukaryotic‐like DNA synthesis: flow cytometric analysis of the DNA content of Gram‐negative Sphingomonas sp. LB126 cultivated for 60 h. The species was grown aerobically at 20 °C and pH 7.5 in 500 mL shake flasks with 300 mL minimal medium at 150 r.p.m. The carbon and energy source was glucose (1 g/L). The harvested cells were centrifuged at 3200 g for 5 min, fixed with 10% NaN3, and stored at 4 °C. Bacterial DNA was stained by treatment of 2 mL of diluted cell suspension (3 × 10⁸ cells per millilitre) with 1 mL solution A (2.1 g citric acid/0.5 g Tween 20 in 100 mL bidistilled water) for 10 min. Afterwards the cells were washed and re‐suspended in 2 mL solution B (0.24 µm 4′,6‐diamidino‐2‐phenylindole [DAPI, SIGMA], 400 mm Na2HPO4, pH 7.0) for at least 20 min (according to Shi et al. 2007). Flow cytometric measurements were carried out using a MoFlo cell sorter (DakoCytomation, Fort Collins, CO, USA) equipped with two water‐cooled argon‐ion lasers (Innova 90C and Innova 70C from Coherent, Santa Clara, CA, USA). Chromosome equivalents are presented as C1n and C2n. Uncoupled DNA synthesis: The Gram‐negative Escherichia coli K12 was grown aerobically at 30 °C and pH 7.5 for 24 h in 500 mL shake flasks at 150 r.p.m. on 300 mL peptone media (L): 5 g peptone from meat (pancreatic), 3 g NaCl, 2 g K2HPO4, 10 g meat extract, 10 g yeast extract, 5 g glucose. The staining procedure and device equipment was the same as above though the DAPI concentration was enhanced to 0.5 µm DAPI within solution B. Chromosome equivalents are presented as C1n and C2n. Uncoupled DNA synthesis is shown to be performed between the 7th and 14th hours.
We propose another phase in bacterial cell cycle progression that is obvious when growth conditions are limiting (Fig. 2). The B phase (white bar) is described to mark the time between birth and initiation of the C phase (black bar). Some bacterial species, however, have been found not to divide after finishing replication and remain at the end of the C phase until better conditions occur. A good example for such a strategy is shown by the Gram‐positive species Rhodococcus erythropolis K2‐3, which belongs to the Nocardiaceae. This species tends to form small hyphae under limiting growth conditions and accumulates up to four copies or more of the original DNA equivalent (Goodfellow et al. 1998; Müller et al. 2002). Because we have found such behaviour in many species, we suggest that a further period occurs within the bacterial cell cycle. We have designated the time between the end of replication and the start of the D phase (dark grey bar) the pre‐D phase (light grey bar). This period disappears under optimal growth conditions in a similar manner to the B phase. Michelsen et al. (2003) suggested a variation of D phase (without inventing a pre‐D time) that is dependent on growth velocity in slow growing E. coli cultures. We suggest that changing pre‐D times might represent the changing numbers of cells containing the double chromosome equivalent under increasingly limiting growth conditions. It also represents the inability of some, but not all, cells to divide because of individually related limited energy stores necessary for daughter cell separation. Length of the D phase is assumed to be nearly constant as described by Cooper (see above). Nevertheless, shapes of the histograms change because of an altering pre‐D phase. As described previously and has been observed for many different species, replication and separation of the chromosomes inside a cell is a very complicated process. However, this does not necessarily need to be followed by separation of the daughters themselves. On the other hand, this behaviour might be a species‐specific feature. Our observation is that under limiting growth conditions some species use the metabolites and energy drawn from the still available, but nearly mineralized, substrate to perform cell division after finishing replication, whereas others do not (Müller & Babel 2003). It is remarkable that the existence of a stop in cell cycle activities in the middle of a pre‐D phase might be species but not substrate related. We have observed the pre‐D phase to be independent of the quality of the substrate supplied in both Gram‐negative and Gram‐positive bacteria: Acinetobacter calcoaceticus on phenol and acetate (Fig. 2, also Herrmann et al. 1997; Müller et al. 2000), Ochrobactrum anthropi on glucose, xylitol, 2,4‐dichlorophenol and 2,4‐dichlorophenoxybutyric acid, R. erythropolis on glucose, xylitol and succinate (Fig. 2, also Müller et al. 1999; Müller et al. 2002), Sphingomonas sp. on glucose and fluorene, Mycobacterium frederiksbergense on glucose and anthracene (Shi et al. 2007). Therefore, we conclude that the occurrence of the pre‐D phase under limiting growth conditions might be a species‐related feature that probably reflects the proteome equipment of a species under certain limiting growth conditions. When, after exhaustion of carbon and energy sources, cells remaining in pre‐D phase are inoculated into fresh medium, they divide. An immediate increase in cell number is observed, followed by an increase in their individual cell mass, analysed via forward and side scatter modes, and which result in start of proliferation.
Figure 2.
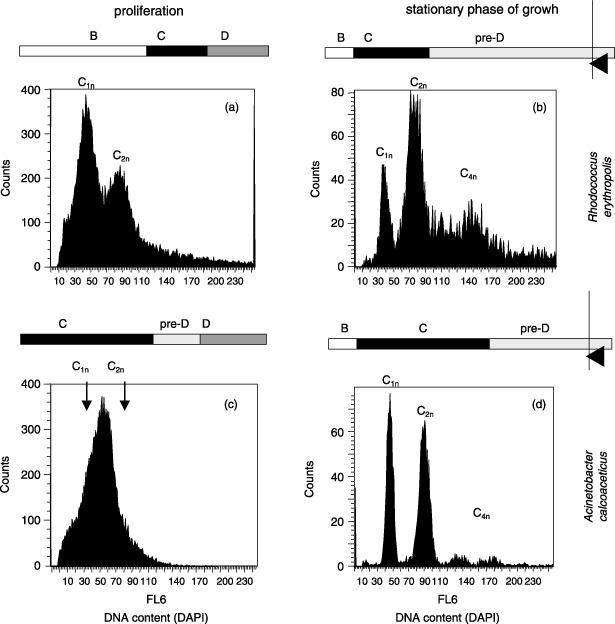
The gram‐positive Rhodococcus erythropolis K2‐3 (a,b) was cultivated aerobically in 150 mL batches in standard medium on xylitol (2 g/L) at 30 °C with µmax = 0.144 hours. The gram‐negative Acinetobacter calcoaceticus 69‐V (c,d) was cultivated aerobically in 150 mL batches in standard medium on 0.01% phenol at 30 °C with µmax = 0.35 hours. The staining procedures and device equipment were the same as described in Figure 1 (DAPI concentration: 0.24 µm DAPI within solution B). On the left side are shown the histograms obtained from samples harvested during exponential growth phase, whereas on the right side the same species were harvested under limiting growth conditions. The bars represent the existence as well as a rough duration of cell cycle phases. (a) Cells growing in a eukaryotic‐like manner. Since the main part of cells contain one chromosome equivalent under the given conditions the distribution suggest a short time necessary for replication (C phase), followed by a short time necessary for cell division (D phase). A longer B phase is abounding until cells start proliferation again. (b) Under limiting conditions some cells are able to divide (subpopulation C1n), yet most of them do not, forming small hyphae (subpopulations C2n and C4n). They stay in the pre‐D phase waiting for better conditions to grow. (c) Cells growing in a eukaryotic‐like manner. The B phase vanished, almost all cells perform replication (long C phase). Since only few cells stay in C2n the pre‐D and D phases are short. (d) Under limiting conditions A. calcoaceticus do not form hyphae as described for R. erythropolis, yet some of the cells divide (subpopulation C1n) and others do not and form tightly paired coccoidal connections (subpopulation C2n, C3n, C4n).
The meaning of cell cycle distributions in a bacterial DNA histogram
Within typical eukaryotic‐like cell cycle progression of a population, some cells contain the single chromosome equivalent; others the double one, whereas some cells proliferate (Fig. 1). However, it is generally unknown how many chromosomes are contained within the first distribution of a DNA histogram. What presents itself as the first chromosome equivalent might already contain two identical chromosomes or even more. The real number of chromosomes of a bacterium is seldom known, especially if the species investigated is enriched from environment. To determine basic chromosome numbers, the DNA of a species needs to be sequenced and its individual quantitative DNA content estimated. Doing this, some bacterial species have been found to possess not only multiples of identical chromosomes but also chromosomes of different size and function. This has been found for Ralstonia solanacearum (Coenye & Vandamme 2005), Vibrio cholerae and some Burkholderia species (Egan et al. 2005). Since the verification of the basic DNA equipment of a species is labour intensive, there is agreement not to estimate real chromosome numbers each time one deals with a new species. Information on individual physiological states is abundantly available, even if the first DNA distribution in a histogram is not resolved down to its chromosomal composition. The first DNA distribution in a histogram should always be seen as the benchmark subpopulation if the bacteria were grown under adequate and practically stress‐free growth conditions. Thus, cell cycle behaviour should be determined over different culture times, and the subpopulations should be named according to position of the first distribution in the histogram as Cn, C2n and so on, where C stands for chromosome equivalent and n for the number of the smallest found chromosome equivalent in one cell, using flow cytometry.
One should be mindful of a further important fact hidden behind DNA subpopulation distributions if growing bacteria are analysed. Bacteria possess various strategies to perform cell division, and these are strictly species‐related. Up to now, several types of cell division procedures have been described, among them the classic symmetric (e.g. the soil bacterium Pseudomonas putida) and asymmetric (e.g. the marine bacterium Desulfobacula toluolica) cell division types (Fig. 3). Bacteria performing symmetric cell division will display a doubling of the chromosome contents like Cn, C2n, C4n and so on. Other microorganisms divide asymmetrically and display patterns, such as Cn, C2n, C3n, C4n, C5n. Symmetric, or so‐called binary fission, is a widespread mechanism of cell division in many bacterial species. Whereas here, in two nearly equivalent daughter cells, a polar septum is produced in case of asymmetric cell division. Two, often morphologically different daughter cells, are generated which, as in case of C. crescentus, might be spatially isolated from each other in their living space. Budding bacterial cells are also widely distributed, especially within the marine microorganisms. Examples are the above mentioned D. toluolica and Muricauda ruestringensis, the latter showing symmetric cell division under optimal growth condition whereas swarming and coccoidal cells with non‐duplicate chromosome equivalents are generated under limiting population growth conditions (Müller et al. 2001). This behaviour might be an evolutionary outcome for adaptation to low‐nutrient containing water surroundings, where swarming daughter cells are able to more easily find better conditions for growth. Some soil bacteria also show asymmetric cell division. An example is Streptomyces coelicolor where proliferation occurs a priori without cell division. The species generates a mycel consisting of hyphen‐like multichromosomal filaments that divide synchronously under distinct limiting conditions into spores containing only one chromosome (Kelemen et al. 2001). Apart from the licensing/initiation‐mass model of Bates & Kleckner (2005), who described that the ‘occurrence of cell division may per se license the chromosome(s) for the next round of replication initiation’, to date many species have been found to behave otherwise. The strategy of some species of preventing cell division under conditions of nutrient exhaustion is probably dictated on the one hand by the costly need for energy and metabolites in order to perform cell division and on the other hand by the universal feature of bacteria of staying together if growth conditions worsen. Then again, an archaea, such as Methanothermobacter thermoautrophicus (Majernik et al. 2005), has been found to display synchronous cell division of long filaments after nutrient limitation. Further peculiar features of replication and cell division proceedings have been shown for the archaea Methanocaldococcus jannaschii that contains an excess of chromosome copies under both optimal and limited growth conditions, and displays asynchronous initiation of replication and unequal distribution of chromosomes to daughter cells (Maisnier‐Patin et al. 2002). An overview concerning different modes of cell cycle organization of archaea is provided in a review by Bernander (2000). The very different types of growth and proliferation regarding phenotype and DNA pattern in bacteria and also in archaea indicate the enormous diversity of possible replication and chromosome separation mechanisms, along with cell division, in addition to the mechanisms described for C. crescentus and E. coli.
Figure 3.
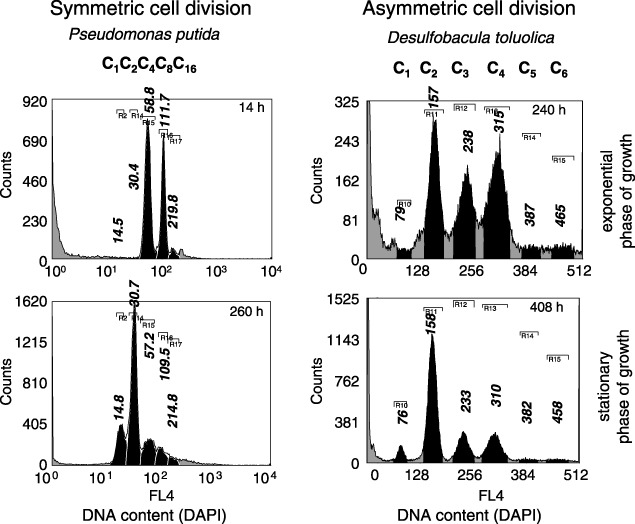
P. putida KT 2440 was cultivated on benzoate (3 g/L) in a chemostat at dilution rates below 0.05 hours at 30 °C. The bioreactor was started as batch culture (above 14 h) and continued as chemostat (260 h). D. toluolica was grown anaerobically with toluene as sole source of carbon and energy, batch‐wise, in a bicarbonate‐buffered mineral salt medium for marine sulphate‐reducing bacteria. Usually, the medium was spiked with 30 mL/L HMN‐toluene. For cultivation, 56 or 118 mL serum bottles were used, which were filled with 50 or 100 mL culture suspension, respectively, and closed with Teflon‐coated butyl rubber stoppers. The staining procedures and device equipment were the same as described in Figure 1 (DAPI concentration: 0.5 µm DAPI within solution B, one washing step less for D. toluolica because of the mechanical fragility of the organism; see Vogt et al. 2005). Cells were harvested during exponential (top‐histograms) and stationary (button‐histograms) phases of growth. P. putida shows the typical symmetric, whereas D. toluolica represents the asymmetric cell division behaviour as is indicated by the mode values of the subpopulations.
DNA pattern also provides further information when cells enter starving states. Starving is the typical situation in the environment to which bacteria are exposed. Under such conditions, DNA can be degraded. In such a case, cells might show DNA distribution that is below Cn, as has been shown for Cupriavidus necator grown at phenol concentrations that were at the borderline of being toxic, thus preventing substrate turnover. We have been able to prove that C. necator reduced its usual B phase chromosome content by half, and we called these individuals ‘off‐cell‐cycle cells’. These dormant cells clearly kept their protein synthesis machinery going by preparing themselves for entering the life cycle again via expressing proteins involved in protein translation such as the elongation facter Tu, and the ribosomal protein S1 (Wiacek et al. 2006). We assume that many bacteria usually contain more than the single chromosome content under moderate growth conditions and degrade DNA to an operable minimum only under stress if they need energy or metabolites to survive. These off‐cell‐cycle cells are able to join the cell cycle again under better growth conditions (Wiacek et al. 2006). However, if the conditions worsen, cells contain only parts of the original Cn content or loose their DNA entirely, which is obvious from highly spread DNA histogram distributions below the Cn/2 content. This inevitably means cell death. Such cells or ‘ghosts’ are often described as being present in marine environments (Hessenberger et al. 1996).
DNA patterns and cell physiology
To understand why cell proliferation patterns are so useful for determining bacterial physiological states, individual life strategies of these organisms need to be kept in mind; these are multiplication and survival. Under favourable microenvironmental conditions bacteria will multiply quickly but with a decreasing velocity the more restrictive the growth conditions become. This will alter individual number of chromosomes. If growth conditions decline even more they will end the proliferation process and concentrate on accumulation of carbon and energy resources by storing lipids or/and carbohydrates. Finally, under depleted growth conditions, they change to maintenance and will degrade cell contents to obtain metabolites and energy, among them DNA itself. Different growth rates are mirrored adequately by number of DNA subpopulations and the quantities of the cells inside these subpopulations. However, although such changes will be not observed under limited conditions, the consistent pattern will be specific for a well‐defined situation of a particular species. The same is true for DNA patterns generated by organisms during maintenance. Some species are known to degrade their DNA within hours; others maintain their DNA equivalents for months. Therefore, together with bulk information, DNA patterns of non‐growing populations might release information on whether cells are storing up resources or are already in a maintenance state.
Kind of bacterial cycling is on the one hand caused by the genetic background of a species and on the other by quality and quantity of a substrate, as well as the microenvironmental conditions present. Under optimal or moderate growth conditions, DNA synthesis is tied to bacterial reproduction. We have observed that eukaryotic‐like cell cycling proceeds when a species has had a low affinity for a specific substrate. An example is the relatively poor growth of Rhodococcus erythopolis K2‐3 on xylitol or succinate, even at high or non‐toxic stationary substrate concentrations (Müller et al. 2002). Furthermore, partial availability of metabolic pathways and/or slow kinetics of the enzymes involved are further factors that may prevent uncoupled DNA synthesis and high growth rates. For example, low substrate concentrations of phenol have resulted in a eukaryotic‐like cell cycle of C. necator, which mineralized the substrate via the low efficiency ortho‐pathway. An increasing substrate's supply led to additional expression of the meta‐pathway, which, at distinctly enhanced substrate concentrations resulted in increased proliferation activity of this species. In this case, the additional energy and metabolites provided by the meta‐pathway were not sufficient to induce uncoupled DNA synthesis. However, change in the eukaryotic‐like cell cycle pattern clearly demonstrated escalating growth behaviour of the species (Wiacek et al. 2006). A more straightforward behaviour pattern showed the species A. calcoaceticus during growth on phenol, where proliferative activity increased in an almost linear manner with the substrate supply until starting uncoupled mode of DNA synthesis (Müller et al. 2000; Müller & Babel 2003). In addition, low substrate concentrations resulted in eukaryotic‐like cell cycle modes despite the high affinity of the species for the substrate. Analysing DNA synthesis enabled the speed of its synthesis to be measured and switching points to be detected within different kinds of eukaryotic‐like to uncoupled modes of proliferation. At the metabolic level, modes of proliferation depend on the ability of a species to use metabolites and energy of a substrate supplied for DNA synthesis. Ability to take up a substrate is the first limiting step, followed by existence of metabolic pathways that mineralize the substrate with a high or low efficiency. Certain aspects of the different efficiencies can be explained, but more often we can only hypothesize about bottlenecks or pacemaker reaction(s) (Babel & Müller 1985). Accordingly, some microorganisms are inclined to direct energy and metabolites mainly into multiplication, whereas others direct energy and metabolites into storage materials. This might occur in parallel but also instead of DNA synthesis. Therefore, in summary, the mode of the bacterial cell cycle depends on substrate concentration, affinity of a species for a substrate, metabolic traits available for using the substrate and on efficiency of the metabolic traits for providing energy and basic metabolites for growth. DNA synthesis stops when energy must be consumed in order to stabilize and maintain the cells as dynamic, living systems.
Cell culture techniques to obtain DNA patterns
Up to now, knowledge of species‐specific cell cycle operation can be obtained only from cultivable bacteria. Different culture techniques are available to elucidate the various life strategies of these organisms. Bacterial populations can present dissimilar successive phases of growth (Neiddhardt 1999). These phases are also described as being deterministic (ongoing replication and division) and stochastic (free of replication and division, Bley 1987). The deterministic phase is characterized by optimal availability of nutrients and growth conditions that meet genotypic optimum for a cell. The stochastic phase emerges under unbalanced growth conditions. Because the nature of substrates and microenvironmental conditions have a strong influence on growth rates of bacteria, culture procedures need particular attention to be paid to them. Determination of length of particular B, C, pre‐D and D phases of individuals within a bacterial population should be performed by culturing them in batch‐cultures containing different substrates. This technique causes semisynchronous growth behaviour and produces defined subdistributions that represent all possible states of the cells in the cell cycle. Number of subdistributions, cell quantities inside a subdistribution and dynamics of these distributions over time allow a rough estimation of cell cycle behaviour (Skarstad et al. 1986). It should be emphasized, as has already been done by many people, including Steen (2000) that cell cycle patterns of a population change during every moment of the culture. Performances of the cells are always dissimilar, even within minutes, as batch‐culture results in unbalanced nutrient compositions or sudden changes in nutrient availability. Bacteria often respond to these via overflow metabolism or, under famine conditions, they might cease proliferation and product synthesis and use still available carbon and energy sources for maintenance and survival (Maskow et al. 2006).
A closer and definite consideration of growth behaviour is possible by involving chemostat techniques to culture bacteria under balanced growth conditions. Under these, bacteria first and foremost replicate and safeguard the genome, although they additionally might induce product synthesis to avoid a loss of energy or to channel reduction‐equivalents. In such situations, intermediates may not find a reaction partner, but are nevertheless synthesized. They polymerize and are stored inside the cell or are channelled into the cell surroundings. Balanced growth conditions result in a population being in a steady state, which is constant in its age distribution and is characterized by historic generation time. Because defined artificial disturbances will produce specific cellular reactions, depending on the stage in the cell cycle, this technique provides knowledge of how a cell may react to distinct disturbances from the microenvironment.
DNA Labelling
Determination of chromosome equivalents using flow cytometry requires application of fluorescent dyes. Frequently, bacterial DNA staining is restricted to fixed cell samples. However, common fixation procedures (e.g. formaldehyde or glutaraldehyde), routinely used for eukaryotic cells, often cause agglutination as well as enhancement of autofluorescence intensities, which prevent flow cytometric analysis of bacteria. Formaldehyde is also known to stabilize and close cell membranes by taping surface proteins and thus to prevent further intracellular labelling of the bacteria. On the other hand, formaldehyde can be used to seal cells to prevent leakage of dyes after staining living cells (Achilles et al. 2006). Additionally, the structure (cell membrane) of bacterial cells can be destroyed, for example, by ethanol, in such a way that the cells’ scatter signal, which is normally chosen as trigger, is no longer efficient enough to cytometrically divide the cell from the noise. Therefore, we strongly recommend using 10% NaN3 for preservation of aerobic culture of bacterial cells. This has been shown to reliably maintain stable DNA distribution for 3 months or more. Anaerobically grown bacteria require other fixation procedures. For example, we use a mixture of 15 mm sodium molybdate and 100 mm hydrogen peroxide to fix sulfate reducers, a procedure that is not as stable as the one described above but works for at least for 2 weeks (Vogt et al. 2005).
Quantitative determination of chromosome numbers of a bacterial cell is up to now still a challenge. Many commercially available flow cytometers are not well suited for analysing such DNA patterns, due to a lack of sensitivity and to inappropriate excitation sources. High sensitivity is necessary in order to obtain good resolution for the scatter signal trigger function. Furthermore, DNA dyes should specifically label DNA stoichiometrically. If bacteria are growing, the RNA content is much higher than the DNA content and thus nucleic acid dyes might provide an inaccurate indication of cell cycle activity. Such dyes include TO‐PRO, the TOTO dye family (Guindulain et al. 1997), ethidium bromide, propidium iodide (Bailey et al. 1977; Hutter & Eipel 1979) and Sytox Green (Veldhuis et al. 1997). Pico Green is highly selective for dsDNA as compared to RNA and is used to segregate high from low‐nucleic acid containing species within natural marine communities (Thyssen et al. 2005). These dyes and others are well described by Shapiro (2003); some of them require disruption of membranes and treatment with enzymes (RNase) for reliable DNA staining. We prefer DAPI (4′,6‐diamidino‐2‐phenylindole) as a dye that labels A/T‐rich regions of DNA in bacteria, and when excited with an ML‐UV‐Laser (180 mW) gives reliable DNA distributions, usually at a concentration of 0.24 µm. This concentration needs to be calibrated for each species newly arrived into the laboratory workload or newly isolated from the environment. As already highlighted by Button & Robertson (2001), DAPI is bright, stable and minimally affected by DNA conformation. Additionally, this dye is easy to combine with others, which are excitable at higher wavelengths, to label further structures or functions within the bacterial cell. It was possible to analyse small 1‐ to 2‐Mb‐genome cells from fresh‐ and seawater as well as low DNA cells (‘dims’ with an apparent DNA content of 0.1 Mb) according to their chromosome contents, after permeabilization with Triton X (Button & Robertson 2001). If living cells are investigated, the dyes used should meet the criteria of low cytotoxicity. A widely used DNA dye is Hoechst 33342 that has so far been applied for investigations into spermatogenesis (Bastos et al. 2005). In addition, we have found Hoechst 33342 to be useful for following cell cycle behaviour in living bacterial cells (Shi et al. 2007). Detection of chromosome numbers in living cells needs an exceptionally careful calibration to prevent any toxic effects of the dye on cell viability. This is, however, easily tested by cell sorting on agar plates. Additionally, a clear assignment needs to be made due to dye pumping.
Bacteria contain a number of active and passive mechanisms to protect themselves against toxic assault. Passive mechanisms include increase and decrease of fluidity or stability of the cell membranes or the cell walls, which occasionally may prevent labelling of the chromosomes. One of the active mechanisms is the ability to immediately transport toxic compounds out of the cells. The expression of such energy‐dependent efflux pumps are known to cause antibiotic resistance (Hsieh et al. 1998). Additionally, cell substrate concentrations can be regulated via such systems. As an example, cellular toluene concentration is, among other mechanisms, reduced by a protein belonging to the resistance nodulation cell division (RND) family, HAE1. An overview concerning various efflux systems is given by Saier (2000). Action of efflux pumps can be diminished or inhibited, for example by adding verapamil, NaN3 or the protonophore m‐chlorophenylhydrazone (CCCP). In the case of verapamil, the compound is described as competing to Hoechst 33342 via binding to the same drug interaction site (Krishan 1987; Borges‐Walmsley et al. 2003).
Future glimpses
Bacteria are used in synthesis of valuable materials, for example pharmaceuticals, antibiotics, enzymes, metabolites and various other compounds. They act as catalysts for degradation and detoxification of hazardous chemicals and they play an increasingly disturbing role in human health. Understanding bacterial physiology, growth behaviour and survival strategies will open ways to use, exploit or fight bacteria on the basis of their inherent characteristics. One of the many tools to do this is to ‘read’ their proliferation patterns and to link this with the basic physiological knowledge of a species (Bartra et al. 2001; Akselband et al. 2005; Mergaert et al. 2006). Once DNA patterns of a species are related to distinct physiological states, a tool is available that can be immediately used to quickly and reliably determine cell states and therefore the metabolic and survival potential of a species.
Current knowledge concerning the diverse multitude of complex bacterial communities and capacities is based mainly on studies of pure microbial cultures. Yet, pure cultures are highly artificial because ecosystems always consist of different taxa that generally use different strategies to gain energy and to survive. However, most bacteria present in nature are not culturable in pure conditions by means of classic methods (Pace 1997). As a result, almost nothing is known concerning complexity and diversity of ongoing bacterial interactions in many ecosystems, which are difficult to determine. Attempts to elucidate microbial interactions have often been made in the past by studying defined mixed laboratory cultures (Pelz et al. 1999) or natural communities by using phylogenetic techniques and simultaneous application of labelled substrates (Lee et al. 1999). Although for a long time the majority of bacteriologists were not aware of the possibilities that flow cytometry offers (Steen 2000); in the meantime, the technique has been shown to be able to analyse single‐cell characteristics within communities. A greater insight is obtained into activities of the members of a community and more informative data are acquired than would be obtained using measurements of average properties on an entire consortium. Up to now, most such investigations have been performed on oceanic samples and have concentrated on phytoplankton containing the picoeukaryotic algae, the less abundant eukaryotic nanophytoplancton and also the numerous prokaryotic cells. These are routinely and quickly enumerated by different flow cytometric technical inventions (Rutten et al. 2005; Zubkov & Burkill 2006). Furthermore, DNA patterns have been useful to specifying the role of known members of bacterial consortia (Müller et al. 2002; Vogt et al. 2005). Studies following the proliferation dynamics within enrichment cultures or natural communities remain scarce until now and might remain a considerable challenge in the near future (Vaulot et al. 1995; Fuchs et al. 2005; Kleinsteuber et al. 2006).
To circumvent the arising future problems, knowledge of bacterial DNA patterns needs to be determined for as many species, substrates and growth rates as possible. These data should be presented as an open source data bank and thus allow for proliferation behaviour of known and even of similar but still unknown species, within communities to be elucidated. Additional techniques should combine approaches, such as phylogenetic analysis as well as metaproteome applications towards distinct functions. To date, particularly if slowly growing species coming from natural environments are investigated, a precise determination of bacterial DNA patterns requires flow cytometers optimally equipped with high‐cost ML‐UV lasers or with a high optical resolution. This is necessary to quantitatively determine the weak fluorescence coming from a single bacterial chromosome.
However, affordable technical improvements are on the way (Shapiro & Perlmutter 2006), and will allow routine analysis of bacterial DNA pattern in future. Increasing phylogenetic, transcriptomic/proteomic and physiological knowledge as well as improved data acquisition, data handling and development of reliable data bases, will push forward the importance of flow cytometry in microbiology. Flow cytometry has already started to conquer microbial biotechnology and to deliver information for systems biology. It will also become a tool to open the gates of knowledge hidden behind the structure of natural bacterial communities.
REFERENCES
- Achilles J, Harms H, Müller S (2006) Physiology of living S. cerevisiae cells – a three colour approach. Cytometry A 69, 173–177. [DOI] [PubMed] [Google Scholar]
- Akselband Y, Cabral C, Shapiro DS, McGrath P (2005) Rapid mycobacteria drug susceptibility testing using gel microdrop (GMD) growth assay and flow cytometry. J. Microbiol. Methods 62, 181–197. [DOI] [PubMed] [Google Scholar]
- Allman R, Hann AC, Manchee R, Lloyd D (1992) Characterization of bacteria by multiparameter flow cytometry. J. Appl. Bacteriol. 39, 9–20. [DOI] [PubMed] [Google Scholar]
- Allman R, Schjerven T, Boye E (1991) Cell cycle parameters of Escherichia coli K‐12. J. Bacteriol. 173, 7970–7974. [DOI] [PMC free article] [PubMed] [Google Scholar]
- Amick JD, Brun YV (2001) Anatomy of a bacterial cell cycle. Genome Biol. 2, 10201–1020.4. [DOI] [PMC free article] [PubMed] [Google Scholar]
- Angert E (2005) Alternatives to binary fission in bacteria. Nat. Rev. Microbiol. 3, 214–224. [DOI] [PubMed] [Google Scholar]
- Asmuth DM, Wang N, Lu Y, Li XD, Reece L, Terry NHA, Pollard RB, Nokta M, Leary JF, White RA (2005) Cell cycle kinetic dysregulation in HIV‐infected normal lymphocytes. Cytometry A 66, 41–51. [DOI] [PubMed] [Google Scholar]
- Atlung T, Løbner‐Olesen A, Hansen FG (1987) Overproduction of DnaA protein stimulates initiation of chromosome and minichromosome replication in E. Coli. Mol. Gen. Genet. 206, 51–59. [DOI] [PubMed] [Google Scholar]
- Babel W, Müller RH (1985) Correlation between cell composition and carbon conversion efficiency in microbial growth: a theoretical study. Appl. Microbiol. Biotechnol. 22, 201–207. [Google Scholar]
- Bailey JE, Fazel‐Madjlessi J, McQuitty DN, Lee LY, Allred JC, Oro JA (1977) Characterization of bacterial growth by means of flow microfluorometry. Science 198, 1175–1176. [DOI] [PubMed] [Google Scholar]
- Bartra S, Cherepanov P, Forsberg Å, Schesser K (2001) The Yersinia YopE and YopH type III effector proteins enhance bacterial proliferation following contact with eukaryotic cells. BMC Microbiol. 1, 22. [DOI] [PMC free article] [PubMed] [Google Scholar]
- Bastos H, Lassalle B, Chicheportiche A, Riou L, Testart J, Allemand I, Fouchet P (2005) Flow cytometric characterization of viable meiotic and postmeiotic cells by Hoechst 33342 in mouse spermatogenesis. Cytometry A 65, 40–49. [DOI] [PubMed] [Google Scholar]
- Bates D, Kleckner N (2005) Chromosome and replisome dynamics in E. coli: loss of sister cohesion triggers global chromosome movement and mediates chromosome segregation. Cell 121, 899–911. [DOI] [PMC free article] [PubMed] [Google Scholar]
- Bernander R (2000) Chromosome replication, nucleoid segregation and cell division in Archaea. Trends Microbiol. 8, 278–283. [DOI] [PubMed] [Google Scholar]
- Bley T (1987) State‐structure models of microbial growth. Acta Biotechnol. 7, 173–177. [Google Scholar]
- Borges‐Walmsley M, McKeegan KS, Walmsley AR (2003) Review Article. Structure and function of efflux pumps that confer resistance to drugs. Biochem. J. 376, 313–338. [DOI] [PMC free article] [PubMed] [Google Scholar]
- Brazhnik P, Tyson JJ (2006) Cell cycle control in bacteria and yeast. A case of convergent evolution? Cell Cycle 5, 522–529. [DOI] [PubMed] [Google Scholar]
- Button DK, Robertson BR (2001) Determination of DNA content of aquatic bacteria by flow cytometry. Appl. Environ. Microbiol. 67, 1636–1645. [DOI] [PMC free article] [PubMed] [Google Scholar]
- Christensen BB, Atlung T, Hansen FG (1999) DnaA boxes are important elements in setting the initiation mass of Escherichia coli . J. Bacteriol. 181, 2683–2688. [DOI] [PMC free article] [PubMed] [Google Scholar]
- Coenye T, Vandamme P (2005) Simple sequence repeats and compositional bias in the bipartite Ralstonia solanacearum GMI1000 genome. BMC Genomics 4, 10. [DOI] [PMC free article] [PubMed] [Google Scholar]
- Cooper S (1969) Cell division and DNA replication following a shift to a richer medium. J. Mol. Biol. 43, 1–11. [DOI] [PubMed] [Google Scholar]
- Cooper S (1979) A unifying model for the G1 period in prokayotes and eukaryotes. Nature 280, 17–19. [DOI] [PubMed] [Google Scholar]
- Cooper S (1990) The Escherichia coli cell cycle. Res. Microbiol. 141, 17–29. [DOI] [PubMed] [Google Scholar]
- Cooper S (1991) Bacterial Growth and Division: Biochemistry and Regulation of Prokaryotic and Eukaryotic Division Cycles. San Diego, CA: Academic Press Inc. [Google Scholar]
- Cooper S (2004) Control and maintenance of mammalian cell size. BMC Cell Biol. 5, 35. [DOI] [PMC free article] [PubMed] [Google Scholar]
- Cooper S (2006) Regulation of DNA synthesis in bacteria: analysis of the Bates/Kleckner licensing/initiation‐mass model for cell‐cycle control. Mol. Microbiol. 62, 303–307. [DOI] [PubMed] [Google Scholar]
- Cooper S, Helmstetter CE (1968) Chromosome replication and the division cycle of Escherichia coli B/r. J. Mol. Biol. 31, 519–540. [DOI] [PubMed] [Google Scholar]
- Donachie WD (1968) Relationship between cell size and time of initiation of DNA replication. Nature 219, 1077–1079. [DOI] [PubMed] [Google Scholar]
- Egan ES, Fogel MA, Waldor MK (2005) Divided genomes: negotiating the cell cycle in prokaryotes with multiple chromosomes. Mol. Microbiol. 56, 1129–1138. [DOI] [PubMed] [Google Scholar]
- Fritsch M, Starruß J, Lösche A, Müller S, Bley T (2005) Cell cycle synchronization of Cupriavidus necator by continuous phasing measured via flow cytometry. Biotechnol. Bioeng. 92, 635–642. [DOI] [PubMed] [Google Scholar]
- Fuchs BM, Woebken D, Zubkov MV, Burkhill P, Amann R (2005) Molecular identification of picoplancton populations in contrasting waters of the Arabian Sea. Aquat. Microb. Ecol. 39, 145–157. [Google Scholar]
- Garner AL, Lau YY, Jordan DW, Uhler MD, Gilgenbach RM (2006) Implications of a simple mathematical model to cancer cell population dynamics. Cell Prolif. 39, 15–28. [DOI] [PMC free article] [PubMed] [Google Scholar]
- Gill SR, Pop M, Deboy RT, Eckburg PB, Turnbaugh PJ, Samuel BS, Gordon JI, Relman DA, Fraser‐Liggett CM, Nelson KE (2006) Metagenomic analysis of the human distal gut microbiome. Science 312, 1355–1359. [DOI] [PMC free article] [PubMed] [Google Scholar]
- Gitai Z, Dye NA, Reisenauer A, Wachi M, Shapiro L (2005a) MreB actin‐mediated segregation of a specific region of a bacterial chromosome. Cell 120, 329–341. [DOI] [PubMed] [Google Scholar]
- Gitai Z, Thanbichler M, Shapiro L (2005b) The choreographed dynamics of bacterial chromosomes. Trends Microbiol. 13, 221–228. [DOI] [PubMed] [Google Scholar]
- Goodfellow M, Alderson G, Chun J (1998) Rhodococcal sytematics: problems and developments. Antonie Van Leeuwenhoek 74, 3–20. [DOI] [PubMed] [Google Scholar]
- Grunenfelder B, Rummel G, Vohradsky J, Roder D, Langen H, Jenal U (2001) Proteomic analysis of the bacterial cell cycle. Proc. Natl Acad. Sci. USA 98, 4681–4686. [DOI] [PMC free article] [PubMed] [Google Scholar]
- Guindulain T, Comas J, Vives‐Rego J (1997) Use of nucleic acid dyes SYTO‐13, TOTO‐1, and YOYO‐1 in the study of Escherichia coli and marine prokaryotic populations by flow cytometry. Appl. Environ. Microbiol. 63, 4608–4611. [DOI] [PMC free article] [PubMed] [Google Scholar]
- Helmstetter CE (1967) Rate of DNA synthesis during the division cycle of Escherichia coli B/r. J. Mol. Biol. 24, 417–427. [Google Scholar]
- Helmstetter CE (1968) Origin and sequence of chromosome replication in Escherichia coli B/r. J. Bacteriol. 95, 1634–1641. [DOI] [PMC free article] [PubMed] [Google Scholar]
- Helmstetter CE (1969) Sequence of bacterial reproduction. Annu. Rev. Microbiol. 23, 223–238. [DOI] [PubMed] [Google Scholar]
- Helmstetter CE, Cooper S (1968) DNA synthesis during the cell division cycle of rapidly growing Escherichia coli B/r. J. Mol. Biol. 31, 507–518. [DOI] [PubMed] [Google Scholar]
- Hemstetter CE, Thornton M, Romero A, Eward KL (2003) Synchrony in human, mouse and bacterial cell cultures. A comparison. Cell Cycle 2, 42–45. [DOI] [PubMed] [Google Scholar]
- Herrmann C, Babel WTh, Lösche A, Müller S, Bley S (1997) Flow cytometric discrimination between Acinetobacter calcoaceticus 69‐V and Alcaligenes eutrophus JMP 134 by fluorescently labelled r RNA‐targeted oligonucleotide probes and DNA staining. Acta Biotech. 17, 19–38. [Google Scholar]
- Hessenberger A, Leppard GG, Herndl GJ (1996) Relationship between intracellular integrity and the morphology of the capsular envelope in attached and free‐living marine bacteria. Appl. Environ. Microbiol. 62, 4521–4528. [DOI] [PMC free article] [PubMed] [Google Scholar]
- Holtzendorff J, Hung D, Brende P, Reisenauer A, Viollier PH, McAdams HH, Shapiro L (2004) Science 304, 983–987. [DOI] [PubMed] [Google Scholar]
- Hsieh PC, Siegel SA, Rogers B, Davis D, Lewis K (1998) Bacteria lacking a multidrug pump: a sensitive tool for drug discovery. Proc. Natl Acad. Sci. USA 95, 6602–6606. [DOI] [PMC free article] [PubMed] [Google Scholar]
- Hutter KJ, Eipel HE (1979) Simultaneous measurement of DNA and protein content of microorganisms by flow cytometry. Eur. J. Appl. Microbiol. 6, 223–231. [Google Scholar]
- Jenal U, Fuchs T (1998) An essential protease involved in bacterial cell cycle control. EMBO J. 17, 5658–5668. [DOI] [PMC free article] [PubMed] [Google Scholar]
- Jensen RB (2006) Coordination between chromosome replication, segregation, and cell division in Caulobacter crescentus. J. Bacteriol. 188, 2244–2253. [DOI] [PMC free article] [PubMed] [Google Scholar]
- Kaguni JM (2006) DnaA: Controlling the initiation of bacterial DNA replication and more. Annu. Rev. Microbiol. 60, 351–371. [DOI] [PubMed] [Google Scholar]
- Kelemen GH, Viollier PH, Tenor JL, Marri L, Buttner MJ, Thompson CJ (2001) A connection between stress and development in the multicellular prokaryote Streptomyces coelicolor A2(2). Mol. Microbiol. 40, 804–814. [DOI] [PubMed] [Google Scholar]
- Kleinsteuber S, Riis V, Fetzer I, Harms H, Müller S (2006) Population dynamics of a microbial consortium during growth on diesel fuel in saline environments. Appl. Environ. Microbiol. 72, 3531–3542. [DOI] [PMC free article] [PubMed] [Google Scholar]
- Krishan A (1987) Effect of drug efflux blockers on vital staining of cellular DNA with Hoechst 33342. Cytometry 8, 642–645. [DOI] [PubMed] [Google Scholar]
- Krishan A, Dandekar P, Nathan N, Hamelik R, Miller C, Shaw J (2005) DNA index, genome size, and electronic nuclear volume of vertebrats from the Miami Metro Zoo. Cytometry A 65, 26–34. [DOI] [PubMed] [Google Scholar]
- Laub MT, McAdams HH, Feldblyum T, Fraser CM, Shapiro L (2000) Global analysis of genetic network controlling a bacterial cell cycle. Science 290, 2144–2148. [DOI] [PubMed] [Google Scholar]
- Lee N, Nielsen PH, Andreasen KH, Juretschko S, Nielsen JL, Schleifer KH, Wagner M (1999) Combination of fluorescent in situ hybridization and microautoradiography – a new tool for structure‐function analyses in microbial ecology. Appl. Environ. Microbiol. 65, 1289–1297. [DOI] [PMC free article] [PubMed] [Google Scholar]
- Li Y, Sergeev K, Austin S (2002) The segregation of the Escherichia coli origin and terminus of replication. Mol. Microbiol. 46, 985–996. [DOI] [PubMed] [Google Scholar]
- Louarn JM, Kuempel P, Cornet F (2005) The terminus region of the Escherichia coli chromosome, or, all's well that ends well In: Higgins NP, ed. The Bacterial Chromosome, p. 251–273. Washington, DC: ASM Press. [Google Scholar]
- Maisnier‐Patin S, Malandrin L, Birkeland NK, Bernander R (2002) Chromosome replication patterns in the hyperthermophilic euryarchaea Archaeoglobus fulgidus and Methanocaldococcus (Methanococcus) jannaschii . Mol. Microbiol. 45, 1443–1450. [DOI] [PubMed] [Google Scholar]
- Majernik AI, Lundgren M, McDermott P, Bernander R, Chong JPJ (2005) DNA content and nucleoid distribution in Methanothermobacter thermoautotrophicus . J. Bacteriol. 187, 1856–1856. [DOI] [PMC free article] [PubMed] [Google Scholar]
- Marczynski GT, Shapiro L (1995) The control of asymmetric gene expression during Caulobacter cell differentiation. Arch. Microbiol. 163, 313–321. [DOI] [PubMed] [Google Scholar]
- Maskow T, Müller S, Lösche A, Kemp R (2006) Appropriateness of different heat measurement principles and flow cytometry used to control the continuous synthesis of polyhydroxyalcanoates. Biotechnol. Bioeng. 93, 541–552. [DOI] [PubMed] [Google Scholar]
- McAdams HH, Shapiro L (2003) A bacterial cell‐cycle regulatory network operating in time and space. Science 301, 1874–1877. [DOI] [PubMed] [Google Scholar]
- Mergaert P, Uchiumi T, Alunni B, Evanno G, Cheron A, Catrice O, Mausset AE, Barloy‐Hubler F, Galibert F, Kondorosi A, Kondorosi E (2006) Eukaryotic control on bacterial cell cycle and differentiation in the Rhizobium‐legume symbiosis. Proc. Natl Acad. Sci. USA 103, 5230–5235. [DOI] [PMC free article] [PubMed] [Google Scholar]
- Messer W (2002) The bacterial replication initiator DnaA. DnaA and oriC, the bacterial mode to initiate DNA Replication. FEMS Microbiol. Rev. 26, 355–374. [DOI] [PubMed] [Google Scholar]
- Michelsen O, Teixera de Mattos MJ, Jensen PR, Hansen GH (2003) Precise determination of C and D periods by flow cytometry in Escherichia coli K‐12 and B/r. Microbiology 149, 1001–1010. [DOI] [PubMed] [Google Scholar]
- Müller S, Babel W (2003) Analysis of bacterial DNA pattern – an approach for controlling biotechnological processes. J. Microbiol. Methods 55, 851–858. [DOI] [PubMed] [Google Scholar]
- Müller S, Bley T, Babel W (1999) Adaptive responses of Ralstonia eutropha to master feast and famine conditions analysed by flow cytometry. J. Biotechnol. 75, 81–97. [DOI] [PubMed] [Google Scholar]
- Müller S, Kiesel B, Berthe‐Corti L (2001) Muricauda ruestringensis has an asymmetric cell cycle. Acta Biotechnol. 21, 343–357. [Google Scholar]
- Müller S, Sträuber H, Lösche A, Babel W (2002) Population analysis of a binary culture by multi‐parametric flow cytometry. J. Biotechnol. 97, 163–176. [DOI] [PubMed] [Google Scholar]
- Müller S, Ullrich S, Lösche A, Loffhagen N, Babel W (2000) Flow cytometric techniques to characterise physiological states of Acinetobacter calcoaceticus . J. Microbiol. Methods 40, 67–77. [DOI] [PubMed] [Google Scholar]
- Neiddhardt FC (1999) Bacterial growth: constant obsession with dN/dt. J. Bacteriol. 181, 7405–7408. [DOI] [PMC free article] [PubMed] [Google Scholar]
- Nierman WC, Feldblyum TV, Laub MT, Paulsen IT, Nelson KE, Eisen J, Heidelberg JF, Alley MR, Ohta N, Maddock JR, Potocka I, Nelson WC, Newton A, Stephens C, Phadke ND, Ely B, Deboy RT, Dodson RJ, Durkin AS, Gwinn ML, Haft DH, Kolonay JF, Smit J, Craven MB, Khouri H, Shetty J, Berry K, Utterback T, Tran K, Wolf A, Vamathevan J, Ermolaeva M, White O, Salzberg SL, Venter JC, Shapiro L, Fraser CM (2001) Complete genome sequence of Caulobacter crescentus . Proc. Natl Acad. Sci. USA 98, 4136–4141. [DOI] [PMC free article] [PubMed] [Google Scholar]
- Niki H, Yamachai Y, Hiraga S (2000) Dynamic organization of chromosomal DNA in Escherichia coli . Genes Dev. 14, 212–223. [PMC free article] [PubMed] [Google Scholar]
- Olive PL, Durand RE (2005) Heterogeneity in DNA damage using the comet assay. Cytometry A 66, 1–8. [DOI] [PubMed] [Google Scholar]
- Pace NR (1997) A molecular view of microbial diversity and the biosphere. Science 276, 734–740. [DOI] [PubMed] [Google Scholar]
- Pease PJ, Levy O, Cost GJ, Gore J, Ptacin JL, Sherratt D, Bustamante C, Cozzarelli NR (2005) Sequence directed DNA translocation by purified FtsK. Science 307, 586–590. [DOI] [PubMed] [Google Scholar]
- Pelz O, Tesar M, Wittich RM, Moore ERB, Timmis KN, Abraham WR (1999) Towards elucidation of microbial metabolic pathways: unravelling the network of carbon sharing in a pollutant‐degrading consortium by immunocapture and isotopic ratio mass spectrometry. Environ. Microbiol. 1, 167–174. [DOI] [PubMed] [Google Scholar]
- Pertoft H (2000) Fractionating of cells and subcellular particles with Percoll. J. Biochem. Biophys. Methods 44, 1–30. [DOI] [PubMed] [Google Scholar]
- Poindexter JS (1981) Caulobacters: ubiquitous unusual bacteria. Microbiol. Rev. 45, 123–179. [DOI] [PMC free article] [PubMed] [Google Scholar]
- Potter AJ, Wener MH (2005) Flow cytometric analysis of fluorescence in situ hybridization with dye dilution and DNA staining (flow‐FISH‐DDD) to determine telomere length dynamics in proliferating cells. Cytometry A 68, 53–58. [DOI] [PubMed] [Google Scholar]
- Roos M, Van Geel AB, Aarsman ME, Veuskens JT, Woldringh CL, Nanninga N (2001) The replicated ftsQAZ and minB chromosomal regions of Escherichia coli segregate on average in line with nucleoid movement. Mol. Microbiol. 39, 633–640. [DOI] [PubMed] [Google Scholar]
- Rueda S, Vicente M, Mingorance J (2003) Concentration and assembly of the division ring proteins FtsZ, FtsA, and ZipA during the Escherichia coli cell cycle. J. Bacteriol. 185, 3344–3351. [DOI] [PMC free article] [PubMed] [Google Scholar]
- Rutten TPA, Sandee B, Hofman ART (2005) Phytoplankton monitoring by high performance flow cytometry: a successful approach? Cytometry A 64, 16–26. [DOI] [PubMed] [Google Scholar]
- Ryan KR, Huntwork S, Shapiro L (2004) Recruitment of a cytoplasmatic response regulator to the cell pole is linked to its cell‐cycle proteolysis. Proc. Natl Acad. Sci. USA 101, 7415–7420. [DOI] [PMC free article] [PubMed] [Google Scholar]
- Saier MH (2000) A functional‐phylogenetic classification system for transmembrane solute transporters. Microbiol. Mol. Biol. Rev. 64, 354–411. [DOI] [PMC free article] [PubMed] [Google Scholar]
- Sakr S, Thyssen M, Denis M, Zhang CC (2006) Relationship among several key cell cycle events in the developmental cyanobacterium Anabaena sp. strain PCC 7120. J. Bacteriol. 188, 5958–5965. [DOI] [PMC free article] [PubMed] [Google Scholar]
- Schaechter M, Maaiøe O, Kjeldgaard NO (1958) Dependency on medium and temperature of cell size and chemical composition during balanced growth of Salmonella typhimurium . J. Gen. Microbiol. 19, 592–606. [DOI] [PubMed] [Google Scholar]
- Schwock J, Geddie WR, Hedley DW (2005) Analysis of hypoxia‐inducible factor‐1α accumulation and cell cycle in geldanamycin‐treated human cervical carcinoma cells by laser scanning cytometry. Cytometry A 68, 59–70. [DOI] [PubMed] [Google Scholar]
- Shapiro HM (2003) Practical Flow Cytometry, 4th edn. New York: Wiley‐Liss. [Google Scholar]
- Shapiro HM, Perlmutter NG (2006) Personal cytometers: slow flow or no flow? Cytometry A 69, 620–630. [DOI] [PubMed] [Google Scholar]
- Shi L, Günther S, Hübschmann T, Wick LY, Harms H, Müller S (2007) Limits of propidium iodide (PI) as a cell viability indicator for environmental bacteria. Cytometry A 71A, 592–598. [DOI] [PubMed] [Google Scholar]
- Skarstad K, Boye E, Steen HB (1986) Timing of initiation of chromosome replication in individual Escherichia coli cells. EMBO J. 5, 1711–1717. [DOI] [PMC free article] [PubMed] [Google Scholar]
- Sogin ML, Morrison HG, Huber JA, Welch DM, Huse SM, Neal PR, Arrieta JM, Herndel GJ (2006) Microbial diversity in the deep sea and the underexplored ‘rare bioshere’. Proc. Natl Acad. Sci. USA 103, 12115–121120. [DOI] [PMC free article] [PubMed] [Google Scholar]
- Steen HB (2000) Flow cytometry of bacteria: glimpses from the past with a view to the future. J. Microbiol. Methods 42, 65–74. [DOI] [PubMed] [Google Scholar]
- Steen HB, Boye E (1980) Bacterial growth studied by flow cytometry. Cytometry 1, 32–36. [DOI] [PubMed] [Google Scholar]
- Suda J, Trávnièek P (2006) Reliable DNA ploidy determination in dehydrated tissues of vascular plants by DAPI flow cytometry – new prospects for plant research. Cytometry A 69, 273–280. [DOI] [PubMed] [Google Scholar]
- Sunako Y, Onogi T, Hiraga S (2001) Sister chromosome cohesion of Escherichia coli . Mol. Microbiol. 42, 1233–1241. [DOI] [PubMed] [Google Scholar]
- Thanbichler M, Voillier PH, Shapiro L (2005) The structure and function of the bacterial chromosome. Curr. Opin. Genet. Dev. 15, 153–162. [DOI] [PubMed] [Google Scholar]
- Thyssen M, Lefévre D, Caniaux G, Ras J, Fernández CI, Denis M (2005) Spatial distribution of heterotrophic bacteria in the northeast Atlantic (POMME study area) during spring 2001. J. Geophys. Res. 110, C07S16. [Google Scholar]
- Vaulot D, Marie D, Olsen RJ, Chrisholm SW (1995) Growth of Prochlorococcus, a photosynthetic prokaryote, in the equatorial pacific ocean. Science 268, 1480–1482. [DOI] [PubMed] [Google Scholar]
- Veldhuis MJW, Cucci TL, Sieracki ME (1997) Cellular DNA content of marine phytoplankton using two new fluorochromes: taxonomic and ecological implications. J. Phycol. 33, 527–531. [Google Scholar]
- Viollier PH, Thanbichler M, McGrath PT, West L, Meewan M, McAdams HH, Shapiro L (2004) Rapid and sequential movement of individual chromosomal loci to specific subcellular locations during bacterial DNA replication. Proc. Natl Acad. Sci. USA 101, 9257–9262. [DOI] [PMC free article] [PubMed] [Google Scholar]
- Vogt C, Lösche A, Kleinsteuber S, Müller S (2005) Population profiles of a stable, commensalistic bacterial culture grown with toluene under sulphate‐reducing conditions. Cytometry A 66, 91–102. [DOI] [PubMed] [Google Scholar]
- Walberg M, Gaustad P, Steen HB (1999) Uptake kinetics of nucleic acids targeting dyes in S. aureus, E. faecalis and B. cereus: a flow cytometric study. J. Microbiol. Methods 35, 167–176. [DOI] [PubMed] [Google Scholar]
- Wang X, Liu X, Possoz C, Sherratt DJ (2006) The two Escherichia coli chromosome arms locate to separate cell halves. Genes Dev. 20, 1727–1731. [DOI] [PMC free article] [PubMed] [Google Scholar]
- Wang X, Possoz C, Sherratt DJ (2005) Dancing around the divisome: asymmetric chromosome segregation in Escherichia coli . Genes Dev. 19, 2367–2377. [DOI] [PMC free article] [PubMed] [Google Scholar]
- Wiacek C, Müller S, Benndorf D (2006) A cytomic approach reveals population heterogeneity of Cupriavidus necator in response to harmful phenol concentrations. Proteomics 6, 5983–5994. [DOI] [PubMed] [Google Scholar]
- Wortinger M, Sacket M, Brun Y (2000) CtrA mediates a DNA replication checkpoint that prevents cell division in Caulobacter crescentus . EMBO J. 19, 4503–4512. [DOI] [PMC free article] [PubMed] [Google Scholar]
- Wu LJ, Errington J (2004) Coordination of cell division and chromosome segregation by a nucleoid occlusion protein in Bacillus subtilis . Cell 117, 915–925. [DOI] [PubMed] [Google Scholar]
- Zubkov M, Burkill PH (2006) Syringe pumped high speed flow cytometry of oceanic phytoplankton. Cytometry A 69, 1010–1019. [DOI] [PubMed] [Google Scholar]
- Zucker R (2006) Whole insect and mammalian embryo imaging with confocal microscopy: morphology and apoptosis. Cytometry A 69, 1143–1152. [DOI] [PubMed] [Google Scholar]