

Abstract
Abstract. Objectives: This article addresses the interaction of transforming growth factor β1 (TGF‐β1) and bone morphogenic protein 2 (BMP‐2) during osteo‐chondrogenic differentiation of adipose‐derived adult stem cells (ASC). TGF‐β1 was expected to modulate the BMP‐2‐induced effects through transcriptional regulation of Dlx‐5, Msx‐2 and Runx‐2. Materials and Methods: Encapsulated ASC were cultured for 14 days in medium containing TGF‐β1 and/or BMP‐2. mRNA expression of the extracellular matrix molecules col2a1, cartilage oligomeric matrix protein, col10a1, alkaline phosphatase (AP) and transcription factors Msx‐2, Dlx‐5 and Runx‐2 was analysed. Release of glycosaminoglycans, collagen types II and X into the extracellular matrix was demonstrated. Results: BMP‐2 and TGF‐β1 induced a chondrogenic phenotype in ASC. Combined growth factor treatment had a synergistic effect on col10a1 and an additive effect on col2a1 mRNA expression. Synthesis of glycosaminoglycans was enhanced by combined growth factor treatment. Addition of TGF‐β1 inhibited BMP‐2 induced AP expression and activity and both proteins promoted chondrogenic maturation. Conclusions: Prevention of BMP‐2‐induced osteogenic transdifferentiation by TGF‐β1 seemed not to be mediated by transcriptional regulation of Dlx‐5. Due to these findings, simultaneous stimulation of ASC with BMP‐2 and TGF‐β1 seemed to be beneficial for complete differentiation of ASC into chondrocytes.
INTRODUCTION
Articular cartilage has a limited capacity for self‐repair after joint damage. Several clinical studies have been performed, such as abrasion arthroplasty (Johnson 1986), microfracture chondroplasty (Steadman et al. 2001), osteochondral grafting (Hangody et al. 2001) and the transplantation of autologous chondrocytes into the defects (Brittberg et al. 1994), to evaluate techniques of cartilage repair. Because adult stem cells from bone marrow and fat are able to differentiate into chondrocytes (Pittenger et al. 1999; Zuk et al. 2001; Erickson et al. 2002), they have been considered as an alternative cell source for cartilage transplantation. Several advantages, such as in vitro expansion properties, easy accessibility (Gimble & Guilak 2003) and immuneprivileged properties have been demonstrated in adipose‐derived adult stem cells (ASC) (Puissant et al. 2005; McIntosh et al. 2006). Transforming growth factor β1 (TGF‐β1) induces a stable chondrogenic phenotype in ASC that has been maintained following subcutaneous implantation in mice (Erickson et al. 2002). Compared to mesenchymal stem cells (MSC) from bone marrow, TGF‐β1‐induced chondrogenic maturation is delayed in ASC (Mehlhorn et al. 2006). Therefore, other growth factor of the TGF‐β superfamily, such as bone morphogenic proteins (BMPs), has been deemed to be necessary for successful chondrogenic differentiation in ASC.
Bone morphogenic protein treatment favours osteogenic or chondrogenic differentiation of MSC, depending on the BMP isoform, concentration of the BMP used and the origin of the stem cells. BMP‐2 induces an isolated osteogenic phenotype in embryonic stem cells, periosteum‐derived progenitor cells and the myogenic cell line C2C12 (Iwasaki et al. 1994; Lee et al. 2003; Kawaguchi et al. 2005). In contrast, osteo‐ and chondro‐inductive potential of BMP‐2 was observed in stimulated bone marrow‐derived MSC (Sekiya et al. 2005) and in the stem cell‐like fibroblastic cell line C3H10T1/2 (Shea et al. 2003). An isolated chondrogenic phenotype was induced with 50 ng/mL of recombinant BMP‐2 (Schmitt et al. 2003) and additional treatment with TGF‐β1 enhances cartilage‐like extracellular matrix synthesis in bone marrow‐derived MSC (Indrawattana et al. 2004). In the presence of BMP‐2 or BMP‐6, ASC differentiated into a chondrogenic lineage (Estes et al. 2006; Wei et al. 2006). In contrast, transfection of ASC, with a vector coding for BMP‐2, induced osteogenic differentiation with permanent concentrations of BMP‐2 around 5–10 ng/mL in a medium containing other osteo‐inductive factors (Dragoo et al. 2003). However, interaction of TGF‐β1 and BMP‐2 during chondrogenic and osteogenic differentiation of ASC has not yet been elucidated. In the C2C12 myogenic cell line, BMP‐2 has been shown to activate the osteogenic transcription factors distal‐less homeobox gene 5 (Dlx‐5) and Runx‐2, to mediate osteogenic differentiation. TGF‐β1 was shown to prevent BMP‐2‐mediated osteogenesis by down‐regulation of Dlx‐5 (Lee et al. 2003) and by up‐regulation of the Dlx‐5‐antagonist Msx‐2 (Kim et al. 2004).
Thus, the objective of this study was to characterize the mesenchymal lineage committed to by ASC after exposure to BMP‐2. The expression and synthesis of osteogenic and chondrogenic marker molecules was analysed during a 2‐week culture period. Second, the effect of additional treatment with TGF‐β1 on BMP‐2‐mediated differentiation and on the expression of the osteogenic transcription factors Dlx‐5, Msx‐2 and Runx‐2 were studied in ASC.
MATERIALS AND METHODS
Isolation of adipose‐derived adult stem cells
Human adipose‐derived adult stem cells were isolated from subcutaneous adipose tissue from healthy young donors (n = 3; 25 ± 3) undergoing abdominoplastic surgery. Fat tissue was minced into small pieces (1–2 mm3), was washed with phosphate‐buffered saline (PBS) and digested with 2 mg of collagenase type I (125 units/mg) per millilitre PBS (Biochrom AG, Berlin, Germany) for 90 min at 37 °C with continuous shaking. The floating adipocytes were separated from the stromal cell fraction using multiple centrifugation and washing steps. Red blood cells were removed by using red blood cell lysis buffer (eBioscience, San Diego, CA, USA). Stromal cells were counted with a haemocytometer being stained with trypan blue. These cells were plated in tissue culture flask at 4000 cells/cm2 filled with Dulbecco's modified Eagle's medium/F12, 10% foetal bovine serum, 1 ng/mL basic fibroblast growth factor, 1% penicillin and 1% streptomycin. Cells were expanded until they reached two times 85% confluence and were then used for the following experiments.
Characterization of the cells
For flow cytometric analysis of in vitro expanded ASC, cells were detached with Trypsin‐EDTA, after twice reaching desired confluence (passage 2). They were washed with PBS and were stained with fluorescent antibodies against human CD34, CD45, CD73 (Becton Dickinson, San Jose, CA, USA), CD90 and CD105 (PharMingen, San Diego, CA, USA) and corresponding isotype controls.
Chondrogenesis in alginate bead culture system
After expansion, ASC were harvested with Trypsin‐EDTA and were then suspended in 1.2% Alginate (Sigma, Taufkirchen, Germany) at a concentration of 4 × 10⁶ cells/mL. Spherical beads were created by dispensing droplets of the alginate cell suspension from the tip of 14G needle, into a bath of 102 mm CaCl2 or BaCl2. Consistent bead volume was controlled measuring bead diameters by light microscopy and Scion Image software (Scion Cooperation 2000, Frederick, MD, USA). Alginate beads from each donor were cultured either in basis medium containing high‐glucose Dulbecco's modified Eagle's medium with sodium pyruvate (100 mg/L), l‐glutamine (100 mg/L) and pyrridoxine hydrochloride (100 mg/L) (Gibco, Rockville, MD, USA), 1% penicillin/streptomycin, l‐ascorbate‐2‐phosphate (37.5 µg/mL), ITS + Premix (6.25 mg/mL each) (Gibco) and 10−7 M dexamethasone or differentiation medium. Differentiation medium contained, in addition to basis medium, 10 ng/mL TGF‐β1 and/or 50 ng/mL BMP‐2 (both R&D Systems, Minneapolis, MN, USA). Before exposure to basic or differentiation medium alginate beads were pre‐incubated for 6 h with serum free expansion medium. The beads were cultured for 3, 6, 9 and 14 days and medium was changed every third day.
DNA content
Beads were digested in digestion buffer (PBS containing 50 mm NaCl, 55 mm sodium citrate, 2 mm l‐cysteine, 2 mm EDTA, pH 6.5) (Sigma) and aliquots were collected for gylcosamanoglycan and DNA quantification. For measurement of DNA, aliquots of digested beads were diluted 1 : 5 in Tris‐EDTA buffer (10 mm Tris‐HCl, 2 mm EDTA, pH 7.5) and were analysed using the fluorescent PicoGreen dsDNA quantification assay (Molecular Probes, Eugene, OR, USA). Fluorescence was measured with Tecan SpectraFluorPlus microtiter plate reader (Tecan, Crailsheim, Germany) at 485 nm excitation and 535 nm emission wavelengths. DNA content was computed relative to a standard curve generated with λ DNA (0–1000 ng/mL).
Quantification of glycosaminoglycans
Alginate beads were dissolved in digestion buffer and aliquots of solubilized beads were diluted 1: 2.5 before being enzymatically digested with chondroitinase ABC (5 units/mL) or hyaluronidase (0.5 units/mL; Seikagaku Cooperation, Tokyo, Japan) for 2 h at 37 °C; then they were ultrafiltered using an Ultrafree C3GC system (Millipore, Tokyo, Japan). High‐performance liquid chromatography analysis of the unsaturated disaccharides ▵di‐6‐S, ▵di‐4S and ▵di‐0S derived form hyaluronic acid and chondroitinsulfate was performed as previously described (Shinmei et al. 1992). The amount of glycosaminoglycans (GAGs) was normalized to corresponding DNA content.
Quantitative reverse transcription‐polymerase chain reaction
mRNA samples were taken at day 3, 6, 9 and 14, were transcribed into cDNA and reverse transcription‐polymerase chain reaction (RT‐PCR) analysis for gene expression of cartilage oligomeric matrix protein (COMP), collagen type X (col10a1), α1‐collagen type II (col2a1) and alkaline phosphatase (AP) was carried out as described (Stahl et al. 2004). Total mRNA was prepared using TRIzol reagent according to the manufacturer's instructions (InvitrogenTM Life Technologies, Cartsbad, CA, USA). Total RNA 1 µg was treated with 1 U of deoxyribonuclease I (DNase I; InvitrogenTM Life Technologies) to digest genomic DNA contamination. Random‐primed cDNA synthesis was performed using 1 µg of DNase I‐treated total RNA and 50 U of StrataScript reverse transcriptase according to the manufacturers’ instructions (Stratagene, La Jolla, CA, USA). TaqMan PCR assays were performed in 96‐well optical plates on an ABI Prism 7700 Sequence Detection System (Applied Biosystems, Forster City, CA, USA) using ABsolute QPCR ROX Mix (Abgene, Hamburg, Germany) according to the manufacturer's instructions. Oligonucleotide primers and TaqMan probes were designed using Primer Express (Applied Biosystems) according to company guidelines: glyceraldehyde‐3‐phosphate dehydrogenase: forward primer 5′‐TGGGCTACACTGAGCACCAG‐3′, reverse primer 5′‐CAGCGTCAAAGGTGGAG GAG‐3′, probe 5′‐FAM‐TCTCCTCTGACTTCAACAGCGACACCC‐TAMRA‐3′; col2a1: forward primer 5′‐GAGACAGCATGACGCCGAG‐3′, reverse primer 5′‐GCGGATGCTCTCAATCTGGT‐3′, probe 5′‐FAM‐TGGATGCCACACTCAAGTCCCTCAAC‐TAMRA‐3′; COMP: forward primer 5′‐CAATGAACAGCGACCCAGG‐3′, reverse primer 5′‐TCACATGGAACGTGCCCTC‐3′, probe 5′‐FAM‐TTACACTGCCTTCAATGGCGTGGACTT‐TAMRA‐3′; col10a1: forward primer 5′‐TCCTTGAACTTGGTTCATGGAGT‐3′, reverse primer 5′‐ACTGTGTCTTGGTGTTGGGTAGTG‐3′, probe 5′‐FAM‐CGCTGAACGATACCAAATGCCCACA‐TAMRA‐3′; AP: forward primer 5′‐ATGCCCTGGAGCTTCAGAAG‐3′, reverse primer 5′‐TGGTGGAGCTGACCCTTGAG‐3′, probe 5′‐FAM‐CGTGGCTAAGAATGTCATCATGTTCCTGG‐TAMRA‐3′; Dlx‐5: forward primer 5′‐AGTACGGCGGCGCCTAC‐3′, reverse primer 5′‐TCACTTCTTTCTCTGGCTGGTTG‐3′, probe 5′‐FAM‐ACCGCGTCCCAAGCGCCA‐TAMRA‐3′; Msx‐2: forward primer 5′‐GAGCATCCTACCCGTTCCATAG‐3′, reverse primer 5′‐ACTGGCGTGGCATAGAGTCC‐3′, probe 5′‐FAM‐CCTGTGCTTCCCATCCCGCCT‐TAMRA‐3′; Runx‐2: forward primer 5′‐TGTGGAGTTTGGTGTCTACTAGTGTGT‐3′, reverse primer 5′‐GAAATCTGCCATGTGACTGCC‐3′, probe 5′‐FAM‐ATTTGAGCTAGAGTCCTTCTGTGGCATGCA‐TAMRA‐3′.
Thermal cycling conditions were 95 °C for 15 min followed by 40 cycles at 95 °C for 15 s and at 60 °C for 1 min. Data were analysed using the relative standard curve method, each sample being normalized to glyceraldehyde‐3‐phosphate dehydrogenase to correct for differences in mRNA quality and quantity. Data are expressed as arbitrary units. As a negative control for chondrogenic marker genes, mRNA samples of human fibroblasts were used.
Alkaline phosphatase detection
Detection of AP activity in cellular extracts was performed as previously described (Blum et al. 2001). Aliquots of a single digested bead (250 µL) were mixed with 250 µL assay buffer containing 25 mm Tris‐HCl (pH 8.5) and 0.5% Triton X‐100. 20 µL of each sample was mixed with 100 µL CSPD substrate (Applied Biosystems) and was incubated at 37 °C for 30 min. Light output was measured by a plate luminometer (SpectraFluorPlus; Tecan) in relative luminescence units. Cellular AP activities were normalized to DNA content analysed with fluorescent PicoGreen dsDNA quantification assay (Molecular Probes).
Histology
For paraffin embedded sections, alginate beads complexed with BaCl2, were fixed in 4% phosphate‐buffered formalin, and were then dehydrated before embedding in liquid paraffin. After setting, sections were cut from the blocks, dry (2.5 µm) using a Leica RM 2165 microtome (Leica Corporation, Nusstoch, Germany). For collagen type II immunohistochemistry, sections were incubated for 30 min with 5% normal goat serum, followed by incubation with 1 : 50 monoclonal mouse anticollagen type II antibody (MAB 8889; Chemicon, Temecula, CA, USA) for 12 h, three washings with PBS were then performed before incubation with fluorescein isothiocyanate‐labelled goat antimouse immunglobulin G for 45 min. Sections were mounted with Vectashield mounting medium containing 4′,6‐diamidino‐2‐phenylindole (DAPI) (VectaShield, Vector Laboratories Inc., Burlingame, CA, USA).
Statistical analysis
Numerical data were analysed by computer software package for statistical analysis (SPSS statistical program, version 11.5, SPSS Inc. Chicago, IL, USA). All values are reported as mean ± SD of the mean. Statistical significance was determined using the Wilcoxon–Mann–Whitney test at a confidence interval level of 95% (P < 0.05).
RESULTS
Flow cytometry
Adipose‐derived adult stem cells were characterized with respect to the expression of surface antigens. Expression of all studied was similar for the entire expansion period and for all samples used in the experiment: on average 72 ± 5% of ASC expressed CD90 (Thy‐1), 65 ± 12% expressed CD44 (hyaluronate receptor), 42 ± 11% expressed CD105 (endoglin) and 83 ± 23% expressed CD73 (ecto‐5‐nucleoditase); the cells did not express CD34 (sialomucin/haematopoietic progenitors) or CD45 (leucocyte common antigen/haematopoietic progenitors) surface antigens.
Quantification of GAGs
To measure the effect of TGF‐β1 and BMP‐2 on hyaluronic acid, chondroitin‐4‐sulfate and chondroitin‐6‐sulfate synthesis in ASC, alginate beads were cultured for 3, 6, 9 and 14 days in the presence of TGF‐β1 and/or BMP‐2; high‐performance liquid chromatography analysis was performed (Fig. 1). Within the 14‐day culture periodchondrotin‐4‐sulfate production per microgram dsDNA consistently increased in all treatment groups (Fig. 1a). At days 12 and 14, the detected amount (GAG/µg dsDNA) was significantly (P < 0.05) higher in samples treated with TGF‐β1 and BMP‐2 compared to all other groups. Chondrotin‐6‐sulfate production per microgram dsDNA continuously increased in all treatment groups (Fig. 1b). At days 3 and 14, the detected amount (GAG/µg dsDNA) was significantly (P < 0.05) higher in samples treated with TGF‐β1 and BMP‐2 compared to all other groups. Hyaluronic acid production per microgram dsDNA increased during the first 3 days then consistently decreased from days 4–14 in all treatment groups (Fig. 1c). During the whole experiment the detected amount (GAG/µg dsDNA) was significantly (P < 0.05) higher in samples treated with TGF‐β1 and BMP‐2 compared to all other groups.
Figure 1.

Hyaluronic acid and chondroitinsulfate content in ASC treated with 50 ng/mL BMP‐2 and/or 10 ng/mL TGF‐β1. HPLC analysis of the unsaturated disaccharides Δdi‐6‐S, Δdi‐4S, and Δdi‐0S derived form hyaluronic acid and chondroitinsulfate was performed. The amount of chondrotin‐4‐sulfate (a), chondrotin‐6‐sulfate (b), hyaluronic acid (c) was normalized to the corresponding DNA content. Asterisks indicate statistically significant differences (*P < 0.05).
Quantitative RT‐PCR
To discover whether ASC would preferrentially differentiate towards chondrogenic or osteogenic lineages in response to TGF‐β1 and BMP‐2, mRNA expression of osteogenic and chondrogenic extracellular matrix molecules α1‐collagen type II (col2a1), cartilage oligomeric matrix protein (COMP), collagen type 10 (col10a1) and alkaline phosphatase (AP) was analysed by quantitative real‐time PCR (2, 3, 4, 5). mRNA expression of the cartilage marker col2a1 was detected in samples treated with BMP‐2, TGF‐β1 and BMP‐2/TGF‐β1 first at day 9. By day 14, mRNA expression was significantly higher in the BMP‐2/TGF‐β1 treatment group compared to all other samples. In controls, col2a1 was not detected (Fig. 2). mRNA expression of the cartilage marker COMP was detected in all groups during the whole experiment. mRNA expression of COMP in all treatment groups was normalized to corresponding samples of the control group. COMP mRNA expression in samples treated with BMP‐2/TGF‐β1 was up‐regulated by two to three times (P < 0.05) by day 9 and by day 14, compared to samples treated with BMP‐2 or TGF‐β1 alone (Fig. 3). mRNA expression of collagen type X (col10a1), which is considered as a marker of cartilage hypertrophy, was detected in all groups during the whole experiment. In all treatment groups, mRNA expression of col10a1 was normalized to corresponding samples of the control group. Col10a1 mRNA expression in samples treated with BMP‐2/TGF‐β1 was 2–3‐fold up‐regulated (P < 0.05) at day 6, 9 and 14 over samples treated with BMP‐2 or TGF‐β1 alone (Fig. 4). mRNA expression of the osteogenic marker alkaline phosphatase (AP) was up‐regulated in samples treated with BMP‐2 or in control samples from day 9 to day 14. AP expression could not be detected in samples treated with TGF‐β1 or with BMP‐2/TGF‐β1 for the whole experiment (Fig. 5).
Figure 2.

Col2a1 mRNA expression in ASC treated with 50 ng/mL BMP‐2 and/or 10 ng/mL TGF‐β1. Gene expression analysis of ASCs was performed for col2a1 using quantitative RT‐PCR. mRNA of control samples cultured in growth factor‐free medium was analysed at day 14. Gene expression levels were reported relative to gene expression of the housekeeping gene GAPDH. Asterisks indicate statistically significant differences (*P < 0.05).
Figure 3.

COMP mRNA expression in ASC treated with 50 ng/mL BMP‐2 and/or 10 ng/mL TGF‐β1. Gene expression analysis of ASCs was performed for COMP using quantitative RT‐PCR. mRNA of control samples cultured in growth factor‐free medium was analysed at day 14. Gene expression levels were reported relative to gene expression of the housekeeping gene GAPDH. Asterisks indicate statistically significant differences (*P < 0.05).
Figure 4.
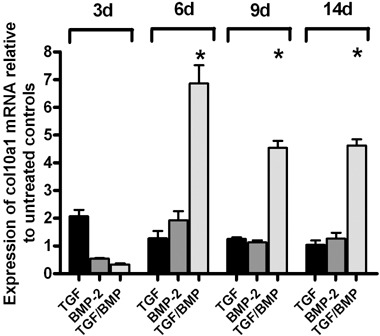
Col10a1 mRNA expression in ASC treated with 50 ng/mL BMP‐2 and/or 10 ng/mL TGF‐β1. Gene expression analysis of ASCs was performed for col10a1 using quantitative RT‐PCR. mRNA of control samples cultured in growth factor‐free medium was analysed at day 14. Gene expression levels were reported relative to gene expression of the housekeeping gene GAPDH. Asterisks indicate statistically significant differences (*P < 0.05).
Figure 5.

Alkaline Phosphatase (AP) mRNA expression in ASC treated with 50 ng/mL BMP‐2 and/or 10 ng/mL TGF‐β1. Gene expression analysis of ASCs was performed for AP using quantitative RT‐PCR. mRNA of control samples cultured in growth factor‐free medium was analysed at day 14. Gene expression levels were reported relative to gene expression of the housekeeping gene GAPDH. Asterisks indicate statistically significant differences (*P < 0.05).
Adipose‐derived adult stem cell differentiated into osteochondrogenic lineage in presence of BMP‐2 and the addition TGF‐β1 to the BMP‐2‐containing medium suppressed osteo‐induction. To examine whether transcription factors Dlx‐5, Msx‐2 and Runx‐2 were involved in this suppressive effect, mRNA expression of these factors was analysed by quantitative real‐time PCR (Fig. 6). Dlx‐5 mRNA expression increased continuously in samples treated with BMP‐2 and BMP‐2/TGF‐β1 during the 2‐week period. TGF‐β1 did not have any effect on Dlx‐5 expression because no change of mRNA expression over 14 days and no difference to control samples was observed at any time (Fig. 6a). Msx‐2 expression significantly increased in samples treated with TGF‐β1 (P < 0.05) by day 14. BMP‐2 and BMP‐2/TGF‐β1 did not have any effect on Msx‐2 mRNA expression as no change of mRNA expression over 14 days and no difference in control samples was observed at any time point (Fig. 6b). Runx‐2 mRNA expression was elevated in all samples after 3 days culture compared to controls. Samples treated with BMP‐2/TGF‐β1 continuously expressed the same levels of Runx‐2 mRNA up to day 14. In TGF‐β1 treated groups, Runx‐2 mRNA expression significantly decreased compared to BMP‐2/TGF‐β1 and BMP‐2 group levels (P < 0.05) (Fig. 6c).
Figure 6.

Alkaline Phosphatase (AP) enzyme acitivity in ASC treated with 50 ng/mL BMP‐2 and/or 10 ng/mL TGF‐β1. Control samples cultured in growth factor‐free medium was analysed at day 14. Alkaline phosphatase enzyme activity was analysed using quantitative chemiluminescence assay and activity levels were calculated relative to the corresponding dsDNA contents. Asterisks indicate statistically significant differences (*P < 0.05).
Alkaline phosphatase detection
Alkaline phosphatase enzyme activity was measured to examine the effect of BMP‐2 and TGF‐β1 on osteogenic differentiation in ASC (Fig. 7). Values below 20 radioluminescence units/dsDNA were considered as background noise. AP enzyme activity was detected in samples treated with BMP‐2 and in control samples by day 14. All other categories exhibited no AP activity.
Figure 7.

Dlx‐5 (a), Msx‐2 (b) and Runx‐2 (c) mRNA expression in ASC treated with 50 ng/mL BMP‐2 and/or 10 ng/mL TGF‐β1. Gene expression analysis of ASCs was performed using quantitative RT‐PCR. Gene expression levels were reported relative to gene expression of the housekeeping gene GAPDH. Values were reported relative to untreated controls of each corresponding time point. Asterisks indicate statistically significant differences (*P < 0.05).
Histology
Alginate encapsulated ASC (n = 3) were treated with 10 ng/mL TGF‐β1 and/or 50 ng/mL BMP‐2 for 14 days and then were processed to embedding in paraffin wax. Sections were cut and were stained for collagen type II and type X and the nuclei were counterstained with DAPI (Fig. 8). All beads showed a homogenous distribution of cells and consistent size of beads. Samples treated with 10 ng/mL TGF‐β1 and 50 ng/mL BMP‐2 or TGF‐β1/BMP‐2 showed positive staining for collagen type II, which was not detected in control samples. Highest level release of collagen type II into the extracellular matrix was observed in TGF/BMP‐treated samples. Collagen type X was detected in all growth factor‐treated samples and in control samples. This was due to up‐regulated collagen type X mRNA expression in all samples.
Figure 8.

Immunohistological staining for collagen type II, and collagen type X in paraffin sections of ASC treated with 50 ng/mL BMP‐2 and/or 10 ng/mL TGF‐β1 for 14 days. Control samples (Ctrl) were cultured in growth factor‐free control medium for 14 days. Representative samples are shown above (40×, counterstaining with DAPI).
DISCUSSION
Adipose tissue‐derived stem cells are a possible cell source for cartilage regeneration because they are capable of differentiation into cartilage‐like cells. The chondrogenic phenotype has been induced by TGF‐β1‐containing differentiation medium and has been maintained after pre‐treatment for 14 days in vitro and subcutaneous implantation in vivo (Erickson et al. 2002). Compared to mesenchymal stem cells derived from bone marrow, TGF‐β1‐mediated commitment of ASC to chondrogenic lineage is a later event (Mehlhorn et al. 2006). Therefore, other growth factors of the TGF‐superfamily are considered necessary for progression of chondrogenic differentiation (Lee et al. 2004). Here, in this presented study, ASC were treated with BMP‐2 and TGF‐β1, and transcriptional expression of key regulators of osteochondral differentiation, Runx‐2, Dlx‐5 and Msx‐2 was studied and compared to corresponding expression profiles of extracellular matrix molecules. BMP‐2 was shown to induce expression of chondro‐specific genes such as α1‐collagen type II and COMP, and to induce release of collagen type II, type X and sulphated GAGs into the extracellular matrix. However, treatment of ASC with BMP‐2 up‐regulated mRNA expression of bone‐specific AP and increased corresponding enzyme activity. Thus, BMP‐2 induced both an osteogenic and a chondrogenic phenotype; this also has recently been observed in micromass‐cultured bone marrow‐derived MSC (Sekiya et al. 2005) and in the stem cell‐like fibroblastic cell line C3H10T1/2 (Shea et al. 2003). Contrarily, a single study has reported that 50 ng/mL BMP‐2 induced chondrogenic lineage development and not osteogenesis in human bone marrow‐derived MSC, demonstrated by the absence of mineralized extracellular matrix, type X collagen and gene expression of osteocalcin (Schmitt et al. 2003). Because in our study ASC were stimulated with the identical concentration of BMP‐2, we suggest that the observed phenotypic differences after stimulation might be directly related to the different source of cells.
To study the effect of additional treatment with TGF‐β1 on the BMP‐2‐mediated lineage‐commitment of ASC, GAGs chondrotin‐4‐sulfate and chondroitin‐6‐sulfate, which are typically found in adult cartilage, were detected in response to the growth factors. Chondroitin‐6‐sulfate seems to be related to the integrity of the articular surfaces, whereas chondroitin‐4‐sulfate seems rather to be an important factor in calcification processes during enchondral ossification (Mourao 1988). In this study, it was shown that ASC increase the synthesis of chondroitin‐4‐sulfate and chondroitin‐6‐sulfate in presence of BMP‐2‐ or TGF‐β1‐containing medium, in a comparable manner. However, compared to samples treated with dexamethasone‐ and ascorbic acid‐containing control medium, only marginal differences were observed. This could be explained by an enhancing effect of ascorbic acid on GAG synthesis of mesenchymal stem cells as has been demonstrated in other studies (Awad et al. 2003). Only samples treated with BMP‐2 and TGF‐β1 simultaneously showed a significantly higher rate of synthesis of chondroitin‐4‐sulfate and chondroitin‐6‐sulfate compared to all other groups, suggesting a promoting effect of both growth factors on sulfated GAG synthesis in ASC. The release of hyaluronic acid into the extracellular matrix of ASC decreased within the 14‐day culture period in all observed treatment groups, highest amounts being observed in combined‐treated samples. Hyaluronic acid is generally present in embryonic cartilaginous tissue in order to control cell adhesion, migration and morphogenesis, and its synthesis becomes reduced during cartilage maturation (Craig et al. 1990). Thus, decrease in hyaluronic acid synthesis during culture of ASC could indicate progression in the developmental stage of chondrogenesis, which also corresponds to the observed increase in α1‐collagen type II expression that represents cartilage maturation.
Collagen type II contributes more than 80% of the composition of extracellular matrix of articular cartilage and its appearance has been considered to be cartilage‐specific. In mesenchymal stem cells derived from bone‐marrow, TGF‐β1 and BMP‐2 have been shown to stimulate collagen type II synthesis in vitro. In our ASC, expression of col2a1 was detected from the ninth day of stimulation with TGF‐β1 or BMP‐2, while it was never detected in control samples. At the end of the culture period, expression level of col2a1 was 2‐fold higher in combined‐treated samples compared to single‐treated samples, suggesting an additive effect of both growth factors for chondrogenic differentiation. A similar additive effect of the combined BMP‐2/TGF‐β1‐treatment was observed on COMP mRNA expression, which was more 2‐fold up‐regulated compared to single treated samples. COMP regulates cartilage‐specific organization of extracellular matrix and is considered as a specific marker for chondrogenic differentiation (Zaucke et al. 2001). Analysis of the porcine growth plate has shown localization of COMP rather in the proliferative zone than in the resting or hypertrophic zone (Ekman et al. 1997). Thus, it can be suggested that simultaneous treatment with BMP‐2 and TGF‐β1 could contribute to enhanced organization of the extracellular matrix and to development of a proliferative chondrocyte‐like cell type.
Nevertheless, collagen type X – a typical collagen produced by hypertrophic chondrocytes – was localized in the extracellular matrix of all treated samples suggesting that three‐dimensional culture of mesenchymal stem cells in presence of dexamethasone and ascorbic acid promotes hypertrophy, which has recently observed by other groups (Ma et al. 2003). The RT‐PCR studies performed showed that treatment with TGF‐β1 or BMP‐2 increased mRNA expression of α1‐collagen type X, but simultaneous application of both growth factors up‐regulated transcription 2–4‐fold compared to single‐treated samples. Hypertrophic maturation of mesenchymal stem cells in the presence of BMP‐2 and TGF‐β1 has been observed by others (Pelttari et al. 2006). Recently, another member of the TGF superfamily, BMP‐6, showed opposite effects in ASC and inhibited TGF‐β1‐induced col10a1 expression while promoting the mature chondrogenic phenotype (Estes et al. 2006). BMP‐6 induced TGF‐receptor‐I expression that enhances TGF‐β1‐related signal transduction and finally chondrogenic differentiation (Hennig et al. 2007). However, mechanisms of the inhibiting the effect of BMP‐6 on col10a1 mRNA expression has not yet been elucidated. Recently, a binding site for Dlx‐5, which is involved in differentiation processes during enchondral ossification, was detected in the promoter sequence of the col10a1 gene. It was shown that endogenous mRNA levels of Dlx5 are higher in hypertrophic chondrocytes and overexpression of Dlx5 in non‐hypertrophic chondrocytes activates the proximal col10a1 promoter (Magee et al. 2005). We have demonstrated that Dlx‐5 mRNA expression was 2–6‐fold up‐regulated in samples treated for 14 days with BMP‐2/TGF‐β1 compared to controls, which maybe contributed to increased col10a1 promoter activity in the samples. Furthermore, we have shown that stimulation with BMP‐2 induces osteogenic differentiation in ASC due to an increase in bone‐specific AP mRNA and enzyme activity. TGF‐β1 was able to inhibit the BMP‐2‐mediated osteogenesis because in the presence of BMP‐2 and TGF‐β1, bone‐specific AP was not detected. Recently, Lee et al. (2003) could show that TGF‐β1 opposes BMP‐2‐induced osteogenic transdifferentiation through Dlx5 suppression in pre‐myoblastic C2C12 cells. In contrast to ASC, C2C12 cells were shown to commit to an isolated osteogenic lineage following stimulation with BMP‐2 (Lee et al. 2003). Because of similar inhibition of BMP‐2‐induced AP elevation, but differences in lineage commitment, we aimed to examine BMP‐2‐related Dlx‐5 signalling in ASC. BMP‐2 promotes Dlx‐5 mRNA expression that results in an increase of bone‐specific AP mediated by direct binding to the promoter sequence of the AP gene or by an increase in osteo‐inductive transcription factor Runx‐2 (Lee et al. 2000, 2005; Hassan et al. 2004; Kim et al. 2004). Msx‐2 competes with Dlx‐5 at the AP promoter binding site and inhibits Dlx‐5‐mediated up‐regulation of AP mRNA (Kim et al. 2004). We observed an increase of Msx‐2, a decrease of Runx‐2 and low levels of Dlx‐5 in TGF‐β1‐treated samples. Thus, we suggest that the major pathways to induce osteogenic differentiation were switched off in these samples, confirmed by the absence of AP mRNA expression in these specimens. However, in our samples treated with BMP‐2 and TGF‐β1, Dlx‐5 and Runx‐2 mRNA expression were increased; thus, AP seems to be regulated by other mechanisms (e.g. post‐transscriptional modification) than an inhibition of Dlx‐5 transscription.
In summary, we have been able to show that BMP‐2 induces osteogenic and chondrogenic phenotypes in alginate‐encapsulated ASC following 14 days of stimulation. Osteogenic lineage differentiation was inhibited by the simultaneous use of TGF‐β1. Both growth factors in combination induced significantly higher expression of cartilage‐specific genes and elevated release of cartilage‐specific extracellular matrix proteins. It can be suggested that the transcription factors Msx‐2, Dlx‐5 and Runx‐2 may be involved in the regulation of both osteogenic and chondrogenic lineage differentiation of ASC.
REFERENCES
- Awad HA, Halvorsen YD, Gimble JM, Guilak F (2003) Effects of transforming growth factor beta1 and dexamethasone on the growth and chondrogenic differentiation of adipose‐derived stromal cells. Tissue Eng. 9, 1301–1312. [DOI] [PubMed] [Google Scholar]
- Blum JS, Li RH, Mikos AG, Barry MA (2001) An optimized method for the chemiluminescent detection of alkaline phosphatase levels during osteodifferentiation by bone morphogenetic protein 2. J. Cell Biochem. 80, 532–537. [DOI] [PubMed] [Google Scholar]
- Brittberg M, Lindahl A, Nilsson A, Ohlsson C, Isaksson O, Peterson L (1994) Treatment of deep cartilage defects in the knee with autologous chondrocyte transplantation. N. Engl. J. Med. 331, 889–895. [DOI] [PubMed] [Google Scholar]
- Craig FM, Bayliss MT, Bentley G, Archer CW (1990) A role for hyaluronan in joint development. J. Anat. 171, 17–23. [PMC free article] [PubMed] [Google Scholar]
- Dragoo JL, Choi JY, Lieberman JR, Huang J, Zuk PA, Zhang J, Hedrick MH, Benhaim P (2003) Bone induction by BMP‐2 transduced stem cells derived from human fat. J. Orthop. Res. 21, 622–629. [DOI] [PubMed] [Google Scholar]
- Ekman S, Reinholt FP, Hultenby K, Heinegard D (1997) Ultrastructural immunolocalization of cartilage oligomeric matrix protein (COMP) in porcine growth cartilage. Calcif. Tissue Int. 60, 547–553. [DOI] [PubMed] [Google Scholar]
- Erickson GR, Gimble JM, Franklin DM, Rice HE, Awad H, Guilak F (2002) Chondrogenic potential of adipose tissue‐derived stromal cells in vitro and in vivo . Biochem. Biophys. Res. Commun. 290, 763–769. [DOI] [PubMed] [Google Scholar]
- Estes BT, Wu AW, Guilak F (2006) Potent induction of chondrocytic differentiation of human adipose‐derived adult stem cells by bone morphogenetic protein 6. Arthritis Rheum. 54, 1222–1232. [DOI] [PubMed] [Google Scholar]
- Gimble JM, Guilak F (2003) Differentiation potential of adipose derived adult stem (ADAS) cells. Curr. Top. Dev. Biol. 58, 137–160. [DOI] [PubMed] [Google Scholar]
- Hangody L, Feczko P, Bartha L, Bodo G, Kish G (2001) Mosaicplasty for the treatment of articular defects of the knee and ankle. Clin. Orthop. Relat. Res. S328–36. [DOI] [PubMed]
- Hassan MQ, Javed A, Morasso MI, Karlin J, Montecino M, Van Wijnen AJ, Stein GS, Stein JL, Lian JB (2004) Dlx3 transcriptional regulation of osteoblast differentiation: temporal recruitment of Msx2, Dlx3, and Dlx5 homeodomain proteins to chromatin of the osteocalcin gene. Mol. Cell. Biol. 24, 9248–9261. [DOI] [PMC free article] [PubMed] [Google Scholar]
- Hennig T, Lorenz H, Thiel A, Goetzke K, Dickhut A, Geiger F, Richter W (2007) Reduced chondrogenic potential of adipose tissue derived stromal cells correlates with an altered TGFbeta receptor and BMP profile and is overcome by BMP‐6. J. Cell Physiol. 211, 682–691. [DOI] [PubMed] [Google Scholar]
- Indrawattana N, Chen G, Tadokoro M, Shann LH, Ohgushi H, Tateishi T, Tanaka J, Bunyaratvej A (2004) Growth factor combination for chondrogenic induction from human mesenchymal stem cell. Biochem. Biophys. Res. Commun. 320, 914–919. [DOI] [PubMed] [Google Scholar]
- Iwasaki M, Nakahara H, Nakase T, Kimura T, Takaoka K, Caplan AI, Ono K (1994) Bone morphogenetic protein 2 stimulates osteogenesis but does not affect chondrogenesis in osteochondrogenic differentiation of periosteum‐derived cells. J. Bone Miner. Res. 9, 1195–1204. [DOI] [PubMed] [Google Scholar]
- Johnson LL (1986) Arthroscopic abrasion arthroplasty historical and pathologic perspective: present status. Arthroscopy 2, 54–69. [DOI] [PubMed] [Google Scholar]
- Kawaguchi J, Mee PJ, Smith AG (2005) Osteogenic and chondrogenic differentiation of embryonic stem cells in response to specific growth factors. Bone 36, 758–769. [DOI] [PubMed] [Google Scholar]
- Kim YJ, Lee MH, Wozney JM, Cho JY, Ryoo HM (2004) Bone morphogenetic protein‐2‐induced alkaline phosphatase expression is stimulated by Dlx5 and repressed by Msx2. J. Biol. Chem. 279, 50773–50778. [DOI] [PubMed] [Google Scholar]
- Lee RH, Kim B, Choi I, Kim H, Choi HS, Suh K, Bae YC, Jung JS (2004) Characterization and expression analysis of mesenchymal stem cells from human bone marrow and adipose tissue. Cell Physiol. Biochem. 14, 311–324. [DOI] [PubMed] [Google Scholar]
- Lee MH, Kim YJ, Kim HJ, Park HD, Kang AR, Kyung HM, Sung JH, Wozney JM, Ryoo HM (2003) BMP‐2‐induced Runx2 expression is mediated by Dlx5, and TGF‐β1 opposes the BMP‐2‐induced osteoblast differentiation by suppression of Dlx5 expression. J. Biol. Chem. 278, 34387–34394. [DOI] [PubMed] [Google Scholar]
- Lee KS, Kim HJ, Li QL, Chi XZ, Ueta C, Komori T, Wozney JM, Kim EG, Choi JY, Ryoo HM, Bae SC (2000) Runx2 is a common target of transforming growth factor beta1 and bone morphogenetic protein 2, and cooperation between Runx2 and Smad5 induces osteoblast‐specific gene expression in the pluripotent mesenchymal precursor cell line C2C12. Mol. Cell. Biol. 20, 8783–8792. [DOI] [PMC free article] [PubMed] [Google Scholar]
- Lee MH, Kim YJ, Yoon WJ, Kim JI, Kim BG, Hwang YS, Wozney JM, Chi XZ, Bae SC, Choi KY, Cho JY, Choi JY, Ryoo HM (2005) Dlx5 specifically regulates Runx2‐II expression by binding to homeodomain response elements in the Runx2 distal promoter. J. Biol. Chem. 280, 35579–35587. [DOI] [PubMed] [Google Scholar]
- Ma HL, Hung SC, Lin SY, Chen YL, Lo WH (2003) Chondrogenesis of human mesenchymal stem cells encapsulated in alginate beads. J. Biomed. Mater. Res. A 64, 273–281. [DOI] [PubMed] [Google Scholar]
- Magee C, Nurminskaya M, Faverman L, Galera P, Linsenmayer TF (2005) SP3/SP1 transcription activity regulates specific expression of collagen type X in hypertrophic chondrocytes. J. Biol. Chem. 280, 25331–25338. [DOI] [PubMed] [Google Scholar]
- McIntosh K, Zvonic S, Garrett S, Mitchell JB, Floyd ZE, Hammill L, Kloster A, Di Halvorsen Y, Ting JP, Storms RW, Goh B, Kilroy G, Wu X, Gimble JM (2006) The immunogenicity of human adipose‐derived cells: temporal changes in vitro . Stem. Cells 24, 1246–1253. [DOI] [PubMed] [Google Scholar]
- Mehlhorn AT, Niemeyer P, Kaiser S, Finkenzeller G, Stark GB, Sudkamp NP, Schmal H (2006) Differential expression pattern of extracellular matrix molecules during chondrogenesis of mesenchymal stem cells from bone marrow and adipose tissue. Tissue Eng. 12, 2853–2862. [DOI] [PubMed] [Google Scholar]
- Mourao PA (1988) Distribution of chondroitin 4‐sulfate and chondroitin 6‐sulfate in human articular and growth cartilage. Arthritis Rheum. 31, 1028–1033. [DOI] [PubMed] [Google Scholar]
- Pelttari K, Winter A, Steck E, Goetzke K, Hennig T, Ochs BG, Aigner T, Richter W (2006) Premature induction of hypertrophy during in vitro chondrogenesis of human mesenchymal stem cells correlates with calcification and vascular invasion after ectopic transplantation in SCID mice. Arthritis Rheum. 54, 3254–3266. [DOI] [PubMed] [Google Scholar]
- Pittenger MF, Mackay AM, Beck SC, Jaiswal RK, Douglas R, Mosca JD, Moorman MA, Simonetti DW, Craig S, Marshak DR (1999) Multilineage potential of adult human mesenchymal stem cells. Science 284, 143–147. [DOI] [PubMed] [Google Scholar]
- Puissant B, Barreau C, Bourin P, Clavel C, Corre J, Bousquet C, Taureau C, Cousin B, Abbal M, Laharrague P, Penicaud L, Casteilla L, Blancher A (2005) Immunomodulatory effect of human adipose tissue‐derived adult stem cells: comparison with bone marrow mesenchymal stem cells. Br. J. Haematol. 129, 118–129. [DOI] [PubMed] [Google Scholar]
- Schmitt B, Ringe J, Haupl T, Notter M, Manz R, Burmester GR, Sittinger M, Kaps C (2003) BMP‐2 initiates chondrogenic lineage development of adult human mesenchymal stem cells in high‐density culture. Differentiation 71, 567–577. [DOI] [PubMed] [Google Scholar]
- Sekiya I, Larson BL, Vuoristo JT, Reger RL, Prockop DJ (2005) Comparison of effect of BMP‐2, ‐4 and ‐6 on in vitro cartilage formation of human adult stem cells from bone marrow stroma. Cell Tissue Res. 320, 269–276. [DOI] [PubMed] [Google Scholar]
- Shea CM, Edgar CM, Einhorn TA, Gerstenfeld LC (2003) BMP treatment of C3H10T1/2 mesenchymal stem cells induces both chondrogenesis and osteogenesis. J. Cell Biochem. 90, 1112–1127. [DOI] [PubMed] [Google Scholar]
- Shinmei M, Miyauchi S, Machida A, Miyazaki K (1992) Quantitation of chondroitin 4‐sulfate and chondroitin 6‐sulfate in pathologic joint fluid. Arthritis Rheum. 35, 1304–1308. [DOI] [PubMed] [Google Scholar]
- Stahl A, Wenger A, Weber H, Stark GB, Augustin HG, Finkenzeller G (2004) Bi‐directional cell contact‐dependent regulation of gene expression between endothelial cells and osteoblasts in a three‐dimensional spheroidal coculture model. Biochem. Biophys. Res. Commun. 322, 684–692. [DOI] [PubMed] [Google Scholar]
- Steadman JR, Rodkey WG, Rodrigo JJ (2001) Microfracture: surgical technique and rehabilitation to treat chondral defects. Clin. Orthop. Relat. Res. S362–9. [DOI] [PubMed]
- Wei Y, Hu Y, Lv R, Li D (2006) Regulation of adipose‐derived adult stem cells differentiating into chondrocytes with the use of rhBMP‐2. Cytotherapy 8, 570–579. [DOI] [PubMed] [Google Scholar]
- Zaucke F, Dinser R, Maurer P, Paulsson M (2001) Cartilage oligomeric matrix protein (COMP) and collagen IX are sensitive markers for the differentiation state of articular primary chondrocytes. Biochem. J. 358, 17–24. [DOI] [PMC free article] [PubMed] [Google Scholar]
- Zuk PA, Zhu M, Mizuno H, Huang J, Futrell JW, Katz AJ, Benhaim P, Lorenz HP, Hedrick MH (2001) Multilineage cells from human adipose tissue: implications for cell‐based therapies. Tissue Eng. 7, 211–228. [DOI] [PubMed] [Google Scholar]