Abstract
Cell kinetics holds a prominent role among biological factors in predicting clinical outcome and response to treatment in neoplastic patients. Different cell kinetic variables are often considered as valid alternatives to each other, but the limited size of case series analysed in several studies and the lack of simultaneous determinations of all the variables on the same tumours do not justify this conclusion. In the present study, the correlation between [3H]thymidine labelling index ([3H]dT LI), flow cytometric S phase cell fraction (FCM‐S) and Ki‐67 immunoreactivity (Ki‐67/MIB‐1) was verified and the type of correlation with the most important clinical, pathological and biological patient and tumour characteristics was investigated in a very large series of breast cancer patients. Ki‐67/MIB‐1, FCM‐S and [3H]dT LI were determined in 609, 526 and 485 patients, respectively, and all three cell proliferation indices were evaluated in parallel on the same tumour in a series of 330 breast cancer patients. All the cell kinetic determinations were performed within the context of National Quality Control Programmes. Very poor correlation coefficients (ranging from 0.37 to 0.18) were observed between the different cell kinetic variables determined in parallel on the same series of breast cancers. Moreover, Ki‐67/MIB‐1 and FCM‐S showed a significant relationship with histological type, grade and tumour size, whereas statistically significant correlations were not observed for [3H]dT LI. In conclusion, the results show that the different cell kinetic variables provide different biological information and cannot be considered as alternatives to each other.
INTRODUCTION
Breast cancer is the most common malignancy among women in Western countries and the leading cause of death from cancer among European women. For many years, classical pathological characteristics such as tumour size and axillary nodal status have been used to predict tumour recurrence and patient survival.
The growing interest in tumour biology and the development of sophisticated techniques have greatly contributed to the knowledge of molecular and cellular features involved in the malignant transformation and progression of breast cancer as well as of other human tumour histotypes. Biological markers have been identified as potential prognostic indicators; many of which are still under investigation or undergoing validation, whereas others have already passed from the laboratory to clinical application.
Among the biological factors of clinical relevance as prognostic indicators or predictors of response to clinical treatment, cell kinetics holds a prominent role and has already begun to be utilized as a tool to identify node‐negative breast cancer patients at risk who are candidates for systemic treatment ( Amadori, Volpi & Callea 1993, Paradiso et al. 1993 , Hutchins et al. 1998 ). Different techniques have been proposed to assess cell proliferation activity, among which the most frequently investigated for basic and clinical studies are [3H]thymidine labelling index ([3H]dT LI), flow cytometric S phase cell fraction (FCM‐S) and Ki‐67 immunoreactivity (Ki‐67/MIB‐1) in accordance with the specific interests of different countries.
[3H]dT LI and FCM‐S quantify the percentage of tumour cells in the DNA synthetic phase of the cell cycle (S phase) and are based on a DNA precursor incorporation and on nuclear DNA content analysis, respectively. Several studies carried out on patientgs with node‐negative operable ( Gentili, Sanfilippo & Silvestrini 1981, Meyer et al. 1983 , Hery et al. 1987 , Meyer & Province 1988a, Silvestrini et al. 1989 , Paradiso, Mangia & Picciarello 1992, Silvestrini et al. 1993a , Silvestrini et al. 1995 , Silvestrini et al. 1997 ) or advanced breast cancers treated with local regional therapy alone ( Tubiana et al. 1984 , Tubiana et al. 1989 ) have consistently shown the relevance of [3H]dT LI as an indicator of relapse‐free and overall survival. Its main limitation is the requirement for fresh material, and its advantages lie in the unequivocal autoradiographic image and the absence of confounding background factors or interference from type or time of histological fixation.
Flow cytometry is a rapid and reproducible method used to determine DNA cell content and cell cycle distribution. It can be applied to fresh, frozen and paraffin‐embedded tissue, thus representing an important means for analysing archival material. Its main limitation is represented by the difficulty in correctly quantifying S phase cell fraction in multiclonal tumours. Moreover, the results on the prognostic relevance of FCM‐S in breast cancer are controversial, probably as a result of the different planimetric or mathematical models used to quantify S phase cells. In some studies, the prognostic relevance has been reported on consecutive series of patients ( Sigurdsson et al. 1990 , Dettmar et al. 1997 ), whereas in others, it is limited to some biological subgroups ( Clark et al. 1989 , O’Reilly et al. 1990 , Clark et al. 1992 , Merkel et al. 1993 , Stal et al. 1993 ). Moreover, negative results using different analytical models to quantify FCM‐S have been reported ( Silvestrini et al. 1993a ).
Ki‐67 monoclonal antibody recognizes a nuclear antigen related to the proliferation process and is used to estimate the proliferating cell fraction. The more recently proposed MIB‐1 antibody can be applied to frozen or appropriately fixed tumour material. However, follow‐up studies conducted by the same group over time have provided conflicting results as a function of size of case series or follow‐up time ( Weidner et al. 1992 , Bevilacqua et al. 1996 ). Positive ( Sahin et al. 1991 , Gaglia et al. 1993 , Jensen et al. 1995 , Brown et al. 1996 , Thor et al. 1999 ) as well as negative ( Bouzubar et al. 1989 , Weikel et al. 1991 , Allred et al. 1993 ) results have been reported in node‐negative breast cancer. The discordance could perhaps be ascribed to the lack of Quality Control Programmes for Ki‐67/MIB‐1 determination, as suggested by the different median values reported in several papers ( Sahin et al. 1991 , Wintzer et al. 1991 , Gaglia et al. 1993 , Pinder et al. 1995 , Bevilacqua et al. 1996 , Brown et al. 1996 ).
Different cell proliferation indices are often considered and used as alternatives to each other, but the comparison between [3H]dT LI, F CM‐S and Ki‐67/MIB‐1 has not yet been conclusively investigated. The present study reports the results from an analysis of the three above‐mentioned cell proliferation indices. The aim of this study was to verify how [3H]dT LI, FCM‐S and Ki‐67/MIB‐1 are correlated to each other and in which way they are associated with the most important clinical, pathological and biological patient and tumour characteristics. Part of the determinations were performed in parallel on the same tumours from patients entered onto a prospective study that aimed at defining the prognostic relevance of the different variables.
MATERIALS AND METHODS
Patients
Six‐hundred and eighty‐four patients with histologically proven primary breast cancers were recruited between September 1989 and December 1995. All patients underwent surgery, mastectomy or quadrantectomy plus radiotherapy at Morgagni‐Pierantoni Hospital, Forlì, Infermi Hospital, Rimini, Bufalini Hospital, Cesena and Faenza Community Hospital.
The determination of cell proliferation indices was performed on previously untreated tumours at time of surgery. Tumour size, axillary lymph nodal involvement and pathological stage were determined according to the TNM classification of the UICC. Histological type and tumour grade were determined according to the WHO classification.
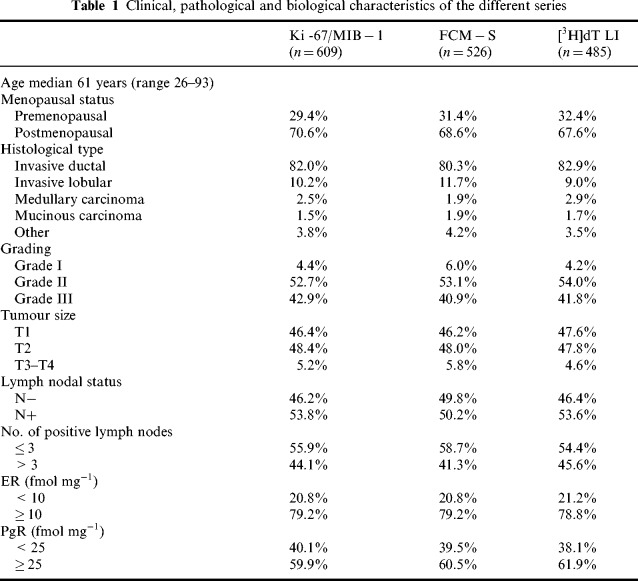
Ki‐67/MIB‐1, FCM‐S and [3H]dT LI were determined in 609, 526 and 485 patients, respectively. Clinical, pathological and biological features of the series in which the different variables were determined are shown in Table 1. All three cell proliferation indexes were determined in parallel on the same tumour in a series of 330 breast cancer patients.
Table 1.
Clinical, pathological and biological characteristics of the different series
DNA flow cytometry
FCM‐S was determined in the laboratory of the Department of Medical Oncology, Morgagni‐Pierantoni Hospital, Forlì. The laboratory participates in the ongoing National Quality Control Programme promoted by the Italian Society of Basic and Applied Cell Kinetics (SICCAB) ( Silvestrini & the SICCAB Group For Quality Control of Cell Kinetic Determination 1994).
Nuclei were rapidly isolated from frozen tissue fragments with a balanced saline enzymatic solution (Nuclear Isolation Medium‐II). Specific staining for DNA was carried out using DAPI (4,6 diamidino‐2‐phenylindole) which binds stoichiometrically to A‐T rich regions in intact DNA molecules. Samples were then filtered through a 40‐µm nylon mesh to obtain single nuclei suspensions.
Flow cytometric analysis was performed using a RATCOM cytometer (YLEM, Rome, Italy); 30 000 cells were collected from each tumour to construct each histogram and trout red blood cells were used as an internal standard. DNA contents were classified according to the DNA index value (DI) as follows: hypodiploid(DI < 0.95),diploid(0.95 ≤ DI ≤ 1.05), near diploid (1.05 < DI ≤ 1.30), hyperdiploid (1.30 < DI ≤ 1.90), tetraploid (1.90 < DI ≤ 2.10), hypertetraploid (DI > 2.10) and multiploid (presence of at least two aneuploid populations). The coefficient of variation (CV) of the G0/G1 peak was less than 5% in 42% of cases, 5–6% in 46% of cases and never exceed 8% in the remaining cases.
FCM‐S‐value was determined using the cell cycle analysis software ModFit LT (Verity Software House, Topsham, ME, USA) and was assessable in about 77% of tumours.
Thymidine labelling index
Tumour proliferation index, expressed as [3H]dT LI, was determined in the laboratory of the Department of Medical Oncology, Morgagni‐Pierantoni Hospital, Forlì. [3H]dT LI was determined by autoradiography on fresh tumour material.
Briefly, 8–12 small tumour fragments obtained from surgical material were placed in culture medium containing [3H]thymidine for 1 h in continuous gentle agitation at 37°C and then embedded in paraffin. The recent availability of a commercial kit (Euroframe, Asti, Italy) enabled all the centres to perform this first step of in vitro [3H]thymidine labelling in their own laboratory. Histological sections were dipped in a photographic emulsion (Ilford K5, Ilford Photographicals London, UK) and exposed in darkness for 3 days at 4°C. Autoradiograms were developed in Phenprint (Ilford) for 6 min at 19°C and fixed in Hypam (Ilford). Samples were stained with haematoxylin and eosin at 4°C. When the specimens were small enough to allow the [3H] thymidine to penetrate completely, counting was performed throughout the whole section; conversely, counting was limited to the periphery of the section (up to 80 µm in depth). [3H]dT LI was determined by scoring a total of 2000–5000 cells in the different fragments from each tumour and was calculated as the percentage ratio between labelled cells and total number of tumour cells. The [3H]dT LI determinations were performed within the context of an ongoing National Quality Control Programme promoted by the Italian Society of Basic and Applied Cell Kinetics (SICCAB) ( Silvestrini 1991).
Ki‐67/MIB‐1 immunostaining
Ki‐67/MIB‐1 determination was performed by four different institutions using Ki‐67 antibody on 414 frozen specimens and MIB‐1 antibody on 195 paraffin‐embedded tumour samples.
Surgically excised specimens were fixed in 10% neutral buffered formalin and embedded in paraffin or frozen in liquid nitrogen. Cryostat sections of frozen tissue were fixed in absolute acetone at 20°C. Paraffin sections were dewaxed and rehydrated through graded concentrations of ethanol (from 100% ethanol to distilled water). All samples were blocked for endogenous peroxidase activity with hydrogen peroxide. Paraffin sections were microwaved in citrate buffer (pH 6.0) before immunostaining. Two different primary antibodies were used: mouse monoclonal Ki‐67 antibody (DAKO, Glostrup, Denmark) was employed on frozen tissue and mouse monoclonal MIB‐1 antibody (Biogenex, San Ramon, USA) was used for paraffin‐embedded samples.
For the second step, biotinylated rabbit anti‐mouse immunoglobulins were used. Sections were stained by the streptavidin‐biotin peroxidase complex (DAKO, Glostrup, Denmark). Hydrogen peroxide was used as substrate and diaminobenzidine as chromogen. The slides were lightly counterstained with haematoxylin.
Diffuse or dot‐like nuclear reactivity was considered as Ki‐67/MIB‐1 positive staining. Positive cells were quantified by counting at least 1000 cells in 15–20 different fields at 400‐fold magnification. Ki‐67/MIB‐1 growth fraction was expressed as the percentage ratio between immunoreactive and total number of tumour cells.
Ki‐67/MIB‐1 determination was performed within the context of a recently activated Quality Control Programme of the Special Project ‘Clinical Applications of Cancer Research’ (ACRO) promoted by the National Council of Research (CNR).
Steroid receptor assays
Surgically obtained tumour samples were immediately frozen at ‐20°C and stored at ‐80°C. Oestrogen (ER) and progesterone (PgR) receptor status was quantitatively assessed by dextran‐coated charcoal technique (DCC) according to the European Organization for Research and Treatment of Cancer ( EORTC 1980). Values of 10 fmol and 25 fmol g‐1 protein were used as cut‐off points for oestrogen and progesterone receptors, respectively.
Statistical analyses
Differences in cell proliferation indices between subgroups defined according to clinical, pathological and biological characteristics were assessed by means of the Median Score test. The relationship between Ki‐67/MIB‐1, FCM‐S and [3H]dT LI, considered as continuous variables, was analysed by means of Spearman's rank coefficient. The level of significance was set at P<0.05. The statistical analyses were performed using SAS software (SAS Institute, Cary, NC, USA).
RESULTS
Ki‐67/MIB‐1 determination was carried out in 609 of 684 primary breast cancers, with indices ranging from 0.1% to 80.0%, with a median value of 15.0%. FCM‐S determination was assessable in 77% of cases, with a median value of 10.1% (range 0.6–45.6%). [3H]dT LI was evaluable in 485 of the 684 fresh tumour specimens processed, with a feasibility of 71% the fraction of thymidine‐incorporating cells varied from 0.01% to 21.3%, with a median value of 3.1%. The three series of tumours analysed for the different cell proliferation indices, although different in overall number, were quite similar and well balanced as regards the various clinical, pathological and biological characteristics ( Table 1).
Relationship between cell kinetic parameters and the other variables
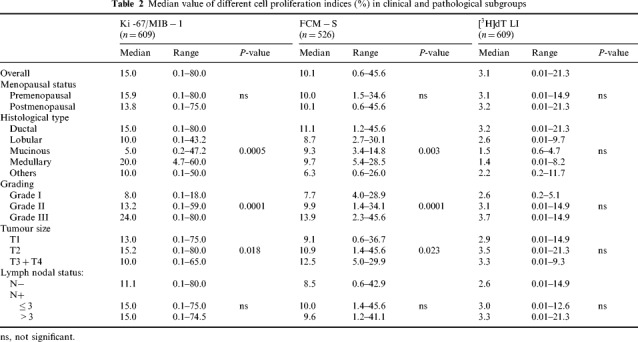
Table 2 shows the relationship between the cell proliferation indices and the clinical and pathological features in the different series of patients. Ki‐67/MIB‐1 and FCM‐S were statistically related to histological type and tumour size, and showed a significant increase from grade I to grade III. Conversely, the median [3H]dT LI value did not show significant differences as a function of the above tumour characteristics, probably as a result of the wide and overlapping ranges of values observed in the different subgroups. Moreover, all three variables were unrelated to menopausal and lymph nodal status.
Table 2.
Median value of different cell proliferation indices (%) in clinical and pathological subgroups
The relationship between the cell kinetic variables and other biological features analysed in the different series of patients is shown in Table 3. All cell proliferation indices were significantly related to steroid receptors and DNA content. Specifically, the median values of the three cell kinetic variables were significantly higher in ER or PgR‐negative rather than positive tumours and in aneuploid rather than diploid tumours. The latter difference was more evident for FCM‐S and [3H]dT LI. Moreover, within aneuploid tumours, the subgroup of near diploid lesions showed median values of FCM‐S and [3H]dT LI (8.1% and 2.6%, respectively) similar to those observed in diploid tumours. Therefore, the statistical significance of the difference betweenthe median values of FCM‐S and [3H]dT LI greatly increased when neardiploid tumours were grouped with diploid ones (data not shown).
Table 3.
Median value of different cell proliferation indices (%) in biological subgroups

Relationship between the cell kinetic variables
All three cell proliferation variables were determined in parallel on a series of 330 cancers. In correlation analysis, the cell proliferation indices were at first analysed as continuous variables. The experimental values for individual tumours in a matched pair analysis are shown in 1, 2 and 3. Spearman's correlation coefficients between the different variables were poor: 0.37 for Ki‐67/MIB‐1 vs. FCM‐S, 0.25 for FCM‐S vs. [3H]dT LI and 0.18 for Ki‐67/MIB‐1 vs. [3H]dT LI. Nevertheless, the correlations were generally statistically significant (P = 0.0001, P = 0.0001 and P = 0.001, respectively) owing to the high number of cases. These results remained constant when determinations performed by Forlì and the other institutions were analysed separately ( Table 4).
Figure 1.
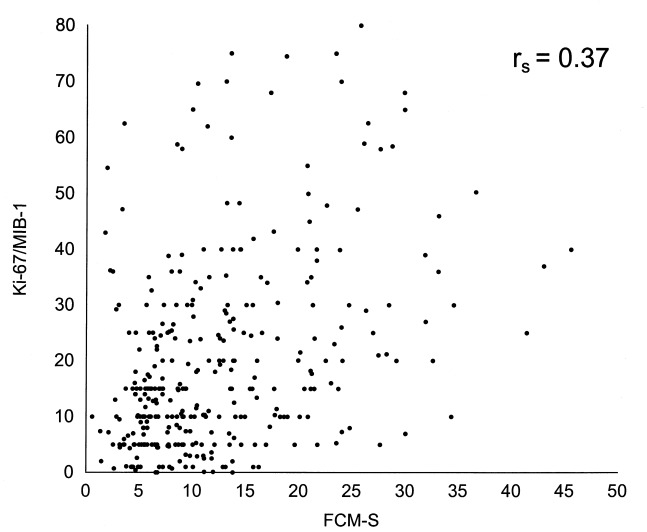
Relationship between Ki‐67/MIB‐1 and FCM‐S‐values on a series of 330 breast cancers.
Figure 2.
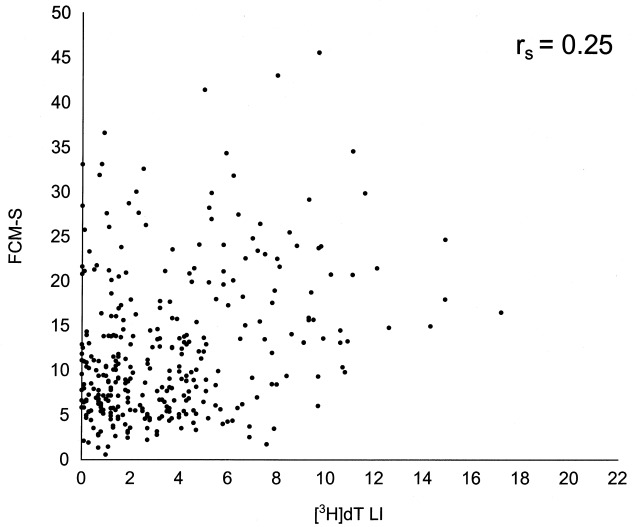
Relationship between FCM‐S and [3H]dT LI values on a series of 330 breast cancers.
Figure 3.
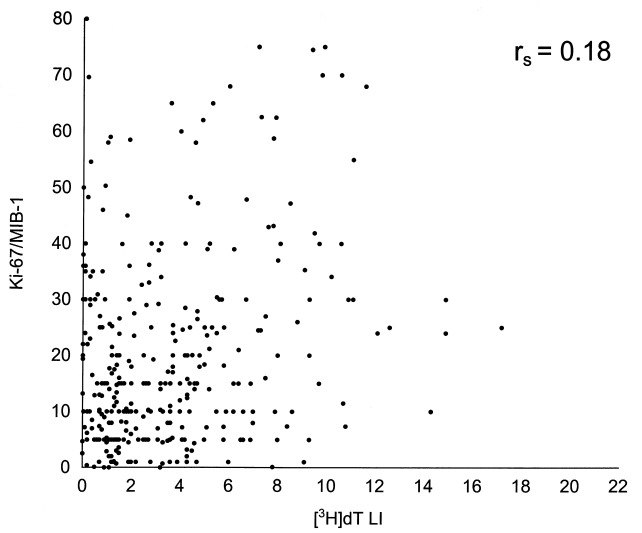
Relationship between Ki‐67/MIB‐1 and [3H]dT LI values on a series of 330 breast cancers.
Table 4.
Relationship between different cell proliferation indexes determined in different centres (330 cases)

In order to verify whether the degree of correlation varies in relation to different subgroups of cell proliferation indices, e.g. in slowly or rapidly proliferating tumours, a further analysis performed on subgroups defined according to quartile criteria (data not shown) did not evidence significant relationship, while correlation coefficients dramatically decreased, reinforcing the hypothesis that the significant correlations observed in the analysis on the overall series were due to the large number of cases and not to actual biological correlations.
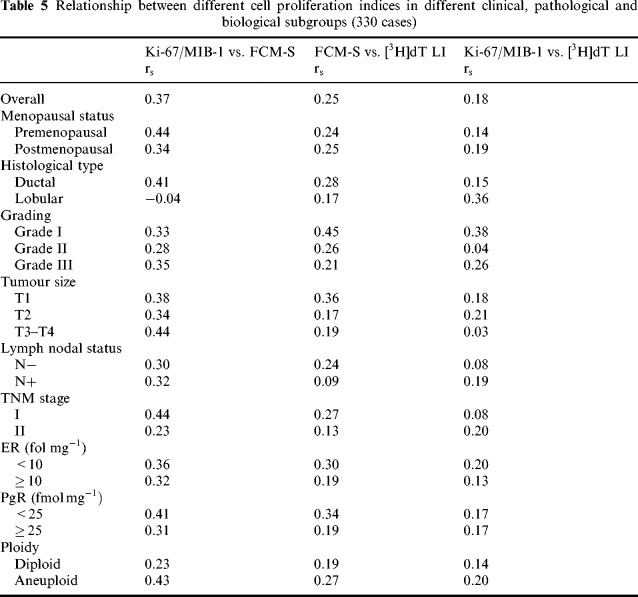
In a further analysis the correlation between cell proliferation indices was investigated in subgroups of patients defined on the basis of clinical, pathological and biological features ( Table 5). Relatively higher correlation coefficients than those previously mentioned were observed between Ki‐67/MIB‐1 and FCM‐S in ductal r s = 0.41), large (r s = 0.44), stage I (r s = 0.44) or aneuploid (r s = 0.43) tumours, and in tumours from pre menopausal patients (r s = 0.44) or with weak PgR expression (r s = 0.41). In the different subgroups, very poor correlation coefficients were observed between FCM‐S and [3H]dT LI, and between Ki‐67/MIB‐1 and [3H]dT LI, with the exception of grade I tumours.
Table 5.
Relationship between different cell proliferation indexes in different clinical, pathological and biological subgroups (330 cases)
DISCUSSION
The interest in translational research and the activation of clinical protocols designed on biological bases make it of the utmost importance for researchers to define the clinical relevance of biological markers. As far as cell proliferation is concerned, the search for variables characterized by a high feasibility and simplicity, which are evaluable on paraffin‐embedded samples for retrospective analyses, has led to the setting up of different approaches and to the theoretical extrapolation of some issues without adequate experimental evidence and support. It is thought that different cell proliferation indices could give the same or similar biological information and could thus be used interchangeably. Such an assumption has not been experimentally validated on adequate case series and may be incorrect if it is considered that the determination of different cell kinetic variables is based on different rationales and aimed at analysing different targets, e.g. the total nuclear DNA content, the fraction of cells actively synthesizing DNA or the presence of antigens presumably expressed in all proliferating cells.
Up to now, studies have been directed at defining the relationship between pairs of cell kinetic variables in different tumour types. In particular, several breast cancer studies have analysed the relation between FCM‐S and Ki‐67/MIB‐1 indices on relatively small series of patients ranging from 54 to 168 cases. A significant correlation between the two cell kinetic variables in the overall series of patients ( Dawson, Norton & Weinberg 1990, Isola et al. 1990 , Gasparini et al. 1994 , Keshgegian & Cnaan 1995, Ellis et al. 1996 , Pierga et al. 1996 ) or limited to the subgroup of aneuploid tumours ( Viehl et al. 1990 , Dettmar et al. 1997 ) has been reported. However, in these papers, as in the present study, the correlation coefficients were generally poor, ranging from 0.2 to 0.6. For this reason we believe that it is incorrect to conclude that the relationship between the two parameters reflects the identification of the same biological aspect. Moreover, the relatively low fraction of aneuploid tumours reported in some studies ( < 50%) ( Isola et al. 1990 , Viehl et al. 1990 , Dettmar et al. 1997 ) raises some perplexities regarding the consecutive nature of the case series. Only very few studies have analysed the relationship between [3H]dT LI and FCM‐S ( Silvestrini et al. 1993a , Meyer & Coplin 1988b) or Ki‐67/MIB‐1 ( Kamel et al. 1989 , Rudas et al. 1994 ) identifying, in the majority of cases, a poor correlation or no relationship at all.
With regard to the recent activation of multicentric clinical protocols for breast cancer patients in which adjuvant treatment is planned on the basis of tumour cell proliferation, and in relation to the possibility of shortening the recruitment period by enrolling patients from different centres with tumours characterized by different variables, the present study aimed at defining the relationship between the three most frequently used cell kinetic variables, FCM‐S, [3H]dT LI and Ki‐67/MIB‐1, on a series of breast cancers that was larger than any previously analysed. Moreover, in contrast to the majority of previous studies, the biological determinations in this study were carried out within the context of Quality Control Programmes. The median values of the cell kinetic variables were consistent with those previously reported in other studies for [3H]dT LI ( Silvestrini et al. 1986 , Silvestrini et al. 1990 , Silvestrini et al. 1993a , Silvestrini et al. 1993b , Silvestrini et al. 1993c ), and were in the range of values reported for FCM‐S ( Wenger & Clark 1998) and Ki‐67/MIB‐1 ( Sahin et al. 1991 , Wintzer et al. 1991 , Gaglia et al. 1993 , Pinder et al. 1995 , Bevilacqua et al. 1996 , Brown et al. 1996 ).
The study provided direct and indirect evidence for the lack of correlation between the different variables, highlighting, as could reasonably be assumed, that they provide different biological information. The range of [3H]dT LI values was narrower, not only than that observed for Ki‐67/MIB‐1, directed at evaluating growth fraction, but also than that observed for FCM‐S, which, similarly to [3H]dT LI, is directed at evaluating the S phase cell fraction.
The relation between Ki‐67/MIB‐1 or FCM‐S and pathological variables could be superimposed, whereas it was quite different for [3H]dT LI. Such a finding is indirect evidence that the different variables are not related in the same way to important factors indicative of a preclinical history of the tumour such as tumour size. Conversely, a correlation was generally observed between all three cell kinetic variables and steroid receptor status and ploidy, that is tumour biological features defined at the time of surgery.
The analysis of the different variables determined in parallel on the same series of breast cancers provided direct evidence of their very poor correlation, notwithstanding the statistical significance reached because of the high number of cases. This finding remained constant using quartile criteria analysis and, apart from a slight variation, was not modified in the different clinical, pathological and biological subgroups.
In conclusion, the results of the present study unequivocally show the lack of agreement among the different cell kinetic variables in breast cancer. Although the subjective microscopic determination for two of the three variables analysed could account for evaluation errors (which were largely excluded by the participation in Quality Control Programmes, and by the evidence of reproducibility of the values between the Forlì referee centre and the other institutions), the very poor correlations do not permit us to use the different variables interchangeably.
As different cell kinetic variables may have a different potential as indicators of biological aggressiveness or as predictors of response to different types of treatment, the two roles must be defined for each variable on adequate cases series and within Quality Control Programmes, following the guidelines proposed and already used for some cell kinetic variables, before prospectively using them in clinical practice ( McGuire 1991, Silvestrini 1993d, Simon & Altman 1994, American Society of Clinical Oncology 1996).
Acknowledgements
The authors wish to thank Prof. Rosella Silvestrini for her invaluable scientific contribution, Dr Oriana Nanni for her help and advice, and Ms Grainne Tierney for editing the manuscript. The study was supported by a grant from the Istituto Oncologico Romagnolo, Forlì, Italy.
REFERENCES
- Allred DC, Clark GM, Elledge R et al. (1993). Association of p53 protein expression with tumor cell proliferation rate and clinical outcome in node‐negative breast cancer. J. Natl. Cancer Inst. 85,200. [DOI] [PubMed] [Google Scholar]
- Amadori D, Volpi A, Callea A.(1993). Clinical relevance of cell kinetics in breast cancer. Ann. NY Acad. Sci. 698,186. [DOI] [PubMed] [Google Scholar]
- American Society Of Clinical Oncology .(1996). Clinical practice guidelines for the use of tumor markers in breast and colorectal cancer. J. Clin. Oncol. 14,2843. [DOI] [PubMed] [Google Scholar]
- Bevilacqua P, Verderio P, Barbareschi M et al. (1996). Lack of prognostic significance of the monoclonal antibody Ki‐S1, a novel marker of proliferative activity, in node‐negative breast carcinoma. Breast Cancer Res. Treat. 37,123. [DOI] [PubMed] [Google Scholar]
- Bouzubar N, Walker KJ, Griffiths K et al. 1989. Ki‐67 immunostaining in primary breast cancer: pathological and clinical associations. Br. J. Cancer 59,943. [DOI] [PMC free article] [PubMed] [Google Scholar]
- Brown RW, Allred DC, Clark GM, Osborne CK, Hiolsenbeck SG.(1996). Prognostic value of Ki‐67 compared to S‐phase fraction in axillary node‐negative breast cancer. Clin. Cancer Res. 2,585. [PubMed] [Google Scholar]
- Clark GM, Dressler LG, Owens MA, Pounds G, Oldaker T, McGuire WL.(1989). Prediction of relapse or survival in patients with node‐negative breast cancer by DNA flow cytometry. N. Engl. J. Med. 320,627. [DOI] [PubMed] [Google Scholar]
- Clark GM, Mathieu MC, Owens MA et al. (1992). Prognostic significance of S‐phase fraction in good‐risk, node‐negative breast cancer patients. J. Clin. Oncol. 10,428. [DOI] [PubMed] [Google Scholar]
- Dawson AE, Norton JA, Weinberg DS.(1990). Comparative assessment of proliferation and DNA content in breast carcinoma by image analysis and flow cytometry. Am. J. Pathol. 136,1115. [PMC free article] [PubMed] [Google Scholar]
- Dettmar P, Harbeck N, Thomssen C.et al. (1997). Prognostic impact of proliferation‐associated factors MIB‐1 (Ki‐67) and S‐phase in node‐negative breast cancer. Br. J. Cancer 75,1525. [DOI] [PMC free article] [PubMed] [Google Scholar]
- Ellis PA, Makris A, Burton SA et al. (1996). Comparison of MIB‐1 proliferation index with S‐phase fraction in human breast carcinomas. Br. J. Cancer 73,640. [DOI] [PMC free article] [PubMed] [Google Scholar]
- EORTC Breast Cancer Cooperative Group .(1980). Revision of the standards for the assessment of hormone receptors in human breast cancers. Eur. J. Cancer 16,1513 [DOI] [PubMed] [Google Scholar]
- Gaglia P, Bernardi A, Venesio T et al. (1993). Cell proliferation of breast cancer evaluated by anti‐BrdU and anti‐Ki‐67 antibodies: its prognostic value on short‐term recurrences. Eur. J. Cancer 29A,1509. [DOI] [PubMed] [Google Scholar]
- Gasparini G, Boracchi P, Verderio P, Bevilacqua P.(1994). Cell kinetics in human breast cancer: comparison between the prognostic value of the cytofluorimetric S‐phase fraction and that of the antibodies to Ki‐67 and PCNA antigens detected by immunocytochemistry. Int. J. Cancer 57,822. [DOI] [PubMed] [Google Scholar]
- Gentili C, Sanfilippo O, Silvestrini R.(1981). Cell proliferation and its relationship to clinical features and relapse in breast cancers. Cancer 48,974. [DOI] [PubMed] [Google Scholar]
- Hery M, Gioanni J, Lalanne CM, Namer M, Courdi A.(1987). The DNA labelling index: a prognostic factor in node‐negative breast cancer. Breast Cancer Res. Treat. 9,207. [DOI] [PubMed] [Google Scholar]
- Hutchins L, Green S, Ravdin P et al. (1998). CMF versus CAF with or without tamoxifen in high‐risk node‐negative breast cancer patients and a natural history follow‐up study in low‐risk node‐negative patients: first results of intergroup trial INT 0102. Proc. ASCO 2,1a. [Google Scholar]
- Isola JJ, Helin HJ, Helle MJ, Kallioniemi OP.(1990). Evaluation of cell proliferation in breast carcinoma. Cancer 65,1180. [DOI] [PubMed] [Google Scholar]
- Jensen V, Ladekarl M, Holm‐Nielsen P, Melsen F, Soerensen FB.(1995). The prognostic value of oncogenic antigen 519 (OA‐519) expression and proliferative activity detected by antibody MIB‐1 in node‐negative breast cancer. J. Pathol. 176,343. [DOI] [PubMed] [Google Scholar]
- Kamel OW, Franklin WA, Ringus JC, Meyer JS.(1989). Thymidine labeling index and Ki‐67 growth fraction in lesions of the breast. Am. J. Pathol. 134,107. [PMC free article] [PubMed] [Google Scholar]
- Keshgegian AA & Cnaan A.(1995). Proliferation markers in breast carcinoma. Am. J. Clin. Pathol. 104,42. [DOI] [PubMed] [Google Scholar]
- McGuire WL.(1991). Breast cancer prognostic factors: evaluation guidelines. J. Natl. Cancer Inst. 83,154. [DOI] [PubMed] [Google Scholar]
- Merkel DE, Winchester DJ, Goldschmidt RA, August CZ, Wruck DM, Rademaker AW.(1993). DNA flow cytometry and pathologic grading as prognostic guides in axillary lymph node‐negative breast cancer. Cancer 72,1926. [DOI] [PubMed] [Google Scholar]
- Meyer JS, Friedman E, McCrate M, Bauer WC.(1983). Prediction of early course of breast carcinoma by thymidine labelling. Cancer 51,1879. [DOI] [PubMed] [Google Scholar]
- Meyer JS & Province M.(1988a). Proliferative index of breast carcinoma by thymidine labelling: prognostic power independent of stage, estrogen and progesterone receptors. Breast Cancer Res. Treat. 12,191. [DOI] [PubMed] [Google Scholar]
- Meyer JS & Coplin MD.(1988b). Thymidine labeling index, flow cytometric S‐phase measurement, and DNA index in human tumors. Am. J. Clin. Pathol. 89,586. [DOI] [PubMed] [Google Scholar]
- O’Reilly SM, Camplejohn RS, Barnes DM, Millis RR, Rubens RD, Richards MA.(1990). Node‐negative breast cancer: prognostic subgroups defined by tumor size and flow cytometry. J. Clin. Oncol. 8,2040. [DOI] [PubMed] [Google Scholar]
- Paradiso A, Mangia A, Picciarello M.(1992). Fattori prognostici nel carcinoma della mammella operabile N‐: attività proliferativa e caratteristiche clinico‐patologiche. Folia Oncol. 3,1. [Google Scholar]
- Paradiso A, Mangia A, Barletta A et al. (1993). Randomized clinical trial of adjuvant chemotherapy in patients with node negative, fast proliferating breast cancer. Drugs.45 (Suppl. 2),68. [DOI] [PubMed] [Google Scholar]
- Pierga JY, Leroyer A, Viehl P, Mosseri V, Chevillard S, Magdelenat H.(1996). Long term prognostic value of growth fraction determination by Ki‐67 immunostaining in primary operable breast cancer. Breast Cancer Res. Treat. 37,57. [DOI] [PubMed] [Google Scholar]
- Pinder SE, Wencyk P, Sibbering DM et al. (1995). Assessment of the new proliferation marker MIB1 in breast carcinoma using image analysis: associations with other prognostic factors and survival. Br. J. Cancer 71,146. [DOI] [PMC free article] [PubMed] [Google Scholar]
- Rudas M, Gnant MFX, Mittlbock M et al. (1994). Thymidine labeling index and Ki‐67 growth fraction in breast cancer: comparison and correlation with prognosis. Breast Cancer Res. Treat. 32,165. [DOI] [PubMed] [Google Scholar]
- Sahin AA, Ro J, Ro JY et al. (1991). Ki‐67 immunostaining in node‐negative stage I/II breast carcinoma. Cancer 68,549. [DOI] [PubMed] [Google Scholar]
- Sigurdsson H, Baldetorp B, Borg A et al. (1990). Indicators of prognosis in node‐negative breast cancer. N. Engl. J. Med. 322,1045. [DOI] [PubMed] [Google Scholar]
- Silvestrini R, Daidone MG, Di Fronzo G, Morabito A, Valagussa P, Bonadonna G.(1986). Prognostic implication of labeling index versus estrogen receptors and tumor size in node‐negative breast cancer. Breast Cancer Res. Treat. 7,161. [DOI] [PubMed] [Google Scholar]
- Silvestrini R, Daidone MG, Valagussa P, Di Fronzo G, Mezzanotte G, Bonadonna G.(1989). Cell kinetics as a prognostic indicator in node‐negative breast cancer. Eur. J. Cancer Clin. Oncol. 25,1165. [DOI] [PubMed] [Google Scholar]
- Silvestrini R, Daidone MG, Valagussa P et al. (1990). 3H‐thymidine labeling index as a prognostic indicator in node‐positive breast cancer . J. Clin. Oncol. 8,1321. [DOI] [PubMed] [Google Scholar]
- Silvestrini R (on Behalf Of The SICCAB Group For Quality Control Of Cell Kinetic Determination) .(1991). Feasibility and reproducibility of the [3H]‐thymidine labelling index in breast cancer . Cell Prolif. 24,437. [DOI] [PubMed] [Google Scholar]
- Silvestrini R, Daidone MG, Del Bino G et al. (1993a). Prognostic significance of proliferative activity and ploidy in node‐negative breast cancers. Ann. Oncol. 4,213. [DOI] [PubMed] [Google Scholar]
- Silvestrini R, Benini E, Daidone MG et al. (1993b). p53 as an independent prognostic marker in node‐negative breast cancers. J. Natl. Cancer Inst. 85,965. [DOI] [PubMed] [Google Scholar]
- Silvestrini R, Daidone MG, Mastore M et al. (1993c). Cell kinetics as a predictive factor in node‐positive breast cancer treated with adjuvant hormone therapy. J. Clin. Oncol. 11,1150. [DOI] [PubMed] [Google Scholar]
- Silvestrini R.(1993d). Biological markers for designing clinical protocols. Ann. NY Acad. Sci. 698,271. [DOI] [PubMed] [Google Scholar]
- Silvestrini R and the SICCAB Group For Quality Control Of Cell Kinetic Determination .(1994). Quality control for the evaluation of S‐phase fraction by flow cytometry: a multicentric study. Cytometry 18,11. [DOI] [PubMed] [Google Scholar]
- Silvestrini R, Daidone MG, Luisi A et al. (1995). Biologic and clinicopathologic factors as indicators of specific relapse types in node‐negative breast cancer. J. Clin. Oncol. 13,697. [DOI] [PubMed] [Google Scholar]
- Silvestrini R, Daidone MG, Luisi A, Mastore M, Leutner M, Salvadori B.(1997). Cell proliferation in 3800 node‐negative breast cancers: consistency over time of biological and clinical information provided by 3H‐thymidine labelling index . Int. J. Cancer (Pred. Oncol.) 74,122. [DOI] [PubMed] [Google Scholar]
- Simon R & Altman DG.(1994). Statistical aspects of prognostic factors studies in oncology. Br. J. Cancer 69,979. [DOI] [PMC free article] [PubMed] [Google Scholar]
- Stal O, Dufmats M, Hatschek T et al. (1993). S‐phase fraction is a prognostic factor in stage I breast carcinoma. J. Clin. Oncol. 11,1717. [DOI] [PubMed] [Google Scholar]
- Thor AD, Liu S, Moore IIDH, Edgerton SM.(1999). Comparison of mitotic index, in vitro bromodeoxyuridine labeling, and MIB‐1 assays to quantitate proliferation in breast cancer. J. Clin. Oncol. 17,470. [DOI] [PubMed] [Google Scholar]
- Tubiana M, Pejovic MH, Chavaudra N, Contesso G, Malaise EP.(1984). The long‐term prognostic significance of the thymidine labelling index in breast cancer. Int. J. Cancer 33,441. [DOI] [PubMed] [Google Scholar]
- Tubiana M, Pejovic MH, Koscielny S, Chavaudra N, Malaise E.(1989). Growth rate, kinetics of tumor cell proliferation and long‐term outcome in human breast cancer. Int. J. Cancer 44,17. [DOI] [PubMed] [Google Scholar]
- Viehl P, Chevillard S, Mosseri V, Donatini B, Magdelenat H.(1990). Ki‐67 index and S‐phase fraction in human breast carcinomas. Am. J. Clin. Pathol. 94,681. [DOI] [PubMed] [Google Scholar]
- Weidner N, Folkman J, Pozza F et al. (1992). Tumor angiogenesis: a new significant and independent prognostic indicator in early‐stage breast carcinoma. J. Natl. Cancer Inst. 84,1875. [DOI] [PubMed] [Google Scholar]
- Weikel W, Beck T, Mitze M, Knapstein PG.(1991). Immunohistochemical evaluation of growth fractions in human breast cancers using monoclonal antibody Ki‐67. Breast Cancer Res. Treat. 18,149. [DOI] [PubMed] [Google Scholar]
- Wenger CR & Clark GM.(1998). S‐phase fraction and breast cancer a decade of experience. Breast Cancer Res. Treat. 51,255. [DOI] [PubMed] [Google Scholar]
- Wintzer HO, Zipfel I, Schulte‐Monting J, Hellerich U, Von Kleist S.(1991). Ki‐67 immunostaining in human breast tumors and its relationship to prognosis. Cancer 67,421. [DOI] [PubMed] [Google Scholar]


