Abstract
Objectives
Overexpression or constitutive activation of epidermal growth factor receptors (EGFR) is involved in growth of human cancers. We investigated effects of EGFR and HER‐2 blockade in colon cancer cell lines using cetuximab and trastuzumab, with the aim of developing novel approaches to cancer therapy.
Materials and methods
We studied effects of treatment on cell growth, cell cycle distribution, induction of apoptosis, changes in EGFR and HER‐2 mRNA‐protein expression and EGFR and HER‐2 gene copy number in Caco‐2, HT‐29 and HCT‐116 cells.
Results
Treatment of cells resulted in no effect in one of the three cell lines and in inhibition of cell proliferation in a time‐ and dose‐dependent manner in the other two, with modulation of EGFR and HER‐2 mRNA and protein levels. Differences in sensitivity to cetuximab and trastuzumab were observed. Treatment induced specific changes in cell cycle distribution in both cell lines affected, while apoptosis was not increased. Fluorescence in situ hybridization analysis revealed abnormal copy number of two genes resulting from aneuploidy; this was not responsible for different sensitivity to combination between the two cell lines.
Conclusions
Targeting EGFR and HER‐2 simultaneously could have useful applications in colorectal cancer treatment. To improve pharmacological efficacy of cetuximab and trastuzumab combination, molecular mechanisms involved in their activity need to be elucidated.
Introduction
Colon cancer is one of the most common human malignancies, and is a leading cause of death worldwide. In Europe approximately 250 000 new colon cancer cases are diagnosed each year, accounting for around 9% of all malignancies 1, 2. Incidence is slightly higher in North Western Europe than in Southern and Eastern regions 3. In recent years, targeted therapy has represented a valid approach for treating colorectal cancer and a promising area of research that aims to exploit molecular mechanisms responsible for tumour progression.
Type 1 growth factors and their tyrosine kinase receptors have 11 genes that encode ligands, and four genes that encode transmembrane receptors (human epidermal growth factor receptor, also known as HER‐1, ErbB‐1 or EGFR; HER‐2 or ErbB‐2; HER‐3 or ErbB‐3; HER‐4 or ErbB‐4) 4, 5. Ligand‐induced homo‐ and heterodimerization activates signalling cascades that affect proliferation, differentiation, cell motility and survival 6. Dysregulation of signalling pathways induced via ErbB/HER receptors, by their overexpression or constitutive activation, can promote tumour expansion processes including angiogenesis, stromal invasion and metastasis, and is associated with poor prognosis in many human malignancies 7. Thus, the ErbB/HER receptor family and particularly its most prominent members, EGFR and HER‐2, represent valid targets for anti‐cancer therapy. EGFR is often overexpressed or constitutively activated in colon cancer, correlating with poor response to treatment, disease progression and poor survival 8. Cetuximab (C225; Erbitux®) is a chimaeric monoclonal antibody clinically approved for treating colorectal cancer. It binds the extra‐cellular domain of EGFR with high affinity, prevents its ligand from interacting with the receptor and the receptor from adopting conformation required for dimerization 9, 10, 11. Tumour‐promoting effects of HER‐2 have been well characterized in breast cancer 12, yet little is known concerning its potential role as a therapeutic target in colon cancers, whose cells express fewer HER‐2 receptors than those of breast cancers 13. However, overexpression of HER‐2 in colon cancer compared to normal adjacent colon tissue has been demonstrated 14, 15, 16, 17. Trastuzumab (Herceptin®), a humanized monoclonal antibody, inhibits cell population growth by binding to the extracellular domain of HER‐2 receptor. This has already been approved for treatment of metastatic breast cancer and gastric cancer 18, and it has been shown to inhibit colony formation in HCA‐7 colon cancer cell line 19. Monotherapy response rates of cetuximab in metastatic colorectal cancer are no better than mild 20, although these improve when monoclonal antibodies (mAbs) are used in combination with chemotherapy. However, poor tumour penetration, autocrine signalling, acquired resistance and receptor mutation hinder drug performance 21, 22. It is thus useful to develop complementary therapeutic strategies to enhance antibody efficacy. Few studies have examined effects of targeting both EGFR and HER‐2 in colon cancer 23. This could be a potentially important approach, as EGFR and HER‐2 are preferred heterodimerization partners when co‐expressed, and co‐operate in signalling 24. Co‐expression of several EGF receptors may lead to enhanced transforming potential and worsened prognosis 25. It was recently established that combinations of anti‐EGFR antibodies synergistically reduced surface receptor levels both in vitro and in vivo. This downregulation of receptors lead to enhanced tumour cell killing and prolonged survival, in mouse xenograft models of cancer 26. Efficacy of combinations of mAbs in inducing downregulation has also been reported for ErbB2 in mouse models 27. Thus, co‐administration of inhibitors, targeting multiple members of the EGF receptor family, may provide greater therapeutic benefit to patients, constituting an interesting approach to cancer therapy.
In this investigation, we used Caco‐2, HT‐29 and HCT‐116 human colon cancer cell lines. These enterocyte phenotypes were derived from three human primary colon carcinomas, and are well‐established models for study of biology and drug treatment of colon cancer 28. We examined effects of cetuximab and trastuzumab, alone or in combination, on cell proliferation. Blocking both EGFR and HER‐2 receptors had a synergistic effect on inhibition of replication of Caco‐2 and HT‐29 cells, demonstrating the role of both receptors in tumour growth and progression. These results suggest that their dual inhibition can be an important therapeutic strategy in colon cancer. We also treated Caco‐2 and HT‐29 with EGF to evaluate whether or not the natural ligand competes with binding of cetuximab or trastuzumab to the receptor target. The present study also determined action of the two agents (cetuximab and trastuzumab) on EGFR and HER‐2 gene expression and the cell cycle, and evaluated induction of apoptosis. Finally, we also assessed whether gene copy number of EGFR and HER‐2 affected action of cetuximab, trastuzumab and EGF.
Materials and methods
Cell lines and cell culture reagents
All materials and media for cell culture were bought from Invitrogen (Carlsbad, CA, USA) unless otherwise specified. Caco‐2, HT‐29 and HCT‐116 human colon cancer cell lines were obtained from the American Type Culture Collection. Caco‐2 and HT‐29 cells were routinely maintained in Dulbecco's modified Eagle's medium (DMEM), and HCT‐116 in McCoy's 5A medium. Both media were supplemented with 10% (v/v) foetal bovine serum (FBS), 50 μg/ml penicillin and 100 μg/ml streptomycin. Cells were cultured at 37 °C in a humidified 5% CO2 atmosphere.
Cell growth inhibition assay
Suspensions were plated at 4 × 10³ (Caco‐2), 2.5 × 10³ (HT‐29) and 1.5 × 10³ (HCT‐116) cells per well, in 96‐well plates, in media containing 10, 20 or 40 μg/ml of cetuximab (5 mg/ml, C225; Erbitux®; kindly provided by Merck Inc., Milan, Italy) and/or trastuzumab (150 mg, 4D5, Herceptin®; Roche Inc., Monza, Italy) for 24 and 48 h at 37 °C. Alternatively, identical concentrations of each drug were added to cell monolayers in 96‐well plates containing DMEM supplemented with 1% FBS; cells were maintained for 24 or 48 h. Six wells were assigned to each experimental treatment.
In further experiments, 10 ng/ml EGF (Invitrogen), alone or in association with the drugs, was added to cell suspensions, or to cells previously plated in 96‐well plates. Control cells were exposed to equivalent volumes of delivery vehicle, DMSO, to provide medium concentration of 0.2% DMSO.
Cell viability/proliferation was evaluated by 3‐(4,5‐dimethylthiazol‐2‐yl)‐2,5‐diphenyltetrazoliumbromide (MTT; Sigma‐Aldrich Inc, St. Louis, MO, USA) assay, as previously described 29. Briefly, after drug exposure, 10 μl 5 mg/ml MTT solution was added to each well and the reaction was allowed to proceed for 3–4 h at 37 °C. Culture medium was then removed and precipitated formazan crystals were dissolved by adding DMSO (200 μl). Absorbance of each well was read at 570 nm and directly correlated to number of remaining viable cells. Absorbance data were normalized to percentage of vehicle‐treated control, then graphed.
NCI expression Mean ODtest − Mean ODtzero, where ODtzero was optical density at time 0 (T0) and ODtest was optical density after 48 h treatment, was used to measure effects of the two drugs (40 μg/ml each) on the cell lines. Values greater than zero indicated growth inhibition effect, less than zero – a cytotoxic effect.
Measured result (percentage of growth, PG) of the combination of two compounds on each cell line was then calculated according to the following expressions: PG = 100 × (Mean ODtest − Mean ODtzero)/(Mean ODCtrl − Mean ODtzero) or PG = 100 × (Mean ODtest − Mean ODtzero)/Mean ODtzero, where ODtest = optical density after 48 h of treatment; ODtzero = optical density at time 0 (that is, optical density at time compounds were added); Mean ODCtrl = optical density after 48 h exposure to 0.2% DMSO.
Flow cytometry for annexin V staining and cell‐cycle analysis
Caco‐2 and HT‐29 cell suspensions were plated at 1 × 10⁶ cells per dish in 100 mm Petri dishes in media containing 40 μg/ml of cetuximab and trastuzumab, for 24 and 48 h, at 37 °C. Apoptosis was analysed using an Annexin V–FITC Apoptosis Detection kit (Sigma‐Aldrich Inc). Briefly, cells were harvested with trypsin and washed in phosphate buffered saline (PBS). They were then resuspended in 1× binding buffer at 1 × 10⁶ cells/ml. Next, 5 μl annexin V–FITC conjugate and 10 μl propidium iodide solution were added to each cell suspension and cells were incubated at room temperature for 10 min in the dark. Cell fluorescence was determined immediately using an Epics Elite XL‐MCL FACScan flow cytometer (Bekman‐Coulter s.r.l., Cassina De' Pecchi, Milan, Italy) and data were analysed with the aid of Expo32 software. Percentage apoptosis was percentage of annexin V‐positive, propidium iodide‐negative cells, of all propidium iodide‐negative cells counted. For cell cycle distribution analysis, cells were cultured in cetuximab and trastuzumab for the indicated time periods, then harvested by trypsinization. One million cells were resuspended in PBS and fixed in 70% ethanol; they were then kept in ethanol for at least 2 h at 4 °C before being centrifuged. Cell pellets were stained for DNA by washing and suspending them in 1 ml PI staining solution, containing 0.1% (v/v) Triton X‐100, 10 μg/ml PI (Sigma‐Aldrich Inc) and 100 μg/mL DNase‐free RNase A (Sigma‐Aldrich Inc) in PBS. Samples were retained in the dark at room temperature for 30 min then transferred to the flow cytometer to measure cell fluorescence. Data were analysed using the approved program.
RNA isolation and cDNA synthesis
Caco‐2 and HT‐29 cell suspensions in DMEM supplemented with 1% FBS were plated with 40 μg/ml cetuximab and trastuzumab in 6‐well plates for 6, 24 and 48 h. Control cells received appropriate DMSO concentrations for the same time periods. RNA was isolated using RNeasy Mini kit (Qiagen S.p.A., Milan, Italy), according to the manufacturer's instructions. Briefly, cells were lysed in the presence of highly denaturing guanidine thiocyanate‐containing buffer. Ethanol was added and samples were applied to a spin column. High‐quality RNA was then eluted in 30 μl water. Total RNA was quantified using a NanoDrop 1000 Spectrophotometer (Thermo Scientific, Wilmington, DE, USA) and cDNA was synthesized from 2 μg total RNA from each sample, using random hexamers and 50 U/μl SuperScript II reverse transcriptase (Invitrogen).
Quantitative real‐time RT‐PCR
Quantitative real‐time RT‐PCR (qRT‐PCR) experiments were performed with the StepOne Real‐Time PCR System (Applied Biosystems, Foster City, CA, USA). For EGFR and HER‐2 mRNA quantification, two pairs of sequence specific oligonucleotides were designed using Oligo Perfect™ Designer software (Invitrogen) based on the sequence of human EGFR variant‐1 (accession number: NM_005228.3) and HER‐2 variant‐1 (accession number: NM_004448.2).
For EGFR variant‐1, the following primers were used:
Fw primer 5′‐GGG AGT TGA TGA CCT TTG GA‐3′
Rv primer 5′‐TGC ACT CAG AGA GCT CAG GA‐3′
For HER‐2 variant‐1, the following primers were used:
Fw primer 5′‐CGA GAG GTG AGG GCA GTT AC‐3′
Rv primer 5′‐AGC AGA GGT GGG TGT TAT GG‐3′
Differences between samples in initial amount of total RNA were normalized in each assay using glyceraldehyde‐3‐phosphate dehydrogenase (GAPDH) housekeeping gene expression as internal standard.
For GAPDH, the following primers were used:
Fw primer 5′‐TCAAGAAGGTGGTGAAGCAG‐3′
Rv primer 5′‐TCTTACTCCTTGGAGGCCAT‐3′
Each PCR reaction was carried out in 25 μl final volume using SYBR Green PCR Master Mix (Applied Biosystems) and 1 μm of primers. Finally, 1 μl diluted cDNA (50 ng/μl) was added for each reaction. Each sample was loaded in triplicate. Standard conditions were used for PCR amplification (50 °C for 2 min, 95 °C for 10 min, followed by 40 cycles at 95 °C for 15 s, 60 °C for 1 min). As a negative control, we performed reactions without cDNA (no template control, NTC). All reactions were performed in triplicate and a standard curve was included for assay validation for each pair of primers. Relative abundance mRNA of the gene of interest was deduced from the cycle number at which fluorescence increased above background level (Ct) in the exponential phase of the PCR reaction.
Protein extraction, immunoprecipitation and western blot analysis
Total cell proteins were extracted from serum‐starved cells, plated with 40 μg/ml cetuximab and trastuzumab in 100 mm Petri dishes for 48 h, as previously described 30. Protein concentrations were adjusted to the same concentration and volume led to 1 ml with ice‐cold lysis buffer, 1:1000 diluted anti‐EGFR (Santa Cruz Biotech, Santa Cruz, CA, USA) antibody was successively added, and samples were incubated on a rotator overnight at 4 °C. Anti‐EGFR was precipitated by addition of 50 μl 50% protein A/G‐sepharose (GE Healthcare Bio‐Sciences AB, Uppsala, Sweden) bead suspension for 2 h at 4 °C. Beads were washed 4 times in ice‐cold lysis buffer, supernatant was removed and stored for the following immunoprecipitations. Then 20 μl 1× protein sample buffer was added per sample. Anti‐HER‐2 (Santa Cruz Biotech) was added to supernatants to repeat the whole procedure, which was performed once more with the new supernatants obtained, to which anti‐P‐EGFR (BD Transduction Laboratories, Franklin Lakes, NJ, USA) or anti‐P‐HER‐2 (Cell Signaling, Inc., Danvers, MA, USA) antibodies were added. All samples were boiled for 5 min and centrifuged at 12879 g for 1 min to precipitate the beads; proteins were separated in acrylamide gels, electrotransferred to nitrocellulose blots (GE Healthcare Bio‐Sciences AB), as previously described 30, and incubated with the same antibodies used for immunoprecipitations.
FISH analysis
Dual colour FISH was performed using Histology FISH Accessory kit and EGFR/CEN‐7 FISH Probe Mix or HER‐2 FISH pharmDx kit (Dako Italia S.p.A., Milano, Italy), according to the manufacturer's instructions. Briefly, 2 × 10⁵ cells in PBS were placed on slides and air‐dried for 24 h, beore being dehydrated in ascending‐grade alcohols. Probe mixture was dropped on to the slides, denatured for 5 min at 82 °C and hybridized overnight at 45 °C. Slides were then washed in saline–sodium citrate buffer at 65 °C, dehydrated in ascending‐grade alcohols, air‐dried and mounted in DAPI‐containing fluorescence mounting medium. Evaluation was performed using a fluorescence microscope, scoring 60 non‐overlapping interphase nuclei. EGFR or HER‐2 were visualized as red signals, using a tetramethylrhodamine isothiocyanate filter, while chromosome 7 α‐centromeres (CEN‐7) or chromosome 17 α‐centromeres (CEN‐17) appeared as green signals using a fluorescein isothiocyanate filter; nuclei provided a blue signal using a DAPI filter. Ratio of total number of EGFR or HER‐2 signals to total number of CEN‐7 or CEN‐17 signals was calculated for each cell line. Ratio of 2 or greater was recorded as positive for EGFR or HER‐2 gene amplification. Cells in which both EGFR/HER‐2 and CEN‐7/CEN‐17 were equally elevated (more than two signals per nucleus) were regarded as aneuploid.
Statistical analysis
Statistical analyses were performed using ANOVA program for one‐way analysis of variance, to examine differences between treatment conditions and controls. All results are expressed as mean ± SEM. Results were analysed using Fisher's exact test, and P < 0.05 were accepted as statistically significant.
Results
Non‐cytotoxic inhibition of cell proliferation induced by cetuximab and trastuzumab combination
To evaluate roles of EGFR and HER‐2 receptors on Caco‐2, HT‐29 and HCT‐116 cell viability, cells were incubated with mAbs cetuximab and trastuzumab, specific to EGFR and HER‐2 respectively. Antibodies were added after plating cells or while they were transiently suspended before plating. Concentrations, alone or in combination experiments, were 10, 20 and 40 μg/μl. Growth inhibition of Caco‐2 and HT‐29 cells was observed after 48 h exposure to combinations with 40 μg/μl of each drug, but only in experiments in which the drugs had been added to cell suspensions. Single antibody administration under the same conditions had no effect on cell proliferation (Fig. 1). As no effect was observed on HCT‐116 cell proliferation, only Caco‐2 and HT‐29 cells were used for the following experiments.
Figure 1.
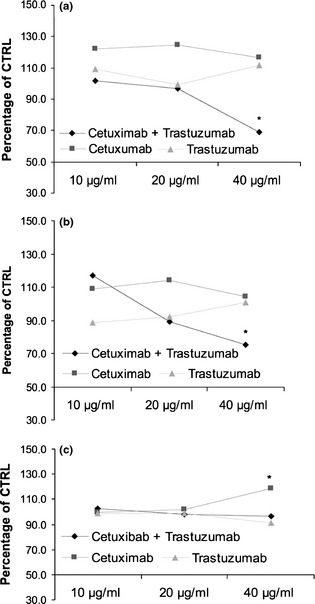
Effect of cetuximab and trastuzumab, alone or in combination, on Caco‐2 (a), HT‐29 (b) and HCT‐116 (c) cell population growth after 48 h treatment. Results expressed as percentage of control with 100% representing control cells treated with DMSO alone.
To assess whether cetuximab and trastuzumab inhibition of cancer cell proliferation was a cytostatic or cytotoxic effect, a separate set of proliferation studies was carried out on Caco‐2 and HT‐29 cell lines. After 48 h exposure to the drug combination, effect of compounds on the two cell lines was calculated according to NCI guidelines. Growth inhibitory effect was 49.4% for Caco‐2 cells and 31.7% for HT‐29 cells. That is, inhibition of cell growth induced by cetuximab and trastuzumab did not fall below the initial cell density at the time of compound addition (T0), suggesting that the two drugs inhibited cell proliferation.
To assess the effect of natural ligand on tumour cell growth, we used EGF alone or in association with cetuximab and trastuzumab. Addition of exogenous 10 nm EGF to Caco‐2 or HT‐29, either plated or transiently in suspension, stimulated proliferation of HT‐29 cells but did not affect proliferation of Caco‐2 cells, probably due to presence of optimum levels of growth factors by autocrine activity. As expected, growth inhibitory effect mediated by the two antibodies was not reversed when EGF was co‐administered with them on either of the two cell lines (Fig. 2).
Figure 2.
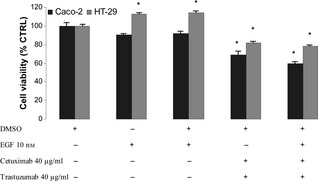
Effect of EGF , cetuximab and trastuzumab on population growth of HT ‐29 and Caco‐2 cells after 48 h treatment. Results expressed as percentage of control with 100% representing control cells treated with DMSO alone. Vertical bars ± SE of triplicate assays. *P < 0.05 versus control values of cells treated with DMSO alone (one‐way ANOVA followed by Student's t‐test).
Effects of cetuximab and trastuzumab on apoptosis and the cell cycle
To confirm that cetuximab and trastuzumab had a cytostatic effect on Caco‐2 and HT‐29, we treated them for 48 h with the tested agents at concentrations with maximum inhibitory effect on cell proliferation, as previously described. Apoptosis was then evaluated using the annexin V binding assay. No significant increases in apoptosis were seen when cells were plated with the drug combination, compared to DMSO‐only control cells (Fig. 3).
Figure 3.
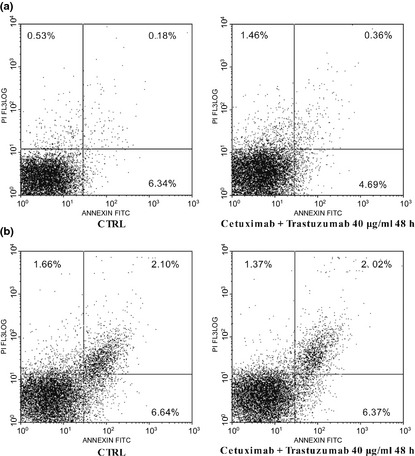
Annexin V and PI double staining for apoptosis of Caco‐2 (a) and HT ‐29 (b) cells. Early apoptotic cells defined as annexin V‐positive, PI‐negative cells.
To determine whether population growth inhibition observed in the cells was associated with specific changes in cell cycle distribution, cell cycle analysis was performed using DNA flow cytometry. For both Caco‐2 and HT‐29, two cell subpopulations were present with the following percentages: 55% Caco‐2 cells were tetraploid and 45% were diploid; 93.86% HT‐29 were diploid and 6.14% were aneuploid. Treatment of cells for 48 h with 40 μg/ml cetuximab and trastuzumab did not change this percentage in Caco‐2 cells, while aneuploid subpopulation of HT‐29 cells increased to 30% (Fig 4). Flow cytometric analysis demonstrated that reduced cell proliferation was associated with increase in G1 cell population in both Caco‐2 cell subpopulations (49% versus 64% for tetraploid cells, 46% versus 68% for diploid cells) and HT‐29 diploid cells (59% versus 70.5% for diploid cells). In addition, aneuploid HT‐29 cells accumulated in the G1 phase, which changed to 68%. These results were associated with concomitant reduction of Caco‐2 cells in S phase. This effect was marked in aneuploid HT‐29 cells, we observed no change in the diploid subpopulation. G2–M phase was influenced by treatment only in HT‐29 cell subpopulations: both agents reduced diploid cells in this phase to near zero (16% versus 0.5%) and induced it in aneuploid cells (0% versus 6%).
Figure 4.
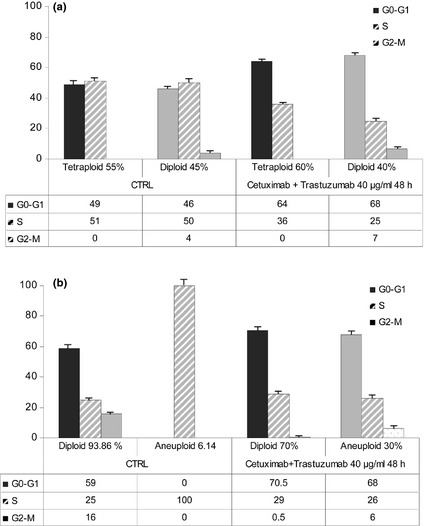
Effect of cetuximab and trastuzumab on cell cycle phase distribution in Caco‐2 (a) and HT ‐29 (b) cells exposed to cetuximab and trastuzumab. Columns represent median values of three samples.
Influence of cetuximab and trastuzumab on EGFR and HER‐2 mRNA and protein levels
Messenger RNA levels of EGFR and HER‐2 were assessed by quantitative RT‐PCR in Caco‐2 and HT‐29 cells under basal conditions and 6, 24 and 48 h after treatment with the tested agents. HT‐29 cells expressed more EGFR and HER‐2 mRNAs than Caco‐2 cells, with prevalence of HER‐2 mRNA in both cell lines (data not shown). We observed late increase of both mRNAs in Caco‐2 cells (Fig. 5a), while increases were early and transient in HT‐29 cells, in which HER‐2 mRNA decreased to below control mRNA level after 48 h (Fig. 5b).
Figure 5.
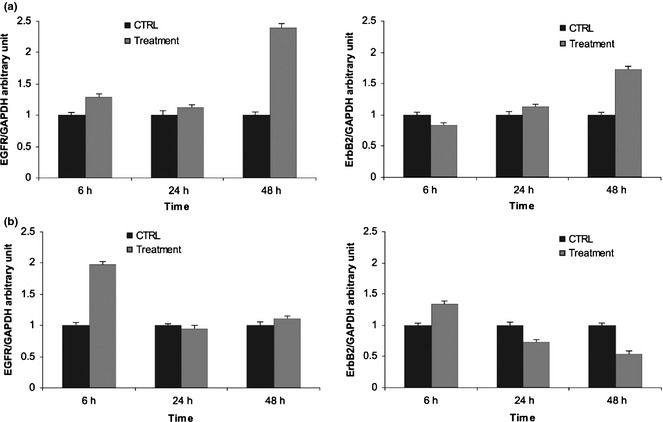
Effect of cetuximab and trastuzumab on EGFR and HER ‐2 mRNA levels. (a) Caco‐2 cells; (b) HT‐29 cells. Results expressed as relative expression, normalized to control cells treated with DMSO. All reactions were performed in triplicate.
EGFR and HER‐2 proteins were analysed by western blotting to evaluate whether they were overexpressed and activated in Caco‐2 and HT‐29 cells after 48 h treatment. EGFR and p‐EGFR proteins were increased slightly in Caco‐2 cells compared to their levels in vehicle‐treated control (0.36‐fold and 0.11‐fold respectively), while we observed 0.28‐fold decrease in HER‐2 protein levels in the same cell line. Phospho‐HER‐2 protein was not modified by combined treatment (Fig. 6a). In HT‐29 cells, EGFR protein was 0.42‐fold higher, while p‐EGFR proteins were 0.34‐fold lower. There were no major differences in expression levels of HER‐2 and p‐HER‐2 proteins between treated and untreated cells (Fig. 6b).
Figure 6.
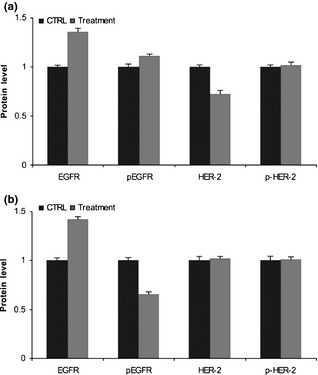
Effect of cetuximab and trastuzumab on EGFR and HER ‐2 protein levels. (a) Caco‐2 cells; (b) HT‐29 cells. Results expressed as relative expression, normalized to control cells treated with DMSO. All reactions performed in triplicate.
EGFR and HER‐2 gene amplification
Gene amplification status of EGFR and HER‐2 was determined by FISH analysis. Both Caco‐2 and HT‐29 cells were aneuploid for both genes, with equally higher EGFR and CEN‐7 signals, as well as HER‐2 and CEN‐17 signals, indicating polysomy (increased gene copy number) without amplification (Figs 7,8).
Figure 7.
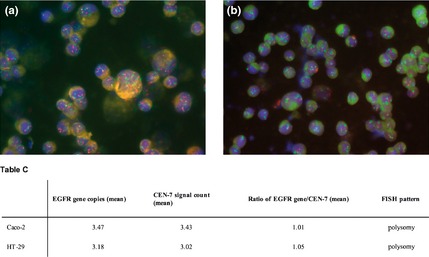
Dual colour FISH assay for probes of EGFR (red) and chromosome 7 α‐centromeric ( CEN ‐7, green) for Caco‐2 (a) and HT ‐29 cells (b). Table C, EGFR gene copy number values obtained by FISH analysis have been reported.
Figure 8.
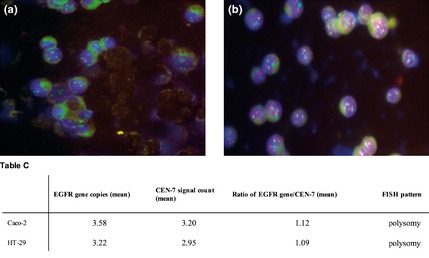
Dual colour FISH assay for probes of HER ‐2 (red) and chromosome 17 α‐centromeric ( CEN ‐17, green) for Caco‐2 (a) and HT ‐29 cells (b). Table C, EGFR gene copy number values obtained by FISH analysis have been reported.
Discussion
Growth factors regulate cell proliferation and cell homoeostasis by binding to specific membrane receptors. EGFR and HER‐2 are two EGF receptors overexpressed in a variety of cancers and are commonly implicated in biology of human epithelial malignancies 9, 31, 32. Because of the role of the EGFR signalling pathway in progression of colorectal cancer, therapeutic use of agents that block the EGFR signal transduction pathway or induce EGFR downregulation has been considered 33. However, administration of EGFR mAbs or EGFR tyrosine kinase inhibitors (TKIs) to patients previously not responding to standard therapy, have generated at best a 10% response rate, despite the fact that in 80% of colon cancer pathogenesis potentially implicates EGFR 34, 35. This limited efficacy could be due to unblocked ErbB2 signalling in the form of EGFR/ErbB2 or ErbB2/ErbB3 heterodimers when EGFR, ErbB2 and ErbB3 are co‐expressed in the tumour cells 36. For example, it has recently been shown that AG1478 (an EGFR TKI) failed to induce apoptosis at concentrations sufficient to inhibit EGFR activation in an aggressive human colon carcinoma cell line harbouring constitutive expression of TGFα. On the contrary, synergistic inhibition of cell proliferation and induction of apoptosis were observed when AG1478 was administrated in combination with AG879, an HER‐2 TKI. This indicates that resistance to EGFR TKI could be overcome by a combination approach with HER‐2 TKI 37.
In the light of these data, we treated Caco‐2, HT‐29 and HCT‐116 colon cancer cell lines with a combination of antibodies directed against EGF receptors. Following ligand binding, EGFR stimulates downstream cell signalling cascades that influence cell proliferation, apoptosis, migration, survival, angiogenesis and tumourigenesis 7. Blocking these processes can influence progression of tumours. We decided to combine cetuximab, directed against EGFR, and trastuzumab, directed against HER‐2, as both receptors dimerize in response to ligand binding in most normal and malignant human cells. Co‐administration of inhibitors targeting multiple members of the EGF receptor family may provide greater therapeutic benefit.
In this study, we demonstrated that the combination response was cell‐line dependent as we found differences in response of the three cell lines to the treatment, HCT‐116 cells not responding at all. Moreover, targeting only one receptor at a time with a specific blocking antibody in each cell line failed to block cell proliferation. We did not observe inhibition of proliferation even when treatment with a single agent was prolonged to 96 h. Kuwada et al. under their conditions, found an anti‐proliferative effect of cetuximab alone, which was however potentiated by co‐treatment with trastuzumab 13.
Interestingly, administration of the two drugs to cells after plating them also failed to block their proliferation. This can be explained considering localization of EGFR and HER‐2 receptors. It has been previously reported that they are predominantly localized on basolateral membranes of colonic epithelial cells 38, and the Caco‐2 cell line is known to form polarized monolayers 39, 40. We do not have any data concerning localization of EGF receptors on HT‐29 or HCT‐116 cells, but suppose the same basolateral localization. For this reason it is possible that on our cells, receptors were inaccessible to the antibodies when the cells were cultured on plastic in confluent monolayers, while addition of drugs to cells while transiently in suspension before plating, induced inhibition of cell proliferation. In addition, we did not observe any effect on HCT‐116 cells which might be explained by these cells carrying a KRAS mutation; it has been reported that mutations which constitutively activate key signalling mediators downstream of EGFR, particularly K‐Ras/BRAF and PTEN/PIK3CA, induce resistance to cetuximab 41.
Addition of exogenous EGF did not increase Caco‐2 cell proliferation, in contrast to a report by Solmi et al. who, on the contrary, described significant reduction in Caco‐2 cell viability 42. We can explain our results considering presence of optimum levels of autocrine growth factors in Caco‐2 cells, as has already been considered by Bishop and Wen 43. Amphiregulin (AR) is the most abundant EGFR ligand expressed in Caco‐2 cells 39. It is a likely candidate due to its abundant expression at, as well as localization to, and release from, basolateral surfaces, which would allow direct access to EGFRs, whose basolateral expression has been well documentated 38. In contrast, expression of TGF‐α or EGF was not detected by northern blot analysis. Furthermore, TGF‐α protein has not been detected in conditioned medium or cell lysate using sensitive and specific TGF‐α radioimmunoassay 44. However, TGF‐α mRNA has been detected by RT‐RCR 38, agreeing with the results of Bishop and Wen 43. It has also been reported that AR mRNA expression is more uniformly increased in human colon carcinomas than adjacent normal mucosa compared to relative TGF‐α expression in colon cancers and normal tissues 45. AR acts as an autocrine growth factor for one human colon carcinoma cell line (Geo) cultured as a monolayer on plastic. Its removal from conditioned medium by AR antibody immunoprecipitation has resulted in 40% reduction in cell proliferation 46. In the same way, HT‐29 cells produce colorectum cell‐derived growth factor (CRDGF), a protein homologous to AR. CRDGF inhibits binding of EGF to its receptors and, like EGF and TGF‐α, stimulates phosphorylation of EGFR on tyrosine residues 47. Then again, other authors have used fluorescence resonance energy transfer (FRET)‐based methods to measure autonomous phosphorylation of HT‐29 and Caco‐2, finding that HT‐29 showed FRET efficiencies over 50% and Caco‐2 close to 30% 48.
Cetuximab and trastuzumab had lower efficacy on HT‐29 cells than Caco‐2 cells, with growth inhibition of 31% in the former and 49% in the latter. It is well known that colorectal adenocarcinomas are characterized by numerical and/or structural chromosome aberrations 49, 50. Moreover, chromosome copy number heterogeneity and aneuploidy in tumour cell lines have been reported 51. Our data derived from cell cycle analysis confirmed this heterogeneity in Caco‐2 and HT‐29 cells and are useful to explain cell response to the drug combination. In particular, increase in aneuploid population in HT‐29 (up to 30%) could cause resistance of these cells to treatment. Even if the combination induces increase in G0–G1 phase percentage in both sub‐populations, the same combination determines appearance of a percentage of aneuploid cells in G2–M phase. Thus, it is possible that in HT‐29 cells, there is an aneuploid population which is more resistant or non‐responsive to treatment; cells proliferate in spite of administration of cetuximab and trastuzumab, making the global anti‐proliferative effect no more than slight.
To explain the pharmacological response of cells (growth inhibitory effect equal to 49.4% for Caco‐2 and 31.7% for HT‐29) to cetuximab and trastuzumab in combination, we also analysed levels of EGFR and HER‐2 mRNAs. Interestingly, we found different results between the two cell lines. Caco‐2 cells we observed to have a significant increase in mRNA levels, more than doubled in the case of EGFR. This can be explained considering mechanism of action of cetuximab, a monoclonal antibody which interacts specifically and exclusively with domain III of the soluble extracellular region of EGFR, partially occluding ligand binding region on this domain, sterically preventing the receptor from adopting the extended conformation required for dimerization and inducing antibody‐receptor internalization and degradation 52, 53, 54. We hypothesize that this downregulation of cell surface receptors could be responsible for increase in EGFR mRNA levels we observed after 48 h treatment, to express new EGFR mRNA to replace degraded receptors. Increase in EGFR mRNA after 48 h treatment corresponds to a slight increase in EGFR protein, indicating that this time period was enough to transcribe new mRNA, but that translation to new protein was just beginning. This was confirmed by low levels of activated form (p‐EGFR), which could be due to stabilization of remaining protein induced by binding of antibody to the extracellular domain of the receptor 23.
Cbl, a mammalian gene encoding several proteins including E3 ubiquitin‐protein ligase, is involved in cell signalling and protein ubiquitination. After ubiquitination, many proteins, including EGFR, are targeted for lysosomal degradation 55, 56. Recent studies have shown that HER‐2 receptor downregulation induced by trastuzumab also involves recruitment of Cbl proteins and subsequent ubiquitination 57, 58. In this way, we can explain the compensatory increase also in HER‐2 mRNA levels observed in Caco‐2 cells after 48 h treatment. Because increase in HER‐2 mRNA was lower than increase in EGFR mRNA, it is possible that it started later and slowly and that, after 48 h, there was not any synthesis or phosphorylation of new HER‐2 protein.
With regard to HT‐29 cells, we have shown that they exhibited some resistance to treatment. This result can be explained considering that they are wild type (WT) for KRAS, as are Caco‐2 cells, but carry a BRAF V600E mutation, which has been inversely associated with response to therapy (resistance to cetuximab) 59. Separation of colon cancer cell lines according to Ras/BRAF mutation status explains a tendency for Ras/BRAF WT cell lines to be more sensitive to cetuximab compared to Ras/BRAF mutant lines 41.
We have shown that HT‐29 cells expressed more EGFR and HER‐2 mRNAs than Caco‐2 cells under basal conditions. Upon ligand binding, EGFR is internalized and trafficked to endosomes for recycling to the cell surface or degradation in lysosomes 60. Cetuximab and trastuzumab induce receptor internalization and degradation 52, 53, 56, 57. In our model, the resulting increase in mRNA levels after 6 h treatment could be explained through the immediate loss of receptors on the cell surface after treatment. On the other hand, it has been reported that combinations of antibodies directed against EGFR domain III induce receptor downregulation of up to 80% with half‐life of 0.5–5 h 22. Prolonged treatment for 24 and 48 h with the same drugs again induces receptor internalization and degradation, so after 48 h we observed EGFR mRNA return to normal and HER‐2 mRNA had reduced by half. The state of mRNAs we observed was responsible for expression of corresponding proteins after combined treatment. After 48 h, new EGFR protein had been synthesized, deriving from increased mRNA level after 6 h, no activated form being already present. The status of HER‐2 mRNA was similar to that of EGFR mRNA, but was less accentuated; increase in HER‐2 expression was absent and there was no activation of its protein after 48 h treatment.
Finally, differences in sensitivity to cetuximab and trastuzumab between the two cell lines expressing wild‐type EGFR and HER‐2 in this study was not due to differences in gene copy number, given that we found identical increases in EGFR and HER‐2 copy numbers in both cell lines.
In conclusion, there is pressing need to elucidate molecular mechanisms involved in activity of the cetuximab and trastuzumab combination to understand and improve its pharmacological efficacy. In this article, we demonstrated that it participated in inhibition of tumour cell population growth by different pathways. These observations may have important clinical implications for development of new therapeutic strategies based on the combination of antibodies directed against EGFR and HER‐2.
Conflict of interests
The authors declare that they have no competing interests.
Acknowledgements
We thank Prof. Agata Copani for her invaluable suggestions and excellent assistance with management of cytofluorimetric cell cycle data. We are grateful to the Istituto di Ricerca Medica e Ambientale (I.R.M.A.) and to its Director Dott. Giovanni Tringali for the use of the FACScan flow cytometer. Our grateful thanks to the Laboratory of Histo‐Cyto‐Pathology for the preparation of the histological specimens.
References
- 1. Labianca R, Beretta GD, Kildani B, Milesi L, Merlin F, Mosconi S et al (2010) Colon cancer. Crit. Rev. Oncol. Hematol. 74, 106–133. [DOI] [PubMed] [Google Scholar]
- 2. Berrino F, De Angelis R, Sant M, Rosso S, Bielska‐Lasota M, Coebergh JW et al (2007) EUROCARE Working group: survival for eight major cancers and all cancers combined for European adults diagnosed in 1995–99: results of the EUROCARE‐4 study. Lancet Oncol. 8, 773–783. [DOI] [PubMed] [Google Scholar]
- 3. Coleman MP, Gatta G, Verdecchia A, Estève J, Sant M, Storm H et al; EUROCARE Working Group (2003) EUROCARE‐3 summary cancer survival in Europe at the end of the 20th century. Ann. Oncol. 14(Suppl 5), v128–v149. [DOI] [PubMed] [Google Scholar]
- 4. Gullick WJ (2001) The Type 1 growth factor receptors and their ligands considered as a complex system. Endocr. Relat. Cancer 8, 75–82. [DOI] [PubMed] [Google Scholar]
- 5. Gullick WJ (2009) The epidermal growth factor system of ligands and receptors in cancer. Eur. J. Cancer 45(Suppl 1), 205–210. [DOI] [PubMed] [Google Scholar]
- 6. Marmor MD, Skaria KB, Yarden Y (2004) Signal transduction and oncogenesis by ErbB/HER receptors. Int. J. Radiat. Oncol. Biol. Phys. 58, 903–913. [DOI] [PubMed] [Google Scholar]
- 7. Lurje G, Lenz HJ (2009) EGFR signaling and drug discovery. Oncology 77, 400–410. [DOI] [PubMed] [Google Scholar]
- 8. Baselga J (2002) Why the epidermal growth factor receptor? The rationale for cancer therapy. Oncologist 7(Suppl 4), 2–8. [DOI] [PubMed] [Google Scholar]
- 9. Hubbard SR (2005) EGF receptor inhibition: attacks on multiple fronts. Cancer Cell 7, 287–288. [DOI] [PubMed] [Google Scholar]
- 10. Wong SF (2005) Cetuximab: an epidermal growth factor receptor monoclonal antibody for the treatment of colorectal cancer. Clin. Ther. 27, 684–694. [DOI] [PubMed] [Google Scholar]
- 11. Scaltriti M, Baselga J (2006) The epidermal growth factor receptor pathway: a model for targeted therapy. Clin. Cancer Res. 12, 5268–5272. [DOI] [PubMed] [Google Scholar]
- 12. Ross JS, Fletcher JA (1998) The HER‐2/neu oncogene in breast cancer: prognostic factor, predictive factor, and target for therapy. Oncologist 3, 237–252. [PubMed] [Google Scholar]
- 13. Kuwada SK, Scaife CL, Kuang J, Li X, Wong RF, Florell SR et al (2004) Effects of trastuzumab on epidermal growth factor receptor‐dependent and‐independent human colon cancer cells. Int. J. Cancer 109, 291–301. [DOI] [PubMed] [Google Scholar]
- 14. Ross JS, McKenna BJ (2001) The HER‐2/neu oncogene in tumors of the gastrointestinal tract. Cancer Invest. 19, 554–568. [DOI] [PubMed] [Google Scholar]
- 15. Ismail HM, El‐Baradie M, Moneer M, Khorshid O, Touny A (2007) Clinico‐pathological and prognostic significance of p53, Bcl‐2 and Her‐2/neu protein markers in colorectal cancer using tissue microarray. J. Egypt. Natl. Canc. Inst. 19, 3–14. [PubMed] [Google Scholar]
- 16. Gill MK, Manjari M, Jain K, Kaur T (2011) Expression of Her‐2/neu in colon carcinoma and its correlation with the histological grades and the lymph nodes status. JCDR 5, 1564–1568. [Google Scholar]
- 17. Kulig J, Kolodziejczyk P, Kulig P, Legutko J (2013) Targeted therapy for gastric cancer – current status. J. Oncol. Pharm. Pract. 19, 75–81. [DOI] [PubMed] [Google Scholar]
- 18. Nathanson DR, Culliford AT 4th, Shia J, Chen B, D'Alessio M, Zeng ZS et al (2003) HER 2/neu expression and gene amplification in colon cancer. Int. J. Cancer 105, 796–702. [DOI] [PubMed] [Google Scholar]
- 19. Mann M, Sheng H, Shao J, Williams CS, Pisacane PI, Sliwkowski MX et al (2001) Targeting cyclooxygenase 2 and HER‐2/neu pathways inhibits colorectal carcinoma growth. Gastroenterology 120, 1713–1719. [DOI] [PubMed] [Google Scholar]
- 20. Cunningham D, Humblet Y, Siena S, Khayat D, Bleiberg H, Santoro A et al (2004) Cetuximab monotherapy and cetuximab plus irinotecan in irinotecan‐refractory metastatic colorectal cancer. N. Engl. J. Med. 351, 337–345. [DOI] [PubMed] [Google Scholar]
- 21. Martinelli E, De Palma R, Orditura M, De Vita F, Ciardiello F (2009) Anti‐epidermal growth factor receptor monoclonal antibodies in cancer therapy. Clin. Exp. Immunol. 158, 1–9. [DOI] [PMC free article] [PubMed] [Google Scholar]
- 22. Spangler JB, Neil JR, Abramovitch S, Yarden Y, White FM, Lauffenburger DA et al (2010) Combination antibody treatment down‐regulates epidermal growth factor receptor by inhibiting endosomal recycling. Proc. Natl. Acad. Sci. USA 107, 13252–13257. [DOI] [PMC free article] [PubMed] [Google Scholar]
- 23. Giannopoulou E, Antonacopoulou A, Floratou K, Papavassiliou AG, Kalofonos HP (2009) Dual targeting of EGFR and HER‐2 in colon cancer cell lines. Cancer Chemother. Pharmacol. 63, 973–981. [DOI] [PubMed] [Google Scholar]
- 24. Graus‐Porta D, Beerli RR, Daly JM, Hynes NE (1997) ErbB‐2, the preferred heterodimerization partner of all ErbB receptors, is a mediator of lateral signalling. EMBO J. 16, 1647–1655. [DOI] [PMC free article] [PubMed] [Google Scholar]
- 25. Grunwald V, Hidalgo M (2003) Developing inhibitors of the epidermal growth factor receptor for cancer treatment. J. Natl. Cancer Inst. 95, 4851–4867. [DOI] [PubMed] [Google Scholar]
- 26. Friedman LM, Rinon A, Schechter B, Lyass L, Lavi S, Bacus SS et al (2005) Synergistic down‐regulation of receptor tyrosine kinases by combinations of mAbs: implications for cancer immunotherapy. Proc. Natl. Acad. Sci. USA 102, 1915–1920. [DOI] [PMC free article] [PubMed] [Google Scholar]
- 27. Ben‐Kasus T, Schechter B, Lavi S, Yarden Y, Sela M (2009) Persistent elimination of ErbB‐2/HER2‐overexpressing tumors using combinations of monoclonal antibodies: relevance of receptor endocytosis. Proc. Natl. Acad. Sci. USA 106, 3294–3299. [DOI] [PMC free article] [PubMed] [Google Scholar]
- 28. Fogh J, Fogh JM, Orfeo T (1977) One hundred and twenty‐seven cultured human tumor cell lines producing tumors in nude mice. J. Natl. Cancer Inst. 59, 221–226. [DOI] [PubMed] [Google Scholar]
- 29. Fortuna CG, Barresi V, Bonaccorso C, Consiglio G, Failla S, Trovato‐Salinaro A et al (2012) Design, synthesis and in vitro antitumour activity of new heteroaryl ethylenes. Eur. J. Med. Chem. 47, 221–227. [DOI] [PubMed] [Google Scholar]
- 30. Luca T, Di Benedetto G, Scuderi MR, Palumbo M, Clementi S, Bernardini R et al (2009) The CB1/CB2 receptor agonist WIN‐55,212‐2 reduces viability of human Kaposi's sarcoma cells in vitro. Eur. J. Pharmacol. 616, 16–21. [DOI] [PubMed] [Google Scholar]
- 31. Hynes NE, Lane HA (2005) ERBB receptors and cancer: the complexity of targeted inhibitors. Nat. Rev. Cancer 5, 341–354. [DOI] [PubMed] [Google Scholar]
- 32. Hynes NE, MacDonald G (2009) ErbB receptors and signaling pathways in cancer. Curr. Opin. Cell Biol. 21, 177–184. [DOI] [PubMed] [Google Scholar]
- 33. Normanno N, De Luca A, Bianco C, Strizzi L, Mancino M, Maiello MR et al (2006) Epidermal growth factor receptor (EGFR) signaling in cancer. Gene 366, 2–16. [DOI] [PubMed] [Google Scholar]
- 34. Normanno N, Bianco C, De Luca A, Maiello MR, Salomon DS (2003) Target‐based agents against ErbB receptors and their ligands: a novel approach to cancer treatment. Endocr. Relat. Cancer 10, 1–21. [DOI] [PubMed] [Google Scholar]
- 35. Black JD, Brattain MG, Krishnamurthi SA, Dawson DM, Willson JK (2003) ErbB family targeting. Curr. Opin. Investig. Drugs 4, 1451–1454. [PubMed] [Google Scholar]
- 36. Zhou Y, Li S, Hu YP, Wang J, Hauser J, Conway AN et al (2006) Blockade of EGFR and ErbB2 by the novel dual EGFR and ErbB2 tyrosine kinase inhibitor GW572016 sensitizes human colon carcinoma GEO cells to apoptosis. Cancer Res. 66, 404–411. [DOI] [PubMed] [Google Scholar]
- 37. Zhou Y, Brattain MG (2005) Synergy of epidermal growth factor receptor kinase inhibitor AG1478 and ErbB2 kinase inhibitor AG879 in human colon carcinoma cells is associated with induction of apoptosis. Cancer Res. 65, 5848–5856. [DOI] [PubMed] [Google Scholar]
- 38. Borg JP, Marchetto S, Le Bivic A, Ollendorff V, Jaulin‐Bastard F, Saito H et al (2000) ERBIN: a basolateral PDZ protein that interacts with the mammalian ERBB2/HER2. Nat. Cell Biol. 2, 407–414. [DOI] [PubMed] [Google Scholar]
- 39. Damstrup L, Kuwada SK, Dempsey PJ, Brown CL, Hawkey CJ, Poulsen HS et al (1999) Amphiregulin acts as an autocrine growth factor in two human polarizing colon cancer lines that exhibit domain selective EGF receptor mitogenesis. Br. J. Cancer 80, 1012–1019. [DOI] [PMC free article] [PubMed] [Google Scholar]
- 40. Kuwada SK, Li XF, Damstrup L, Dempsey PJ, Coffey RJ, Wiley HS (1999) The dynamic expression of the epidermal growth factor receptor and epidermal growth factor ligand family in a differentiating intestinal epithelial cell line. Growth Factors 17, 139–153. [DOI] [PubMed] [Google Scholar]
- 41. Jhawer M, Goel S, Wilson AJ, Montagna C, Ling YH, Byun DS et al (2008) PIK3CA mutation/PTEN expression status predicts response of colon cancer cells to the epidermal growth factor receptor inhibitor cetuximab. Cancer Res. 68, 1953–1961. [DOI] [PMC free article] [PubMed] [Google Scholar]
- 42. Solmi R, Lauriola M, Francesconi M, Martini D, Voltattorni M, Ceccarelli C et al (2008) Displayed correlation between gene expression profiles and submicroscopic alterations in response to cetuximab, gefitinib and EGF in human colon cancer cell lines. BMC Cancer 8, 227. [DOI] [PMC free article] [PubMed] [Google Scholar]
- 43. Bishop WP, Wen JT (1994) Regulation of Caco‐2 cell proliferation by basolateral membrane epidermal growth factor receptors. Am. J. Physiol. 267, G892–G900. [DOI] [PubMed] [Google Scholar]
- 44. Halter SA, Dempsey PJ, Matsui Y, Stokes MK, Graves‐Deal R, Hogan BLM et al (1992) Distinctive patterns of hyperplasia in transgenic mice with mouse mammary tumor virus transforming growth factor‐α. Characterization of mammary gland and skin proliferation. Am. J. Pathol. 140, 1131–1146. [PMC free article] [PubMed] [Google Scholar]
- 45. Busser B, Sancey L, Brambilla E, Coll JL, Hurbin A (2011) The multiple roles of amphiregulin in human cancer. Biochim. Biophys. Acta 1816, 119–131. [DOI] [PubMed] [Google Scholar]
- 46. Johnson GR, Saeki T, Gordon AW, Shoyab M, Salomon DS, Stromberg K (1992) Autocrine action of amphiregulin in a colon carcinoma cell line and immunocytochemical localization of amphiregulin in human colon. J. Cell Biol. 118, 741–751. [DOI] [PMC free article] [PubMed] [Google Scholar]
- 47. Culouscou JM, Remacle‐Bonnet M, Carlton GW, Plowman GD, Shoyab M (1992) Colorectum cell‐derived growth factor (CRDGF) is homologous to amphiregulin, a member of the epidermal growth factor family. Growth Factors 7, 195–205. [DOI] [PubMed] [Google Scholar]
- 48. Balin‐Gauthier D, Delord JP, Rochaix P, Mallard V, Thomas F, Hennebelle I et al (2006) In vivo and in vitro antitumor activity of oxaliplatin in combination with cetuximab in human colorectal tumor cell lines expressing different level of EGFR. Cancer Chemother. Pharmacol. 57, 709–718. [DOI] [PubMed] [Google Scholar]
- 49. Grade M, Becker H, Liersch T, Ried T, Ghadimi BM (2006) Molecular cytogenetics: genomic imbalances in colorectal cancer and their clinical impact. Cell Oncol. 28, 71–84. [DOI] [PMC free article] [PubMed] [Google Scholar]
- 50. Castorina S, Barresi V, Luca T, Privitera G, Musso N, Capizzi C et al (2010) Recent advances in molecular diagnostics of colorectal cancer by genomic arrays: proposal for a procedural shift in biological sampling and pathological report. Ital. J. Anat. Embryol. 115, 39–45. [PubMed] [Google Scholar]
- 51. Knutsen T, Padilla‐Nash HM, Wangsa D, Barenboim‐Stapleton L, Camps J, McNeil N et al (2010) Definitive molecular cytogenetic characterization of 15 colorectal cancer cell lines. Genes Chromosom. Cancer 49, 204–223. [DOI] [PMC free article] [PubMed] [Google Scholar]
- 52. Li S, Schmitz KR, Jeffrey PD, Wiltzius JJ, Kussie P, Ferguson KM (2005) Structural basis for inhibition of the epidermal growth factor receptor by cetuximab. Cancer Cell 7, 301–311. [DOI] [PubMed] [Google Scholar]
- 53. Mandic R, Rodgarkia‐Dara CJ, Zhu L, Folz BJ, Bette M, Weihe E et al (2006) Treatment of HNSCC cell lines with the EGFR‐specific inhibitor cetuximab (Erbitux) results in paradox phosphorylation of tyrosine 1173 in the receptor. FEBS Lett. 580, 4793–5000. [DOI] [PubMed] [Google Scholar]
- 54. Vokes EE, Chu E (2006) Anti‐EGFR therapies: clinical experience in colorectal, lung, and head and neck cancers. Oncology (Williston Park) 20(5 Suppl 2), 15–25. [PubMed] [Google Scholar]
- 55. Harding J, Burtness B (2005) Cetuximab: an epidermal growth factor receptor chemeric human‐murine monoclonal antibody. Drugs Today (Barc.) 41, 107–127. [DOI] [PubMed] [Google Scholar]
- 56. Sebastian S, Settleman J, Reshkin SJ, Azzariti A, Bellizzi A, Paradiso A (2006) The complexity of targeting EGFR signalling in cancer: from expression to turnover. Biochim. Biophys. Acta 1766, 120–139. [DOI] [PubMed] [Google Scholar]
- 57. Klapper LN, Waterman H, Sela M, Yarden Y (2000) Tumor‐inhibitory antibodies to HER‐2/ErbB‐2 may act by recruiting c‐Cbl and enhancing ubiquitination of HER‐2. Cancer Res. 60, 3384–3388. [PubMed] [Google Scholar]
- 58. Scaltriti M, Verma C, Guzman M, Jimenez J, Parra JL, Pedersen K et al (2009) Lapatinib, a HER2 tyrosine kinase inhibitor, induces stabilization and accumulation of HER2 and potentiates trastuzumab‐dependent cell cytotoxicity. Oncogene 28, 803–814. [DOI] [PubMed] [Google Scholar]
- 59. Di Nicolantonio F, Martini M, Molinari F, Sartore‐Bianchi A, Arena S, Saletti P et al (2008) Wild‐type BRAF is required for response to panitumumab or cetuximab in metastatic colorectal cancer. J. Clin. Oncol. 26, 5705–5712. [DOI] [PubMed] [Google Scholar]
- 60. Roepstorff K, Grandal MV, Henriksen L, Knudsen SL, Lerdrup M, Grøvdal L et al (2009) Differential effects of EGFR ligands on endocytic sorting of the receptor. Traffic 10, 1115–1127. [DOI] [PMC free article] [PubMed] [Google Scholar]


