

Abstract
Objectives
Acrolein (Acr) is a highly reactive α, β‐unsaturated aldehyde, which can induce reactive oxygen species (ROS) generation. Several factors, including lipid peroxidation, clinical use of cyclophosphamide, fried foods, automobile exhausts, smoking and aging can increase its concentration in blood serum. Mounting evidence has suggested that Acr‐induced ROS might reduce quality of sperm. Thus, the aim of this study was to examine reproductive toxicity of Acr‐caused ROS in vitro and find a means to alleviate it.
Materials and methods
We investigated the effects of Acr on male germ cell (MGC)‐derived GC‐1 cells in vitro. Dihydroethidium and DCFH‐DA fluorescent dyes were used to determine generation of intracellular ROS.
Results
We found that Acr induced ROS generation, which was accompanied by reduced Bcl2/Bax ratio, substantial decline in mitochondrial membrane potential, and further promoted apoptosis of MGCs. Furthermore, Rapamycin was capable of alleviating Acr‐induced ROS, reducing ROS‐induced apoptosis by increasing ratio of Bcl2/Bax mRNA and proteins, and protecting MGC mitochondrial membranes.
Conclusion
Rapamycin inhibited Acr‐induced apoptosis by alleviating ROS‐driven mitochondrial dysfunction in MGCs.
Introduction
Male germ cells (MGCs) are the foundation of spermatogenesis, and their aging and damage can reduce quality of sperm. Many environment factors are able to cause damage to MGCs, among which acrolein (Acr) is important 1, 2. Acr level in serum is possibly increased by a number of factors including lipid peroxidation, clinical use of cyclophosphamide (CP), fried foods, automobile exhausts, aging and smoking 4, 5, 6, 7. It is a strong and highly reactive electrophile and stays as an active form in the body for several days 3. In addition, Acr is also one of the major highly‐toxic metabolites of CP and ifosfamide that are first choice in immunosuppressant and chemotherapeutic agents in China. More importantly, cytochrome P450 3A4 (CYP3A4), the enzyme able to degrade CP to Acr, is expressed highly in mammalian testes. This would generally result in higher concentration of Acr in MGCs of patients treated clinically with CP and ifosfamide 8.
Apoptosis is one of the main mechanisms of germ cell death during normal spermatogenesis. Previous studies have indicated that generation of intracellular reactive oxygen species (ROS) plays an important role in spermatogenesis and reproduction 11, 12. However, Acr disrupts redox balance of tissues, leading to higher intracellular ROS causing testicular toxicity 2, 9, 10. Tissue damage resulting from production of oxygen free radicals, and its oxidation product, has been one of the main causes leading to spermatogenetic disorders 1, 13, 14.
It has been reported that Acr causes higher levels of intracellular ROS for direct reaction with glutathione (GSH), the key factor for intracellular redox balance 18. Indirect depletion of GSH can result in generation of ROS that damages the mitochondrial electron transport chain 19. There has been in vivo evidence showing that Total Antioxidant Capacity, Superoxide Dismutase, Catalase and Glutathione Peroxidase are reduced and ROS was increased in Acr‐treated groups, compared to control groups 1.
In view of the above findings, we thus studied toxicity of Acr in MGC line‐derived GC‐1 spg cells 15, which display specific features of type B spermatogonia or early spermatocytes, and have been used in increasing numbers of studies related to MGCs 16, 17. To analyse underlying mechanisms of reproductive toxicity to MGCs in detail, the present study explored Acr‐induced ROS, and we demonstrate that it affected viability of GC‐1 cells, and caused their apoptosis in vitro. In addition, we further discovered a potential role for rapamycin (Rap) in mediating Acr‐induced apoptosis in MGCs.
Materials and methods
Reagents
All reagents were purchased from Sigma Chemical Co. (St. Louis, MO, USA) unless otherwise indicated. All compounds were solubilized in dimethyl sulphoxide except PD98059, which was dissolved in ethanol. Steroid‐free medium containing dimethyl sulphoxide (vehicle) was used as control.
Cell treatment
GC‐1 cells were cultured in Dulbecco's modified Eagle's medium (Invitrogen, Carlsbad, CA, USA), supplemented with 10% charcoal‐stripped foetal bovine serum (FBS; Hyclone, Logan, UT, USA), 2% glutamine (Invitrogen), 1% penicillin and 1% streptomycin (Invitrogen). For cell proliferation experiments, GC‐1 cells were seeded at 1000 cells per well (96‐well plate) as starting point 20.
Immunofluoresence analysis
Cells were fixed in 4% paraformaldehyde‐phosphate‐buffered saline (PBS) and treated with 0.1% Triton X‐100 for 10 min at room temperature. After blocking in 10% appropriate serum in PBS for 30 min, cells were incubated with primary antibodies against: Oct4 (1:500; Chemicon, Temecula, CA, USA), Nanos2 (1:200; Abcam, Cambridge, MA, USA), PCNA (1:500; Chemicon), Plzf (1:200; Santa Cruz, CA, USA), Ssea1 (1:200; Chemicon), Vasa (1:500; Abcam), respectively, overnight at 4 °C, followed by Fluorescein isothiocyanate (FITC)‐coupled appropriate secondary antibodies (1:500; Millipore, Billerica, MA, USA) for 30 min. During incubations, slides and plates were washed three times in PBS. Nuclei of cells were counterstained with Hoechst 33342 before slides were observed and analysed using a Leica microscope (Hicksville, NY, USA) 20.
Determination of intracellular ROS generation
DCFH‐DA: GC‐1 cells were washed in FBS before loading with 50 μm DCFH‐DA (ROS Assay Kit; Beyotime, Haimen, Jiangsu, China) in PBS for 20 min at 37 °C. Cells were then washed twice in PBS. Acr was added at indicated concentrations and incubated for designated times prior to being placed in the flow cytometer (Altra; Beckman Coulter, Brea, CA, USA), with excitation wavelength of 488 and 530 nm emission 21.
Dihydroethidium (DHE): MGCs were washed in PBS before being loaded with 5 μm DHE (Dihydroethidium Kit; Beyotime Institute of Biotechnology) in PBS for 30 min at 37 °C. Cells were then washed twice in PBS. Acr was added at indicated concentrations and incubated for designated times prior to being placed in the flow cytometer (Altra; Beckman Co.), excitation wavelength 488 and 610 nm emission 22.
DCFH‐DA‐ and DHE‐related fluorescence was measured using logarithmic amplification in the flow cytometer. Fifteen thousand cells were analysed for each group, and data were reported as peak fluorescence intensity.
MTT assay
Cell viability was determined using MTT [3‐(4, 5‐dimethyl‐thiazol‐2‐yl)‐2, 5‐diphenyl‐tetrazolium bromide] assay. Briefly, at the end of each treatment, 100 μl MTT (5 mg/ml in 1 M phosphate‐buffered saline, pH 7.6) was added to each well of 96‐well plates and plates were incubated for 2 h at 37 °C in 5% CO2 and 95% air. Optical density was measured at 570 nm using a microplate reader 17.
Haemacytometer and flow cytometry cell count
GC‐1 cells were co‐cultured in 0, 0.5, 10 and 100 μm concentrations Acr for 48 h, then harvested, and washed in PBS. All samples were assessed by flow cytometry and haemacytometer count in three independent experiments.
DNA content analysis
Cells were washed in ice‐cold PBS, suspended and fixed in 70% ice‐cold ethanol for 3 days. Thereafter, they were centrifuged at 500 g for 10 min, and washed in ice‐cold PBS. Cell pellets were re‐suspended in 0.5 ml PBS containing 50 mg/ml propidium iodide (PI) and 100 mg/ml RNase (Invitrogen), incubated at 37 °C for 30 min and analysed using a flow cytometer (Beckman Altra; Beckman Co.) 23.
CFDA‐SE cell proliferation assay and tracking kit
Cells were labelled with final concentration 10 mm CFDA‐SE (carboxyfluorescein diacetate, succinimidyl ester; Beyotime Institute of Biotechnology) for 48 h. All co‐cultures and controls were analysed for CFDA‐SE fluorescence using flow cytometry (Altra; Beckman Co.) 24.
GSH and GSSG assay kit
Glutathione and GSSG levels were measured using a GSH and GSSG assay kit (S0053; Beyotime Institute of Biotechnology), according to the manufacturer's protocol 25, 26.
Annexin V‐ FITC apoptosis analysis
Cells were harvested, and washed in cold PBS and cold binding buffer x1. They were then resuspended in cold 1× binding buffer, 1 × 10⁶ cells/ml. One hundred microlitres cells (1 × 10⁵ cells) was added to each labelled tube, and 5 μl annexin V‐FITC to appropriate tubes. Each tube was gently vortexed and incubated for 10 min at room temperature. Five microlitres PI solution was added for 5 min at room temperature, protected from the light. Cells were washed once in PBS and resuspended in PBS, then analysed using a flow cytometer (Beckman Altra; Beckman Co.) 27.
Mitochondrial membrane potential (ΔΨm) assay
Mitochondrial membrane potential was determined using dual‐emission mitochondrion‐specific lipophilic, cationic dye, 5, 5′, 6, 6′‐tetrachloro‐1, 1′, 3, 3′ tetraethylbenzimidazoly‐carbocyanine iodide (JC‐1). Punctate red fluorescence (excitation 530 nm/emission 600 nm) represents potential‐dependent aggregate form of JC‐1 in mitochondria of healthy cells (polarized mitochondria). Diffuse green fluorescence (excitation 490 nm, emission 530 nm) represents monomeric form of JC‐1 in the cytosol of unhealthy cells (depolarized mitochondria). Cells grown on coverslips were incubated in JC‐1 (10 μg/ml) at 37 °C for 15 min and washed in PBS, then mounted on slides for Leica microscopy equipped with an on‐stage incubator (20/20 Technologies, Pompano Beach, FL, USA) for imaging. TRITC and GFP filter sets (Semrock, San Francisco, CA, USA) were used to detect depolarized and repolarized mitochondria respectively. Both colour channels were overlaid in IPLab software (Becton Dickinson, Franklin, NJ, USA) to measure distribution of both repolarized and depolarized mitochondria in the field 28, 29.
RNA isolation and qRT‐PCR
Total RNA was isolated using TRIzol (Invitrogen). qRT‐PCR reactions were set up in 15 μl reaction mixtures containing 7.3 μl 1 × SYBR, 0.1 μl PremixExTaqTM (BOER; Biotech. Co. Ltd, Hangzhou, China), 0.3 μl sense primer, 0.3 μl antisense primer, 6.5 μl distilled water and 0.5 μl template. Reaction conditions were as follows: 95 °C for 30 s, followed by 40 cycles of 95 °C for 10 s and 58 °C for 20 s. Transcripts of Bcl2, Bax and Bcl2/Bax ratio were used as indices for effects of apoptosis in MGCs. All data were normalized to β‐actin in each well 30. Nucleotide sequences of primers were as follows: Bcl2 (PrimerBank ID: 133893253c2): forward, 5′‐GAG AGC GTC AAC AGG GAG ATG‐3′ and reverse, 5′‐CCA GCC TCC GTT ATC CTG GA‐3′ and Bax (PrimerBank ID: 6680770a1): forward, 5′‐TGA AGA CAG GGG CCT TTT TG‐3′ and reverse, 5′‐AAT TCG CCG GAG ACA CTC G‐3′.
Western blot analysis
The total cellular protein was extracted through the following methods. Cells were washed in cold‐buffered PBS and were then lysed in RIPA buffer (150 mM NaCl, 1 % Triton X‐100, 0.5 % NaDOD, 0.1 % SDS, and 50 mM Tris, pH 8.0). After centrifugation (7438 g, 5 min) at 4 °C, the protein supernate was transferred into new tubes, and then extracted in 1 × SDS–PAGE sample loading buffer. Total cell proteins were resolved by SDS–PAGE, transferred to PVDF membrane, and probed with β‐actin (1:1000; Beyotime, Haimen, Jiangsu, China), Bcl2 (1:500; bs‐0032R, Bioss, Tongzhou, Beijing, China), Bax (1:500; bs‐0127R, Bioss). Horse‐radish peroxidase conjugated anti‐rabbit IgG was used as a secondary antibody (1:1000; Beyotime). Detection was performed using BM‐Chemiluminescence blotting substrate (Roche, Shanghai, China). Maps were analysed by ImageJ (V1.48d, National Institutes of Health, Bethesda, MD, USA) for integrated density.
Statistical analysis
Data are presented as mean ± SEM of three independent experiments; three replicates were evaluated for each experiment. Statistical comparisons were assessed with analysis of Student's test. P < 0.05 was considered statistically significant. All statistical analyses were performed using the spss software for Windows V17.0 (SPSS, Chicago, IL, USA).
Results
Characteristics of GC‐1 cells
Characteristics of GC‐1 cells cultured in our laboratory were confirmed by immunofluorescence. Staining analysis showed that they had all specific features of type B spermatogonia or early spermatocytes, with expression of MGC markers including Oct4, Nanos2, PCNA, Plzf, Ssea1 and Vasa (Fig. 1).
Figure 1.
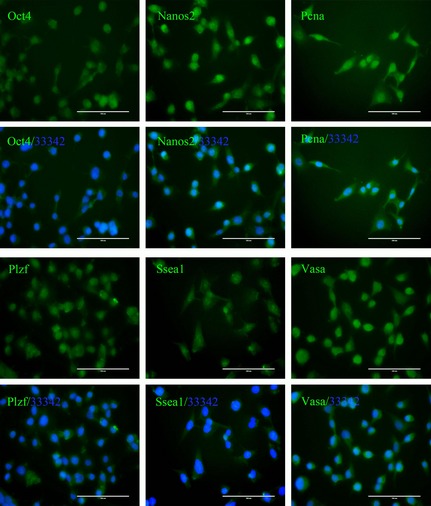
GC‐1 cells have specific features of type B spermatogonia or early spermatocytes – such as expression of Oct4, Nanos2, PCNA, Plzf, Ssea1, Vasa (FITC‐coupled secondary antibodies ‘/33342’ is the abbreviation of the merged photos that additionally stained with Hoechst 33342, bar = 100 μm).
Acr caused lower ratio of GSH/GSSG and induced dose‐dependent ROS generation
Acr can react with GSH in many types of cells; we measured intracellular concentrations of GSH and GSSG in GC‐1 cells then calculated the ratio of GSH/GSSG. We found that Acr caused lower concentrations of intracellular GSH and lower ratio of GSH/GSSG (Fig. 2a,b). Thus, we speculated that intracellular ROS could be generated cell treatment with Acr. To test this, the GC‐1 cells were exposed to a variety of concentrations of Acr for 4, 6 and 8 h, prior to being stained with DCFH‐DA, for measuring intracellular ROS using a flow cytometric assay. Results showed that levels of ROS increased with increased concentration of Acr, suggesting a proportional relationship between ROS and Acr concentration in the cells (Fig. 2c).
Figure 2.
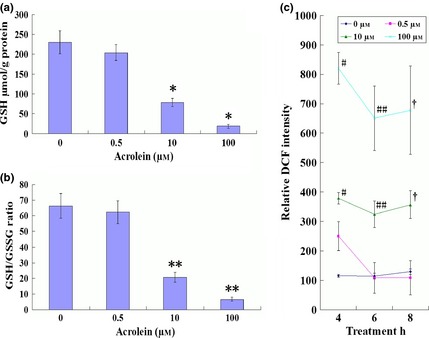
Acrolein ( Acr ) caused lower ratio of GSH / GSSG and induced dose‐dependent ROS generation. GC‐1 cells were exposed to various concentrations of Acr for 6 h, stained with DTNB to measure intracellular GSH and the ratio of GSH/GSSG by Microplate Reader (a and b); or exposed to various concentrations Acr for 4, 6 and 8 h, stained with DCFH‐DA to measure intracellular level of ROS by flow cytometry (c). GSH and the ratio of GSH/GSSG were reduced when they were treated with Acr. Acr caused higher intracellular ROS levels in MGCs. Results showed that ROS increased with concentration and disposal time of Acr. *P < 0.05, compared to 0 μm. **P < 0.05, compared to 0 μm. #P < 0.05, compared to 0 μm 4 h. ##P < 0.05, compared to 0 μm 6 h. †P < 0.05, compared to 0 μm 8 h.
Acr affected cell viability
The GC‐1 cells were exposed to Acr for 48 h, and viability was determined by MTT assay, haemacytometer counting and flow cytometry. Results showed that Acr was able to suppress viability of the cells in a dose‐dependent manner (Fig. 3a,b).
Figure 3.
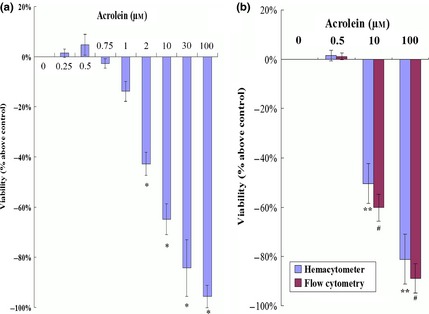
Acrolein ( Acr ) affected GC ‐1 cell viability. Cells were treated with 0, 0.5, 10 and 100 μm concentrations of Acr for 48 h. Viabilities were determined using MTT assay (a), haemacytometer counting and flow cytometry (b). Results show that Acr suppressed viability in a dose‐dependent manner. *P < 0.05, compared to 0 μm by MTT. **P < 0.05, compared to 0 μm by haemacytometer. #P < 0.05, compared to 0 μm by CFDA SE assay.
Inability of Acr to alter MGC proliferation
Reduction in cell viability could be attributed to cell death or to lower capacity of cell proliferation. To explore whether Acr‐induced cell death or impaired cell proliferation accounted for the dose‐dependent inhibition of cell viability, cell cycle analysis and CFDA‐SE assay were used to evaluate cell proliferation. Results showed that Acr did not significantly alter MGC proliferation (Fig. 4a). In contrast, dramatic cell death was found in the group treated with high concentrations of Acr, although low concentration of Acr did not affect self‐renewal of the cells (Fig. 4b). These data suggest that the dose‐dependent reduction in cell viability was not a consequence of impaired cell proliferation, but that cell death was caused by higher concentration of Acr.
Figure 4.
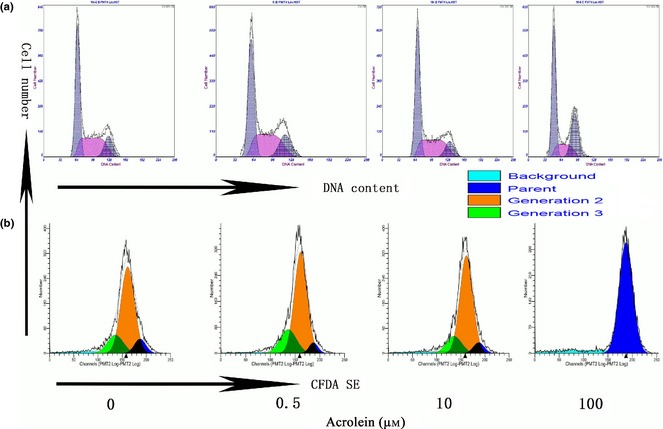
Inability of acrolein ( Acr ) to alter MGC proliferation. Cells were treated with 0, 0.5, 10 and 100 μm concentrations Acr for 12 h, stained with PI to analyse the cell cycle (a) and treated for 48 h, then stained with CFDA SE to analyse cell generation (b). Both cell cycle and generation analysis above proved that proliferation of the cells was not the reason for cell viability reduction, treated by Acr.
Acr‐induced cell apoptosis
To determine whether Acr caused cell death by apoptosis and that ROS led to apoptosis in MGCs, the cells were exposed to Acr at different concentrations and analysed for apoptosis by staining with FITC‐labelled annexin V/PI in an apoptosis kit, by flow cytometry (Fig. 5a,b). Results showed that there was more frequent apoptosis in cultures treated with higher concentrations of Acr, in comparison to cells exposed to less concentrations of Acr, indicating that apoptosis might account for the dose‐dependent impaired cell viability for Acr.
Figure 5.
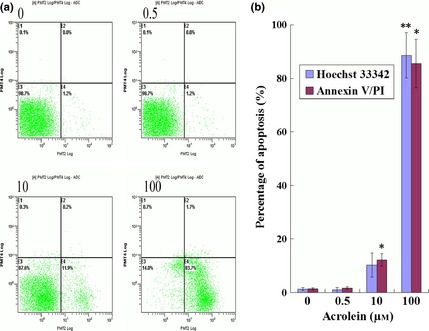
Acrolein ( Acr )‐induced apoptosis. Cells were exposed to various concentrations of Acr for 12 h, stained with an FITC‐labelled annexin V/PI apoptosis kit and measured by flow cytometry (a and b), stained with Hoechst 33342 measured by fluorescence microscopy (b). There were increased numbers of apoptotic cells compared to lower concentration Acr. Apoptosis was the reason for cell viability decrease treated by Acr. *P < 0.05, compared to 0 μm and stained with FITC‐labelled annexin V/PI. **P < 0.05, compared to 0 μm and stained with Hoechst 33342.
Rap inhibited Acr‐induced apoptosis
Several lines of evidence have revealed that mTORC1, p38, NF‐κB, MAPKK and PKA pathways participate in regulation of intracellular ROS 29, 31, 32, 33, 34. To investigate involvement of these pathways, we evaluated effects of various inhibitors on Acr‐induced apoptosis. To activate GPCR, PKG and EGFR‐ERK pathways, MGCs with or without pre‐treatment with Rap (0.1 μm Rap), SB (50 μm SB203580), PDTC (20 μm), PD98 (50 μm PD98059) and H89 (20 μm), inhibitors of mTORC1, P38, NF‐κB, MAPKK and PKA, respectively. Then, after exposure to 100 μm Acr for 12 h, apoptosis was measured using the FITC‐labelled annexin V/PI apoptosis kit. As shown in Fig. 6a and 6b, only Rap inhibited Acr‐induced apoptosis. There was no significant effect of inhibition of Acr‐induced apoptosis for other inhibitors. Specifically, as a reducing agent, PDTC did not reverse Acr‐caused apoptosis. This negative result might suggest that PDTC was not a substitute for GSH consumed by Acr. Thus, the mechanism of Rap on Acr‐induced apoptosis was further investigated.
Figure 6.
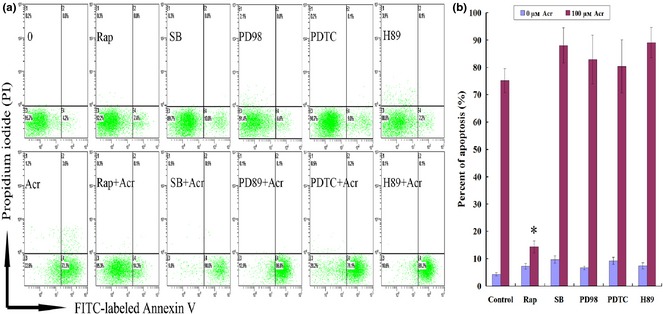
Rapamycin ( Rap ) specifically inhibited acrolein ( Acr )‐induced apoptosis. Cells were exposed to 100 μm Acr‐stimulated apoptosis for 12 h through activation of GPCR, PKG and EGFR‐ERK pathways, and determined by FITC‐labelled annexin V/PI apoptosis kit, with or without pre‐treatment with Rap (0.1 μm Rap), SB (50 μm SB203580), PDTC (20 μm Ammonium pyrrolidinedithiocarbamate), PD98 (50 μm PD98059) and H89 (20 μm H‐89·2HCl), which are inhibitors of mTOR, P38, NF‐κB, MAPKK and PKA, respectively (a and b). Only Rap specifically inhibited Acr‐induced apoptosis. There were no significant effect of inhibition of Acr‐induced apoptosis by other inhibitors. *P < 0.05, compared to 100 μm Acr marked as control group.
Rap relieved Acr‐induced apoptosis
To confirm the above results, the cells were exposed to a variety of concentrations of Acr for 36 h, and stained with PI to analyse DNA content by flow cytometry. Results demonstrated dose‐dependent Acr‐induced apoptosis, and addition of Rap repressed it (Fig. 7a,b). However, DNA content analysis further indicated that Acr was unable to significantly impact cell cycle parameters. Thus, Acr‐impaired cell viability seemed mainly to be caused by cell death, not impaired cell proliferation.
Figure 7.
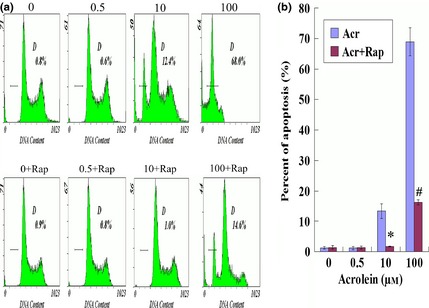
Rapamycin relieved acrolein ( Acr )‐induced apoptosis. To confirm the result above, GC‐1 cells were exposed to various concentrations of Acr for 36 h, and stained with propidium iodide (PI) to analyse DNA content by flow cytometry (a and b). Acr induced apoptosis in a concentration‐dependent manner. However, rapamycin relieved this phenomenon. *P < 0.05, compared to 10 μm Arc. #P < 0.05, compared to 100 μm Acr.
Rap alleviated Acr‐driven intracellular ROS production
Next, we sought to explore whether Rap, an inhibitor of mTORC1, was able to alleviate Acr‐induced intracellular ROS production in GC‐1 cells. As shown in Fig. 8, the cells were exposed to various concentrations of Acr and 0.1 μm Rap for 6 h, then were stained with DHE (Fig. 8a) and DCFH‐DA (Fig. 8b) for accessing intracellular level of ROS by flow cytometry. Results showed that Acr induced intracellular ROS in a dose‐dependent manner, and Rap was able to repress generation of ROS by higher concentrations of Acr.
Figure 8.
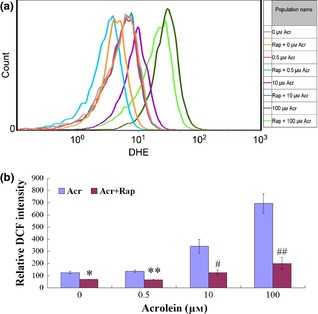
Rapamycin ( Rap ) alleviated acrolein ( Acr )‐driven intracellular ROS production. GC‐1 cells exposure to Acr and Rap for 6 h. To measure intracellular level of ROS by flow cytometry, cells were stained with DHE (a) or DCFH‐DA (b). The two experiments proved that Acr induced intracellular ROS in a dose‐dependent manner, and Rap‐alleviated Acr caused higher intracellular ROS levels. *P < 0.05, compared to 0 μm Arc. **P < 0.05, compared to 0.5 μm Acr. #P < 0.05, compared to 10 μm Acr. ##P < 0.05, compared to 100 μm Acr.
Rap increased Bcl2/Bax ratio in Acr‐treated cells
Bcl2 and Bax are important proteins in apoptosis mediation. Thus, we isolated GC‐1 RNA of cells exposed to Acr and Rap for 6 h; transcripts of Bcl2 and Bax were examined by qRT‐PCR. We found that Rap was able to inhibit pro‐apoptotic protein Bax expression, and augment anti‐apoptotic protein Bcl2 expression, which led to increased Bcl2/Bax ratio in Acr‐treated cells (Fig. 9a). To confirm qRT‐PCR results, we analysed relative protein levels of Bcl2 and Bax by western blotting. Protein trends were consistent with mRNA expression (Fig. 9b,c). Above all, Rap increased levels of Bcl2/Bax of mRNA and protein expression in Acr‐treated cells.
Figure 9.
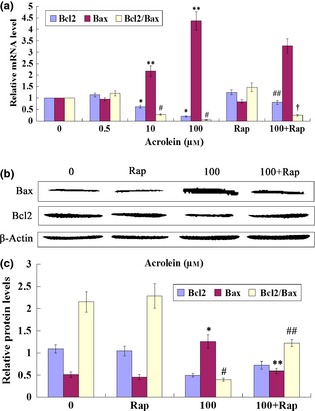
Rapamycin ( Rap ) increased Bcl2/Bax ratio in acrolein ( Acr )‐treated cells. GC‐1 cells exposure to Acr and 0.1 μm Rap for 6 h. Bcl2 and Bax mRNA levels were examined with QRT‐PCR (a) the control value was set as 1; protein levels were examined using western blotting (b). The results were analysed by ImageJ (V1.48d) for their integrated density (c). We found that Rap specifically alleviated Acr‐related increase in Bcl2/Bax expression rate. (a) *P < 0.05, compared to 0 μm Arc in Bcl2. **P < 0.05, compared to 0 μm Acr in Bax. #P < 0.05, compared to 0 μm Acr in Bcl2/Bax. ##P < 0.05, compared to 100 μm Acr in Bax. †P < 0.05, compared to 100 μm Acr in Bcl2/Bax. (c) *P < 0.05, compared to 0 μm Arc in Bax. **P < 0.05, compared to 100 μm Acr in Bax. #P < 0.05, compared to 0 μm Acr in Bcl2/Bax. ##P < 0.05, compared to 100 μm Acr in Bcl2/Bax.
Rap alleviated Acr‐induced reduction of ΔΨm
Reactive oxygen species are harmful to the mitochondrion. To confirm ROS in GC‐1 cells caused by Acr, cells were exposed to various concentrations of Acr for 6 h, then were stained with JC‐1 to measure ΔΨm by fluorescent microscopy (Fig. 10a) and flow cytometry (Fig. 10b). Experimental results showed that there was a dose‐dependent trend that high concentration of Acr reduced ΔΨm in these MGCs. However, Rap alleviated Acr‐induced ΔΨm reduction.
Figure 10.
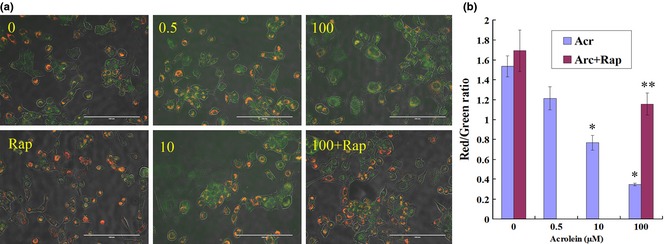
Rapamycin ( Rap ) alleviated acrolein ( Acr )‐induced reduction in mitochondrial membrane potentiality (ΔΨm). GC‐1 cells were exposed to various concentrations of Acr, or arcolein and 0.1 μm Rap for 6 h, and stained with JC‐1 to measure mitochondrial membrane potential by fluorescence microscopy (a, bar = 200 μm) and flow cytometry (b). Punctate red fluorescence represents the potentially dependent aggregate form of JC‐1 in the mitochondria of healthy cells (polarized mitochondria). Diffuse green fluorescence represents the monomeric form of JC‐1 in the cytosol of unhealthy cells (depolarized mitochondria). Thus, the decrease in Red/Green rate meant decline of ΔΨm. Results showed that there was a dose‐dependent trend, that is, higher concentrations of Acr caused decline of ΔΨm in more cells, but Rap could alleviate Acr‐induced decline of ΔΨm. *P < 0.05, compared to 0 μm Acr. **P < 0.05, compared to 0 μm Acr and 0.1 μm Rap.
Discussion
Acrolein, an unsaturated aldehyde with its strongly reactive electrophilic carbonyl group, reacts with and depletes cell nucleophiles, such as GSH 30, and is able to cause ROS production, in many types of cells 4, 35, 36. Being an endogenous toxin, Acr is specially insidious. Moreover, Acr can easily penetrating across cell membranes, and serum levels of Acr in humans are estimated normally to reach as high as 50 μmol/l 37.
Particularly in the testes, although ROS have been thought to be hazardous to germ cells, a recent study has provided evidence that ROS, as a component of the microenvironment of spermatogonial stem cells (SSCs), plays an essential role in SSC self‐renewal in mice in vitro and in vivo 12. Moreover, mild concentration of hydrogen peroxide does not affect cell viability, as ROS damage (such as DNA damage) offsets the effect of ROS‐induced self‐renewal of SSCs 12. Previous studies have shown that oxidative stress due to excessive production of ROS has been associated with defective sperm function and infertility 38, 39; infertile men have reduced sperm variables induced by higher ROS levels in semen 38. A positive relationship exists between increased sperm damage by ROS and higher levels of apoptosis 38. In our study, we found Acr‐induced ROS did not significantly affect proliferation of MGCs; however, it caused apoptosis. Thus, our results suggest that Acr might cause similar reactions to mild concentration of hydrogen peroxide in MGCs.
We found that Acr caused lower ratios of GSH/GSSG and higher ROS levels in a dose‐dependent manner. Acr‐induced intracellular ROS reduced levels of Bcl2/Bax mRNA and protein expression level, which caused the disappearance of ΔΨm. Rap, an inhibitor of mTORC1, was able to alleviate the Acr‐induced ROS, increased the ratio of Bcl2/Bax, and protected mitochondrial membranes (as Scheme shown in Fig. 11). According to our data, Acr‐induced ROS were the main mechanisms in its reproductive toxicology. However, further study on DNA damage will be required to demonstrate cytotoxic mechanisms of Acr from further perspectives.
Figure 11.
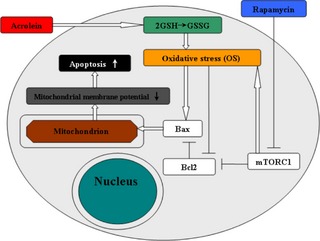
Scheme showing possible signal transduction pathways regulated by rapamycin in blocking ROS ‐driven mitochondrial dysfunction and apoptosis in acrolein‐treated MGC s.
As has been reported recently, Rap increases expression of ROS response genes such as those for superoxide dismutase 1, GSH reductase and δ‐aminolevulinate dehydratase 32. The authors concluded that Rap‐induced stimulation of ROS response genes may promote longevity of MGCs, while repression of gene expression in aged cells could reflect MGCs' diminished potential to alleviate ROS, a hallmark of ageing 34. A similar phenomenon was also found in our study. Rap alleviated intracellular ROS. Thus, our study indicated that there was a proportional relationship between the mTOR pathway and ROS. Given that ROS is important in cell survival, differentiation and senescence, as well as a causative factor in many diseases 33, 34, our results in this study suggested that Rap might be one of the suppressors of the harmful effect of intracellular ROS.
Taken together, Rap inhibited Acr‐induced apoptosis through alleviation of ROS in MGCs. Furthermore, we provided novel insight into the potential role of Rap in mediating apoptosis caused by ROS in MGCs in this study. Thus, it is of significance in reproduction, environmental toxicology and ageing.
Acknowledgements
This work was supported by the grants from the Program (31272518) of National Natural Science Foundation of China, and National Major Fundamental Research Program of China (2013CB947900), Doctoral Fund of Ministry of Education of China (RFDP20120204110030), the Fundamental Research Funds for the Central Universities (QN2011012).
References
- 1. Liu F, Li XL, Lin T, He DW, Wei GH, Liu JH et al (2012) The cyclophosphamide metabolite, acrolein, induces cytoskeletal changes and oxidative stress in Sertoli cells. Mol. Biol. Rep. 39, 493–500. [DOI] [PubMed] [Google Scholar]
- 2. Kenney LB, Laufer MR, Grant FD, Grier H, Diller L (2001) High risk of infertility and long term gonadal damage in males treated with high dose cyclophosphamide for sarcoma during childhood. Cancer 91, 613–621. [DOI] [PubMed] [Google Scholar]
- 3. Ghilarducci P, Tjeerdema S (1995) Fate and effects of acrolein. Rev. Environ. Contam. Toxicol. 144, 95–146. [DOI] [PubMed] [Google Scholar]
- 4. Kehrer JP, Biswal SS (2000) The molecular effects of acrolein. Toxicol. Sci. 57, 6–15. [DOI] [PubMed] [Google Scholar]
- 5. Liu XY, Zhu MX, Xie JP (2010) Mutagenicity of acrolein and acrolein‐induced DNA adducts. Toxicol. Mech. Methods 20, 36–44. [DOI] [PubMed] [Google Scholar]
- 6. Stevens JF, Maier CS (2008) Acrolein: sources, metabolism, and biomolecular interactions relevant to human health and disease. Mol. Nutr. Food Res. 52, 7–25. [DOI] [PMC free article] [PubMed] [Google Scholar]
- 7. Zhang S, Balbo S, Wang M, Hecht SS (2011) Analysis of acrolein derived 1, N2‐propanodeoxyguanosine adducts in human leukocyte DNA from smokers and nonsmokers. Chem. Res. Toxicol. 24, 119–124. [DOI] [PMC free article] [PubMed] [Google Scholar]
- 8. Saitou M, Furuse M, Sasaki H, Schulzke JD, Fromm M, Takano H et al (2000) Complex phenotype of mice lacking occludin, a component of tight junction strands. Mol. Biol. Cell 11, 4131–4142. [DOI] [PMC free article] [PubMed] [Google Scholar]
- 9. Ghosh D, Das UB, Ghosh S, Mallick M, Debnath J (2002) Testicular gametogenic and steroidogenic activities in cyclophosphamide treated rat: a correlative study with testicular oxidative stress. Drug Chem. Toxicol. 25, 281–292. [DOI] [PubMed] [Google Scholar]
- 10. Manda K, Bhatia AL (2003) Prophylactic action of melatonin against cyclophosphamide‐induced oxidative stress in mice. Cell Biol. Toxicol. 19, 367–372. [DOI] [PubMed] [Google Scholar]
- 11. Agarwal A, Saleh RA, Bedaiwy MA (2003) Role of reactive oxygen species in the pathophysiology of human reproduction. Fertil. Steril. 79, 829–843. [DOI] [PubMed] [Google Scholar]
- 12. Morimoto H, Iwata K, Ogonuki N, Inoue K, Atsuo O, Kanatsu‐Shinohara M et al (2013) ROS Are required for mouse spermatogonial stem cell self‐renewal. Cell Stem Cell 12, 774–786. [DOI] [PubMed] [Google Scholar]
- 13. Lavranos G, Balla M, Tzortzopoulou A, Syriou V, Angelopoulou R (2012) Investigating ROS sources in male infertility: a common end for numerous pathways. Reprod. Toxicol. 34, 298–307. [DOI] [PubMed] [Google Scholar]
- 14. Maiorino M, Ursini F (2002) Oxidative stress, spermatogenesis and fertility. Biol. Chem. 383, 591–597. [DOI] [PubMed] [Google Scholar]
- 15. Bellve AR, Cavicchia JC, Millette CF, O'Brien DA, Bhatnagar YM, Dym M (1977) Spermatogenic cells of the prepuberal mouse. Isolation and morphological characterization. J. Cell Biol. 74, 68–85. [DOI] [PMC free article] [PubMed] [Google Scholar]
- 16. Godmann M, May E, Kimmins S (2010) Epigenetic mechanisms regulate stem cell expressed genes Pou5f1 and Gfra1 in a male germ cell line. PLoS One 5, e12727. [DOI] [PMC free article] [PubMed] [Google Scholar]
- 17. Sheng ZG, Zhu BZ (2011) Low concentrations of bisphenol A induce mouse spermatogonial cell proliferation by G protein‐coupled receptor 30 and estrogen receptor‐alpha. Environ. Health Perspect. 119, 1775–1780. [DOI] [PMC free article] [PubMed] [Google Scholar]
- 18. Hochman DJ, Collaco CR, Brooks EG (2012) Acrolein induction of oxidative stress and degranulation in mast cells. Environ. Toxicol. doi: 10.1002/tox.21818 [Epub ahead of print]. [DOI] [PubMed] [Google Scholar]
- 19. Luo J, Shi R (2005) Acrolein induces oxidative stress in brain mitochondria. Neurochem. Int. 46, 243–252. [DOI] [PubMed] [Google Scholar]
- 20. Lv X, Zhu H, Bai Y, Chu Z, Hu Y, Cao H et al (2012) Reversine promotes porcine muscle derived stem cells (PMDSCs) differentiation into female germ‐like cells. J. Cell. Biochem. 113, 3629–3642. [DOI] [PubMed] [Google Scholar]
- 21. Yoon JC, Ng A, Kim BH, Bianco A, Xavier RJ, Elledge SJ (2010) Wnt signaling regulates mitochondrial physiology and insulin sensitivity. Genes Dev. 24, 1507–1518. [DOI] [PMC free article] [PubMed] [Google Scholar]
- 22. Xie XQ, Li F, Ying SH, Feng MG (2012) Additive contributions of two manganese‐cored superoxide dismutases (MnSODs) to antioxidation, UV tolerance and virulence of Beauveria bassiana. PLoS One 7, e30298. [DOI] [PMC free article] [PubMed] [Google Scholar]
- 23. Groschel B, Bushman F (2005) Cell cycle arrest in G2/M promotes early steps of infection by human immunodeficiency virus. J. Virol. 79, 5695–5704. [DOI] [PMC free article] [PubMed] [Google Scholar]
- 24. Li W, Liu Y, Zhang JW, Ai CZ, Xiang N, Liu HX et al (2009) Anti‐androgen‐independent prostate cancer effects of ginsenoside metabolites in vitro: mechanism and possible structure‐activity relationship investigation. Arch. Pharm. Res. 32, 49–57. [DOI] [PubMed] [Google Scholar]
- 25. Sakurai T, He G, Matsuzawa A, Yu GY, Maeda S, Hardiman G et al (2008) Hepatocyte necrosis induced by oxidative stress and IL‐1 alpha release mediate carcinogen‐induced compensatory proliferation and liver tumorigenesis. Cancer Cell 14, 156–165. [DOI] [PMC free article] [PubMed] [Google Scholar]
- 26. Hu L, Chen L, Yang G, Li L, Sun H, Chang Y et al (2011) HBx sensitizes cells to oxidative stress‐induced apoptosis by accelerating the loss of Mcl‐1 protein via caspase‐3 cascade. Mol. Cancer 10, 43. [DOI] [PMC free article] [PubMed] [Google Scholar]
- 27. Yang L, Zhou X, Yang J, Yin X, Han L, Zhao D (2008) Aspirin inhibits cytotoxicity of prion peptide PrP106‐126 to neuronal cells associated with microglia activation in vitro. J. Neuroimmunol. 199, 10–17. [DOI] [PubMed] [Google Scholar]
- 28. Li Y, Li Q, Wang Z, Liang D, Liang S, Tang X et al (2009) 15‐HETE suppresses K(+) channel activity and inhibits apoptosis in pulmonary artery smooth muscle cells. Apoptosis 14, 42–51. [DOI] [PubMed] [Google Scholar]
- 29. Li J, Shao ZH, Xie JT, Wang CZ, Ramachandran S, Yin JJ et al (2012) The effects of ginsenoside Rb1 on JNK in oxidative injury in cardiomyocytes. Arch. Pharm. Res. 35, 1259–1267. [DOI] [PMC free article] [PubMed] [Google Scholar]
- 30. Esterbauer H, Schaur RJ, Zollner H (1991) Chemistry and biochemistry of 4‐hydroxynonenal, malonaldehyde and related aldehydes. Free Radic. Biol. Med. 11, 81–128. [DOI] [PubMed] [Google Scholar]
- 31. Erdogdu O, Eriksson L, Xu H, Sjoholm A, Zhang Q, Nystrom T (2013) Exendin‐4 protects endothelial cells from lipoapoptosis by PKA, PI3K, eNOS, p38 MAPK, and JNK pathways. J. Mol. Endocrinol. 50, 229–241. [DOI] [PubMed] [Google Scholar]
- 32. Kofman AE, McGraw MR, Payne CJ (2012) Rapamycin increases oxidative stress response gene expression in adult stem cells. Aging (Albany NY) 4, 279–289. [DOI] [PMC free article] [PubMed] [Google Scholar]
- 33. Valko M, Leibfritz D, Moncol J, Cronin MT, Mazur M, Telser J (2007) Free radicals and antioxidants in normal physiological functions and human disease. Int. J. Biochem. Cell Biol. 39, 44–84. [DOI] [PubMed] [Google Scholar]
- 34. Kregel KC, Zhang HJ (2007) An integrated view of oxidative stress in aging: basic mechanisms, functional effects, and pathological considerations. Am. J. Physiol. Regul. Integr. Comp. Physiol. 292, R18–R36. [DOI] [PubMed] [Google Scholar]
- 35. Brancato G, Rega N, Barone V (2006) A quantum mechanical/molecular dynamics/mean field study of acrolein in aqueous solution: analysis of H bonding and bulk effects on spectroscopic properties. J. Chem. Phys. 125, 164515. [DOI] [PubMed] [Google Scholar]
- 36. Roy J, Pallepati P, Bettaieb A, Tanel A, Averill‐Bates DA (2009) Acrolein induces a cellular stress response and triggers mitochondrial apoptosis in A549 cells. Chem. Biol. Interact. 181, 154–167. [DOI] [PubMed] [Google Scholar]
- 37. Satoh K, Yamada S, Koike Y, Igarashi Y, Toyokuni S, Kumano T et al (1999) A 1‐hour enzyme‐linked immunosorbent assay for quantitation of acrolein‐ and hydroxynonenal‐modified proteins by epitope‐bound casein matrix method. Anal. Biochem. 270, 323–328. [DOI] [PubMed] [Google Scholar]
- 38. Wang X, Sharma RK, Sikka SC, Thomas AJ Jr, Falcone T, Agarwal A (2003) Oxidative stress is associated with increased apoptosis leading to spermatozoa DNA damage in patients with male factor infertility. Fertil. Steril. 80, 531–535. [DOI] [PubMed] [Google Scholar]
- 39. Aitken RJ, Baker MA (2013) Causes and consequences of apoptosis in spermatozoa; contributions to infertility and impacts on development. Int. J. Dev. Biol. 57, 265–272. [DOI] [PubMed] [Google Scholar]