

Abstract
Objectives
The present study has aimed to evaluate chemopreventive potential of d‐carvone on oxidative stress markers, biotransforming enzymes, incidence of colonic polyps and aberrant crypt foci (ACF) in 1,2‐dimethylhydrazine (DMH)‐induced experimental colon carcinogenesis.
Materials and Methods
Rats were randomly divided into six groups, with group I serving as control. Group II animals received d‐carvone every day orally (20 mg/kg body weight) for 16 weeks; groups III–VI received subcutaneous injections of DMH (20 mg/kg body weight) once a week, for the first 4 weeks. In addition, groups IV–VI received different doses of d‐carvone (5, 10 and 20 mg/kg body weight everyday orally) along with DMH injections.
Results
Our results revealed that supplementation with d‐carvone significantly reduced incidence of polyps/ACF and ACF multiplicity in DMH‐exposed rats compared to DMH‐alone‐exposed rats. Moreover, our results showed reduced activities of liver and circulatory antioxidants and increased levels of lipid peroxidation by products in DMH‐exposed animals, which were significantly reversed on supplementation with d‐carvone. In addition, colonic antioxidants and lipid peroxidation were significantly diminished in DMH‐exposed rats, which were significantly elevated on supplementation with d‐carvone. Furthermore, we also determined activities of biotransforming enzymes, which were found to be altered in DMH‐exposed rats, but reversed on d‐carvone supplementation. All these observations of changes were supported by histochemical findings.
Conclusion
Overall, results obtained from this study suggest that d‐carvone at 10 mg/kg body weight provided optimum protection and could be used as an effective chemopreventive agent against colon carcinogenesis induced by DMH.
Introduction
Colorectal carcinoma is a well‐studied tumour in terms of carcinogenesis in rodents, of remarkably long history, dating back almost 80 years. A cycasin derivative, 1,2‐dimethylhydrazine (DMH) is a colon‐specific carcinogen known to produce tumours in rodents. DMH is metabolized to form azoxymethane, which is further metabolized to methylazoxymethanol (MAM) by cytochrome P4502E1 in the liver. MAM is conjugated in the liver by glucuronic acid and is transported to the colon in bile as MAM glucuronide, where it is deconjugated by action of gut microbial enzymes, specially β‐glucuronidase, to be converted into a mutagen and a carcinogen. Thus, mutagen/carcinogen in turn it elicits oxidative stress and is further responsible for methylation of nucleic acids that triggers colon tumours in the rat 1.
Aberrant crypt foci (ACF) are putative pre‐neoplastic lesions and are precursors of colorectal cancer, showing numerous similarities to those seen in human sporadic colon carcinoma 2, 3. Thus, formation and growth of ACF caused by DMH induction in experimental models are being used as a potent marker to identify modulators of colon carcinogenesis.
Several studies describe the therapeutic potential of medicinal herbs and their active ingredients in alleviating animal diseases. Caraway (Carumcarvi L. Umbelliferae) is a commonly used food component/herbal drug used as a spice, besides having a long history as a medicinal plant, since ancient times. Caraway seeds are also traditionally used for treating ailments such as flatulence, colic pain and bronchitis and have pharmacological properties such as being antispasmodic, antioxidant, antibacterial, anti‐ulcerogenic, spasmodic, carminative, emmenagogic and galactagogic, with potent anti‐hyperglycaemic, lipid‐lowering and anti‐proliferative effects. Previous studies from our laboratory have revealed that caraway seeds diminish bacterial enzyme activity and reduce numbers and multiplicity of ACF, thereby effectively suppressing colon carcinogenesis. The main constituents of caraway have been validated to be carvone (40–60%), limonene, carveol, dihydrocarveol, thymol and flavonoids. d‐carvone (Fig. 1) is considered to be an important constituent of many essential oils (caraway, dill and spearmint), but is most abundant in the oil of caraway seeds 4. Taking into account this background, the present study aimed to explore chemopreventive efficacy of d‐carvone, a major constituent of dietary caraway seeds, with special focus on its effect in DMH‐induced biochemical and pathological changes, in an experimental model of colon carcinogenesis.
Figure 1.

Chemical structure of d ‐carvone.
Materials and methods
Reagents
1,2‐Dimethylhydrazine and d‐carvone were obtained from Sigma Chemicals Co., St. Louis, MO, USA. Further chemicals and solvents used were of analytical grade and purchased from Hi‐Media Laboratories Ltd., Mumbai, India.
Animals and diet
Adult, male Wistar rats weighing 120–150 g (5 weeks old) were obtained and maintained at the Central Animal House, Rajah Muthiah Medical College & Hospital, Annamalai University, Tamil Nadu, India. Animals were maintained as per principles and guidelines of the Ethical Committee for Animal Care of Annamalai University, in accordance with the Indian National Law on animal care and use (Reg. No. 160/1999/CPCSEA/796). They were housed in clean polypropylene cages under standard vivarium conditions of 12‐h light/12‐h dark cycle, at 25 ± 2 °C and relative humidity 50 ± 5%, until the end of the experimental period. Commercial pellet diet containing 4.2% fat (Hindustan Lever Ltd., Mumbai, India) was powdered and mixed with 15.8% peanut oil, making a total of 20% fat in the diet (modified pellet diet) 5, 6. This modified pellet diet and water were fed ad libitum throughout the experimental period of 16 weeks.
Experimental design
Rats were randomly divided into six experimental groups of twelve rats each; then they were quarantined for 2 weeks for environmental and trainer handling acclimatization before initiation of the experiment. Group I rats received modified diet for 16 weeks and served as controls. Group II animals received modified diet with d‐carvone (20 mg/kg body weight) orally every day throughout the 16 weeks and groups III–VI rats received modified diet with subcutaneous injections of DMH (20 mg/kg body weight) once a week, for the first 4 weeks. In addition, groups IV–VI rats received different doses of d‐carvone orally every day (5, 10 and 20 mg/kg body weight respectively) along with the modified pellet diet and DMH injections.
d‐carvone preparation
d‐carvone was suspended in 1% DMSO just before treatment and was administered each day orally at one of the following doses, 5, 10 and 20 mg/kg body weight, for 16 weeks.
Tumour induction
For inducing colon cancer, DMH was dissolved in 1 mM EDTA just prior to use and pH was adjusted to 6.5 with 1 mm NaOH, to ensure stability of the carcinogen. It was then administered subcutaneously in the right thigh at 20 mg/kg body weight once a week, for the first 4 weeks of the experiment.
Body weight and growth rate changes
Over the experimental period, body weight and growth rate of control and experimental rats were measured. Animals were weighed at the beginning of the experiment, subsequently once a week and finally before sacrifice.
Measurement of incidence of polyps
To measure incidence of polyps at the end of the 16‐week study, rat colons were removed and flushed with saline. They were then cut open longitudinally taking care not to disturb any polyps present. Polyps were carefully counted during visual macroscopic examination. See section below.
Sample preparation
Preparation of plasma/lysate and tissue homogenate for oxidative stress markers
The experiment was terminated at the end of the 16th week and animals in different groups were sacrificed under anaesthesia [intra‐peritoneal (i.p.) administration of ketamine hydrochloride, 30 mg/kg body weight] by cervical decapitation between 7 and 10 am after overnight fasting. Blood was collected in heparinized tubes and plasma was separated by centrifugation at 2000 × g for 10 min. After separation of plasma, the buffy coat was removed and packed red blood cells were washed three times in cold physiological saline. Erythrocyte lysate was prepared by lysing a known volume of red blood cells with hypotonic phosphate buffer, pH 7.4. Centrifuging at 3000 × g for 10 min at 4 °C separated the haemolysate. Immediately after sacrifice, liver, proximal colon (caecum to the mid of the transverse colon) and distal colon (mid portion of transverse colon to the anal opening) tissues were dissected and washed in saline. Tissues were minced and homogenized in 3 volumes (w/v) of appropriate buffer using a Potter‐Elvehjam homogenizer with a Teflon pestle, and centrifuged at 1200 × g for 20 min at 4 °C. Supernatant was used for antioxidant and lipid peroxidation (LPO) measurement.
Preparation of cytosolic and microsomal fractions
Cytosolic and microsomal fractionation was carried out by the method of Schladt et al. 7. Briefly, liver and colon mucosal scrapings were homogenized in 10 mm Tris‐HCl buffer (pH 7.4) containing 0.25 M sucrose, centrifuged at 9000 × g for 20 min and supernatant was collected. This was centrifuged at 100,000 × g for 20 min, and clear cytosolic fractions obtained were promptly assayed for activities of phase II enzymes such as glutathione‐S‐transferase (GST), DT‐diaphorase (DTD) and UDP‐glucuronyl transferase (UDP‐GT). Pellets, after centrifugation at 100,000 × g were resuspended in ice‐cold 0.15 M Tris‐KCl buffer (pH 7.4) and recentrifuged for 60 min at 100,000 × g. The microsomal pellet was resuspended in homogenization buffer equivalent to half the original buffer and was used to assay phase I enzymes such as cytochrome P450 (CYP450) and cytochrome P4502E1 (CYP2E1).
Faecal and colonic mucosal tissue processing
Fresh faecal pellets were collected for assay of faecal bacterial enzymes. Mucosa from the colon was collected by scraping with a slide (starting point of the colon to 2 cm before the anal opening). Faecal pellets and colonic mucosa were homogenized using phosphate‐buffered saline, centrifuged at 2000 × g for 10 min at 4 °C and supernatant was collected for activity of faecal and colonic mucosal bacterial enzymes.
Biochemical analysis
Determination of lipid peroxidation and antioxidants
Lipid peroxidation was estimated spectrophotometrically by measuring concentration of thiobarbituric acid reactive substances (TBARS) by the method of Ohkawa et al. 8 in tissues, by the method of Yagi 9 in the plasma and Donnan 10 in the lysate. Superoxide dismutase (SOD, EC.1.15.1.1) activity was assayed by the method of Kakkar et al. 11 and catalase (CAT, EC.1.11.1.6) by the method of Sinha 12. Reduced glutathione (GSH) was determined by the method of Ellman 13, glutathione peroxidase (GPx, EC.1.11.1.9) by the method of Rotruck et al. 14 and glutathione reductase (GR, EC.1.6.4.2) by the method of Carlberg and Mannervik 15.
Assay of phase I and phase II enzymes
Cytochrome P450 (microsomal fraction) (CYP450, EC 1.14.14.1) was measured by the method of Omura and Sato 16 and cytochrome P4502E1 (microsomal fraction) (CYP2E1, EC 1.14.13.n7) by the method of Watt et al. 17. GST (cytosolic fraction) (GST, EC.2.5.1.18) was assayed by the method of Habig et al. 18, DTD (cytosolic fraction) (DTD, EC. 1.6.99.2) activity by the method of Ernster et al. 19 and UDP‐GT (cytosolic fraction) (UDP‐GT, EC 2.4.1.17) by the method of Isselbacher et al. 20.
Measurement of bacterial enzymes
β‐Glucuronidase (EC 3.2.1.31) activity was assayed by the method of Freeman 21 and mucinase (EC 4.2.2.1) by the method of Shiau and Chang 22.
Estimation of protein
Total protein content was determined by the method of Lowry et al. 23.
Determination of aberrant crypt foci (ACF)
Topographical analysis of the colonic ACF was performed according to method of Bird 24. At the end of the 16th week, rat colons were excised, flushed with saline and opened longitudinally from anus to caecum. Each colon was cut into two segments (proximal and distal colon) and fixed flat between filter papers in 10% buffered formalin for 24 h. Formalin‐fixed colons were stained with 0.2% methylene blue in distilled water for 2 min and washed in distilled water for 5 s to remove excess stain. Samples were then placed on microscope slides with the mucosal side facing up and viewed under a light microscope (Carl Zeiss, Axio Scope.A1, Jena, Germany) at low magnification; morphological changes of the colons were also seen and photographed using digital imaging. ACF were identified by their larger sizes compared to normal crypts, intense methylene blue staining, irregular and dilated shape of the luminal opening, thickened epithelial lining and increased pericryptal zone. Total number of ACF per colon, total number of aberrant crypts in each focus, and location of each focus were recorded to evaluate crypt multiplicity.
Combined alcian blue‐periodic acid Schiff (AB‐PAS) histochemistry of colonic mucin
Histochemical analysis of mucin was carried out using the combined AB‐PAS technique 25. Briefly, 5 μm paraffin‐embedded colon sections were heated for 60 min at 60 °C, deparaffinized in xylene, and rehydrated through graded alcohols at room temperature. Sections were stained with alcian blue for 25 min and washed in distilled water followed by staining with Schiff's reagent for 15 min, washing in running tap water and counterstaining with haematoxylin. Overstained sections were washed in running tap water, dehydrated in graded alcohols and mounted using DPX. To determine whether DMH caused morphological changes in associated mucus, cell number and integrity, alcian blue‐positive cells were quantified for each category of control and experimental groups of rats (Carl Zeiss).
Histopathological study
One slice of liver and colon tissues from each of the different groups were fixed in 10% neutral buffered formalin for 1 week at room temperature. Specimens were then dehydrated by passing through graded series of ethanol, cleared in xylene and embedded in paraffin wax. Tissue blocks were sectioned and processed using routine histological methods followed by haematoxylin and eosin (H&E) staining. Stained sections were viewed under the light microscope (Carl Zeiss) by a pathologist without prior knowledge of the groups, and histological changes were noted.
Statistical analysis
Results were expressed as mean ± SD of six rats per group. Data were analysed by one‐way analysis of variance (ANOVA) and any significant differences among treatment groups were evaluated using Duncan's multiple range test (DMRT). Results were considered statistically significant when P < 0.05. All statistical analyses were performed using SPSS version 15.0 software package (SPSS, Tokyo, Japan).
Results
Effect of d‐carvone on body weight and growth rate changes
Table 1 collates effects of d‐carvone treatment for 112 days on mean body weight and growth rate changes in control and experimental rats. From week 0 to 16, variable changes were observed in body weight of animlas in the different groups. At the end of the 16th week, DMH‐alone (group III)‐exposed rats had reduced weight gain compared to control rats (groups I and II). However, this significant (P < 0.05) weight loss was prevented on supplementation with different doses (5, 10 and 20 mg/kg body weight) of d‐carvone to DMH‐exposed rats (groups VI–VI). Growth rate was calculated as difference between final and initial body weight divided by total number of days, 112. There was a significant increase in growth rate on supplementation with d‐carvone at different doses of 5,10 and 20 mg/kg body weight to DMH‐exposed rats (groups IV–VI) compared to DMH‐alone‐exposed rats (group III). However, d‐carvone at 10 mg/kg body weight (group 3) caused significantly improved weight gain and growth rate compared with other treatment (5 and 20 mg/kg body weight) groups (IV and VI), thereby offering optimum protection to rats against DMH‐induced colon carcinogenesis.
Table 1.
Effect of d‐carvone on initial and final body weight changes and growth rate of control and experimental rats
| Groups | Initial body weight (g) 1st week | Final body weight (g) 16th week | Weight gain (g) | Growth rate (g) |
|---|---|---|---|---|
| I | 127.33 ± 4.30a | 244.08 ± 6.50a | 116.74 ± 4.36ab | 1.04 ± 0.03ab |
| II | 129.17 ± 3.95a | 248.50 ± 6.14a | 119.33 ± 3.42b | 1.06 ± 0.03b |
| III | 134.49 ± 4.45b | 198.70 ± 3.69b | 64.20 ± 1.84c | 0.57 ± 0.01c |
| IV | 131.99 ± 6.01ab | 225.44 ± 7.02c | 93.44 ± 2.67d | 0.083 ± 0.02d |
| V | 130.33 ± 7.28ab | 243.79 ± 4.95a | 113.46 ± 8.39a | 1.01 ± 0.07a |
| VI | 132.16 ± 5.73ab | 233.53 ± 7.60d | 101.37 ± 4.42e | 0.90 ± 0.03e |
Values are given as mean ± SD of each group. Superscript letter (a–e) are used to refer and distinguish the values of the different groups. Values not sharing a common superscript differ significantly at P < 0.05 (DMRT).
Effect of d‐carvone on colonic polyp incidence
Table 2 depicts frequency of colon polyps in control and experimental rats. Incidence of colon polyps was higher (100%) in DMH‐alone‐exposed rats, found most commonly in distal areas of the large intestine. However, on supplementation with different doses (5, 10 and 20 mg/kg body weight) of d‐carvone (groups IV–VI), incidence of colon polyps was significantly reduced compared to DMH‐alone‐exposed rats (group III). Incidence of colon polyps in rats exposed to DMH and supplemented with d‐carvone at 10 mg/kg body weight (group V) was significantly lower (21.05%) compared to with the other two doses; 5 and 20 mg/kg body weight had 57.89% and 42.10% colonic polyp incidence respectively in groups IV and VI.
Table 2.
Effect of d‐carvone on the incidence of colonic polyps in the colon of control and experimental rats
| Groups | No. of rats | No. of polyps‐bearing rats | Total number of polyps | Average number of polyps‐bearing ratsa | Percentage incidence of polypsb | Percentage of polyps inhibition |
|---|---|---|---|---|---|---|
| I | 6 | 0 | Nil | Nil | – | – |
| II | 6 | 0 | Nil | Nil | – | – |
| III | 6 | 6 | 19 | 3.16 | 100 | 0 |
| IV | 6 | 4 | 11 | 2.75 | 57.89 | 42.11 |
| V | 6 | 2 | 4 | 2.0 | 21.05 | 78.95 |
| VI | 6 | 3 | 8 | 2.66 | 42.10 | 57.9 |
Total number of polyps/number of polyps‐bearing rats in each group.
Total number of polyps in treatment group/total number of polyps in DMH group ×100.
Effect of d‐carvone on ACF incidence
Figure 2 reveals topographical view of ACF in control and experimental rats. ACF occurrence was observed in all DMH‐exposed groups (III–VI), whereas control groups did not show ACF formation (groups I and II). The majority of ACF with 3 or more crypts was observed more in distal part of the colon than in proximal colon, when injected with DMH. Tables 3 and 4 demonstrate effects of d‐carvone on ACF occurrence, crypt multiplicity and distribution of ACF in the colon of control and experimental rats. Incidence of ACF as well as crypt multiplicity was higher in DMH‐alone‐exposed rats (group III). Supplementation with d‐carvone (groups IV–VI) for 16 weeks significantly (P < 0.05) reduced ACF formation and also crypt multiplicity in a dose‐dependent manner compared to DMH‐alone‐exposed animals. 71.06% inhibition of ACF incidence was observed in rats supplemented with d‐carvone at 10 mg/kg body weight, whereas inhibition level was significantly lower – 33.13% (5 mg/kg body weight) and 52.54% (20 mg/kg body weight) in groups IV and VI rats, respectively. Thus, a more pronounced effect on ACF inhibition and crypt multiplicity was observed in animals supplemented with d‐carvone at the dose of 10 mg/kg body weight (group V).
Figure 2.

Topographical view of normal crypts and aberrant crypt foci. (a and b) Colon of control and control + d‐carvone (50 mg/kg body weight)‐supplemented rats showing normal crypts (groups I and II). (c) 1,2‐Dimethylhydrazine (DMH)‐alone‐exposed rat colon shows more than six aberrant crypts (group III). (d) Colon of d‐carvone (5 mg/kg body weight)‐supplemented DMH‐exposed rat shows five aberrant crypts (group IV). (e) Colon of d‐carvone (10 mg/kg body weight)‐supplemented DMH‐exposed rat shows two aberrant crypts (group V). (f) Colon of d‐carvone (20 mg/kg body weight)‐supplemented DMH‐exposed rat shows four aberrant crypts (group VI).
Table 3.
The effect of d‐carvone on aberrant crypt foci (ACF) in the colon of control and experimental rats
| Groups | No. of rats/No. of ACF‐bearing rats | Number of ACF | Number of AC | No. of foci containing | ||
|---|---|---|---|---|---|---|
| 1 crypt | 2 crypts | >3 crypts | ||||
| I | 6/0 | Nil | Nil | Nil | Nil | Nil |
| II | 6/0 | Nil | Nil | Nil | Nil | Nil |
| III | 6/6 | 55.83 ± 3.43a | 158.16 ± 5.23a | 15.33 ± 1.21a | 17.16 ± 1.16a | 23.33 ± 1.72a |
| IV | 6/6 | 37.33 ± 1.75b | 97.83 ± 4.66b | 12.00 ± 1.41b | 15.66 ± 0.81b | 9.66 ± 0.81b |
| V | 6/6 | 16.00 ± 0.89c | 23.00 ± 2.09c | 9.00 ± 0.63c | 7.00 ± 0.26c | – |
| VI | 6/6 | 26.83 ± 0.75d | 49.83 ± 1.94d | 10.83 ± 0.75b | 12.16 ± 1.16d | 3.83 ± 0.40c |
Data are presented as the mean ± SD of six rats in each group. Values not sharing a common superscript letter (a–d) differ significantly at P < 0.05 (DMRT).
Table 4.
Distribution of aberrant crypt foci (ACF) in the colon of experimental rats
| Groups | Number of ACF | Proximal colon | Distal colon | Incidence of ACF% | Inhibition of ACF% |
|---|---|---|---|---|---|
| III | 55.83 ± 3.43a | 20.33 ± 1.50a | 35.50 ± 2.16a | 100 | 0 |
| IV | 37.33 ± 1.75b | 15.83 ± 1.47b | 21.50 ± 0.83b | 66.86 | 33.13 |
| V | 16.00 ± 0.89c | 4.50 ± 0.54c | 11.66 ± 0.81c | 28.94 | 71.06 |
| VI | 26.83 ± 0.75d | 10.33 ± 1.03d | 16.50 ± 1.37d | 47.46 | 52.54 |
Data are presented as the mean ± SD of six rats in each group. Values not sharing a common superscript letter (a–d) differ significantly at P < 0.05 (DMRT).
Effect of d‐carvone on lipid peroxidation
Tables 5, 6, 7 represent effects of d‐carvone on concentration of LPO by products TBARS of control and experimental rats. In DMH‐alone‐exposed rats (group III), concentration of TBARS was significantly (P < 0.05) higher in the circulation and liver, whereas in both proximal and distal colon, concentrations were significantly lower compared to control and control + d‐carvone‐supplemented rats (groups I and II). Oral supplementation with d‐carvone at doses of 5, 10 and 20 mg/kg body weight to DMH‐exposed rats, reinstated concentration of LPO by products to near normal when compared to control rats. d‐carvone at 5 and 10 mg/kg body weight (groups IV and VI) also restored levels of LPO by products, but the effect was significantly less compared to 10 mg/kg body weight. Therefore, it can be inferred that the effect was more pronounced when d‐carvone was supplemented at the dose of 10 mg/kg body weight (group V).
Table 5.
Effect of d‐carvone on circulatory TBARS and antioxidant enzymes of control and experimental rats
| Parameters samples | Groups | |||||
|---|---|---|---|---|---|---|
| I | II | III | IV | V | VI | |
| Plasma | ||||||
| TBARS (nmol/mL) | 1.82 ± 0.16a | 1.75 ± 0.12a | 4.88 ± 0.20b | 3.52 ± 0.35c | 1.60 ± 0.13a | 2.26 ± 0.24d |
| Haemolysate | ||||||
| TBARS (pmol/mg Hb) | 1.63 ± 0.14a | 1.69 ± 0.15a | 5.38 ± 0.41b | 3.72 ± 0.28c | 1.74 ± 0.15a | 2.86 ± 0.12d |
| SOD (50% NBT reduced/min/mg Hb) | 4.27 ± 0.40a | 4.35 ± 0.20b | 2.15 ± 0.15c | 2.91 ± 0.18d | 4.55 ± 0.32b | 3.97 ± 0.16a |
| CAT (μmol of H2O2 utilized/min/mg Hb) | 2.61 ± 0.14a | 2.75 ± 0.23ab | 1.09 ± 0.07c | 1.77 ± 0.13d | 2.93 ± 0.27b | 2.29 ± 0.17e |
| GPx (μmol of GSH utilized/min/mg Hb) | 31.97 ± 0.27a | 29.82 ± 0.17b | 12.07 ± 1.21c | 17.80 ± 1.49d | 32.99 ± 2.63b | 27.44 ± 2.02e |
| GR (μmol of NADPH oxidized/min/mg Hb) | 43.68 ± 3.38a | 42.37 ± 2.12a | 27.80 ± 2.72b | 33.40 ± 1.75c | 43.87 ± 4.41a | 37.24 ± 3.16d |
| GSH (mg/dL haemolysate) | 34.32 ± 2.26a | 36.22 ± 3.60a | 21.92 ± 1.63c | 24.03 ± 2.62c | 33.84 ± 3.24a | 30.46 ± 2.43d |
TBARS, thiobarbituric acid reactive substances; SOD, superoxide dismutase; CAT, catalase; GSH, glutathione; GPx, glutathione peroxidase; GR, glutathione reductase; NBT, nitro blue tetrazolium.
Data are presented as the mean ± SD of six rats in each group. Values not sharing a common superscript letter (a–e) differ significantly at P < 0.05 (DMRT).
Table 6.
Effect of d‐carvone on TBARS and antioxidant enzymes in the liver of control and experimental rats
| Parameters samples | Groups | |||||
|---|---|---|---|---|---|---|
| I | II | III | IV | V | VI | |
| Liver | ||||||
| TBARS (mmol/mg tissue) | 0.55 ± 0.02a | 0.54 ± 0.02a | 0.82 ± 0.07b | 0.75 ± 0.02c | 0.55 ± 0.05a | 0.67 ± 0.03d |
| SOD (50% NBT reduced/min/mg protein) | 8.71 ± 0.68a | 8.13 ± 0.23b | 4.00 ± 0.08c | 5.94 ± 0.14d | 8.23 ± 0.61ab | 6.76 ± 056e |
| CAT (μmol of H2O2 utilized/min/mg protein) | 53.56 ± 4.30a | 53.30 ± 2.69a | 29.35 ± 1.77b | 40.00 ± 3.63c | 51.65 ± 3.39a | 43.81 ± 3.12c |
| GPx (μmol of GSH utilized/min/mg protein) | 6.73 ± 0.44a | 6.56 ± 0.33a | 2.92 ± 0.19b | 4.83 ± 0.30c | 6.61 ± 0.41a | 5.45 ± 0.45d |
| GR (μmol of NADPH oxidized/min/mg protein) | 22.12 ± 2.10a | 20.77 ± 1.57a | 13.21 ± 1.02b | 16.23 ± 0.80c | 21.97 ± 1.88a | 17.37 ± 1.08c |
| GSH (mmol/mg tissue) | 29.55 ± 2.07a | 27.60 ± 2.32a | 11.33 ± 0.99b | 16.88 ± 1.43c | 27.88 ± 1.99a | 23.20 ± 1.43d |
TBARS, thiobarbituric acid reactive substances; SOD, superoxide dismutase; CAT, catalase; GSH, glutathione; GPx, glutathione peroxidase; GR, glutathione reductase.
Data are presented as the mean ± SD of six rats in each group. Values not sharing a common superscript letter (a–e) differ significantly at P < 0.05 (DMRT).
Table 7.
Effect of d‐carvone on TBARS and antioxidant enzymes in the colonic tissues of control and experimental rats
| Parameters samples | Groups | |||||
|---|---|---|---|---|---|---|
| I | II | III | IV | V | VI | |
| Proximal colon | ||||||
| TBARS (mmol/mg tissue) | 0.43 ± 0.02a | 0.41 ± 0.02a | 0.23 ± 0.01b | 0.34 ± 0.02c | 0.42 ± 0.03a | 0.37 ± 0.03d |
| SOD (50% NBT reduced/min/mg protein) | 5.53 ± 0.34a | 5.65 ± 0.45a | 2.58 ± 0.12b | 3.22 ± 0.23c | 5.52 ± 0.14a | 4.82 ± 0.26d |
| CAT (μmol of H2O2 utilized/min/mg protein) | 40.75 ± 3.65a | 39.80 ± 3.09a | 20.00 ± 1.21b | 24.22 ± 1.36c | 39.14 ± 2.76a | 33.52 ± 1.71d |
| GPx (μmol of GSH utilized/min/mg protein | 5.83 ± 0.35a | 5.90 ± 0.42a | 3.04 ± 0.19b | 3.52 ± 0.23c | 6.10 ± 0.37a | 5.14 ± 0.32d |
| GR (μmol of NADPH oxidized/min/mg protein) | 18.60 ± 1.77a | 19.12 ± 1.67a | 11.22 ± 0.88b | 14.31 ± 1.21c | 19.09 ± 1.32a | 15.77 ± 1.32c |
| GSH (mmol/mg tissue) | 19.43 ± 1.03a | 18.21 ± 1.21b | 9.27 ± 0.66c | 13.62 ± 0.63d | 18.10 ± 1.21b | 15.72 ± 0.78e |
| Distal colon | ||||||
| TBARS (mmol/mg tissue) | 0.56 ± 0.02a | 0.59 ± 0.02a | 0.21 ± 0.01b | 0.36 ± 0.02c | 0.57 ± 0.04a | 0.48 ± 0.03d |
| SOD (50% NBT reduced/min/mg protein) | 7.55 ± 0.60a | 7.07 ± 0.27b | 4.01 ± 0.13c | 4.73 ± 0.19d | 7.27 ± 0.44ab | 6.24 ± 0.19e |
| CAT (μmol of H2O2 utilized/min/mg protein) | 47.57 ± 3.54a | 46.43 ± 3.98a | 16.41 ± 0.99b | 25.17 ± 2.10c | 45.90 ± 3.20a | 36.91 ± 3.43d |
| GPx (μmol of GSH utilized/min/mg protein) | 8.06 ± 0.58a | 7.88 ± 0.67a | 2.81 ± 0.15b | 5.29 ± 0.30c | 8.11 ± 0.63a | 6.84 ± 0.45d |
| GR (μmol of NADPH oxidized/min/mg protein) | 20.34 ± 1.99a | 19.48 ± 1.43a | 9.08 ± 0.55b | 14.20 ± 0.94c | 19.97 ± 1.54a | 16.54 ± 0.60d |
| GSH (mmol/mg tissue) | 21.41 ± 2.03a | 19.54 ± 1.59b | 13.57 ± 0.77c | 15.38 ± 1.23d | 21.32 ± 1.16a | 16.74 ± 1.58d |
TBARS, thiobarbituric acid reactive substances; SOD, superoxide dismutase; CAT, catalase; GSH, glutathione; GPx, glutathione peroxidase; GR, glutathione reductase.
Data are presented as the mean ± SD of six rats in each group. Values not sharing a common superscript letter (a–e) differ significantly at P < 0.05 (DMRT).
Effect of d‐carvone on SOD and CAT activities
Tables 5, 6, 7 present activities of antioxidant enzymes, SOD and CAT of control and experimental rats. Our results indicate that activities of SOD and CAT were significantly (P < 0.05) diminished in the haemolysate, liver, proximal colon and distal colon of DMH‐alone‐exposed rats compared to the control and control + d‐carvone‐supplemented rats. Supplementation with d‐carvone at doses of 5, 10 and 20 mg/kg body weight, to DMH‐exposed rats (groups IV–VI) significantly elevated activities of SOD and CAT by the end of the experimental period (16th week), a more pronounced effect being observed in rats supplemented with the medium dose of 10 mg/kg body weight of d‐carvone (group V). Doses 5 and 20 mg/kg body weight d‐carvone‐supplemented rats (groups IV and VI) also showed significant elevation in activities of SOD and CAT, but this effect was less compared to 10 mg/kg body weight d‐carvone‐supplemented rats (group V).
Effect of d‐carvone on GSH and GSH‐dependent enzymes
Tables 5, 6, 7 portray levels of GSH and activities of GSH‐dependent enzymes such as GPx and GR, which were significantly (P < 0.05) reduced in haemolysate, liver, proximal colon and distal colon of DMH‐alone‐exposed rats compared to control and control + d‐carvone‐supplemented rats. On the other hand, supplementation with d‐carvone at 5, 10 and 20 mg/kg body weight (groups IV–VI), significantly raised activities of GPx, GR and concentration of GSH, but effects at 5 and 20 mg/kg body weight were significantly less compared to the 10 mg/kg body weight d‐carvone‐supplemented rats. Thus, a more pronounced effect was observed in rats supplemented with d‐carvone at 10 mg/kg body weight (group V).
Effect of d‐carvone on phase I (microsomes) and phase II (cytosol) xenobiotic metabolizing enzymes
Tables 8 and 9 show effects of d‐carvone on activities of phase I enzymes CYP450 and CYP2E1, and activities of phase II enzymes GST, DTD and UDP‐GT, in liver and colonic mucosa of control and experimental rats. The liver and colonic mucosa of DMH‐alone‐exposed rats had significant (P < 0.05) elevation in activities of phase I enzymes and significant (P < 0.05) reduction in activities of phase II enzymes, compared to control and control + d‐carvone‐supplemented rats (groups I and II). Altered activities of these enzymes were restored to near normal when supplemented with d‐carvone at different doses, a more pronounced effect being observed in rats supplemented with d‐carvone at 10 mg/kg body weight (group V) compared to 5 and 20 mg/kg body weight (groups IV and VI). However, no significant variations were found in control rats treated with d‐carvone alone.
Table 8.
Effect of d‐carvone on phase I and II enzymes in the liver of control and experimental rats
| Parameters samples | Groups | |||||
|---|---|---|---|---|---|---|
| I | II | III | IV | V | VI | |
| Liver | ||||||
| CYP450 (μmol/mg protein) | 5.91 ± 0.38a | 6.17 ± 0.53a | 8.82 ± 0.39c | 7.31 ± 0.65d | 5.69 ± 0.30a | 6.93 ± 0.64d |
| CYP4502E1 (mmol of p‐nitrocatechol liberated/min/mg protein) | 5.73 ± 0.27a | 6.08 ± 0.42a | 9.37 ± 0.45b | 7.88 ± 0.59c | 6.18 ± 0.35a | 6.92 ± 0.39d |
| GST (μmol of 1‐chloro‐2,4‐dinitrobenzene (CDNB)‐GSH conjugate formed/min/mgprotein) | 1.76 ± 0.15a | 1.81 ± 0.16a | 0.74 ± 0.04b | 0.92 ± 0.05c | 1.68 ± 0.10a | 1.43 ± 0.09d |
| DTD (μmol of 2,6‐dichlorophenolindophenol reduced/min/mg protein) | 2.11 ± 0.19a | 2.03 ± 0.14a | 0.83 ± 0.05b | 1.14 ± 0.07c | 1.97 ± 0.15a | 1.53 ± 0.13d |
| UDPGT (nmol/min/mg protein) | 5.57 ± 0.47a | 5.81 ± 0.43a | 2.68 ± 0.15b | 3.58 ± 0.28c | 5.49 ± 0.58ad | 5.13 ± 0.46d |
GST, glutathione‐S‐transferase; DTD, DT‐diaphorase; UDPGT, UDP‐glucuronyl transferase.
Data are presented as the mean ± SD of six rats in each group. Values not sharing a common superscript letter (a–d) differ significantly at P < 0.05 (DMRT).
Table 9.
Effect of d‐carvone on phase I, II and bacterial enzymes in the colonic mucosa of control and experimental rats
| Parameters samples | Groups | ||||||
|---|---|---|---|---|---|---|---|
| I | II | III | IV | V | VI | ||
| Colonic mucosa | |||||||
| CYP450 (μmol/mg protein) | 2.59 ± 0.17a | 2.73 ± 0.24a | 5.76 ± 0.35b | 4.37 ± 0.30c | 2.64 ± 0.18a | 3.45 ± 0.32d | |
| CYP4502E1 (mmol of p‐nitrocatechol liberated/min/mg protein) | 1.23 ± 0.09a | 1.19 ± 0.06ab | 2.65 ± 0.19c | 1.94 ± 0.14d | 1.07 ± 0.06b | 1.58 ± 0.14e | |
| GST (μmol of 1‐chloro‐2,4‐dinitrobenzene (CDNB)‐GSH conjugate formed/min/mg protein) | 2.86 ± 0.19a | 2.95 ± 0.23a | 1.41 ± 0.21b | 1.85 ± 0.15c | 2.99 ± 0.30a | 2.17 ± 0.16d | |
| DTD (μmol of 2,6‐dichlorophenolindophenol reduced/min/mg protein) | 1.78 ± 0.17a | 1.72 ± 0.33a | 0.79 ± 0.05b | 1.01 ± 0.07c | 1.64 ± 0.14a | 1.32 ± 0.09d | |
| UDPGT (nmol/min/mg protein) | 3.94 ± 0.16a | 3.78 ± 0.15a | 1.64 ± 0.19b | 2.26 ± 0.13c | 3.88 ± 0.32a | 3.14 ± 0.14d | |
| β‐Glucuronidase (μg of p‐nitrophenol liberated/h/g protein) | 6.12 ± 0.40a | 5.81 ± 0.21a | 12.95 ± 0.91b | 10.33 ± 0.67c | 6.04 ± 0.29a | 8.65 ± 0.54d | |
| Mucinase (mg of glucose liberated/min/mg protein) | 4.52 ± 0.38a | 4.91 ± 0.29ab | 7.94 ± 0.35c | 6.72 ± 0.53d | 4.47 ± 0.32a | 5.22 ± 0.18b | |
GST, glutathione‐S‐transferase; DTD, DT‐diaphorase; UDPGT, UDP‐glucuronyl transferase.
Data are presented as the mean ± SD of six rats in each group. Values not sharing a common superscript letter (a–d) differ significantly at P < 0.05 (DMRT).
Effect of d‐carvone on faecal and colonic mucosal bacterial enzymes
Tables 9 and 10 summarize activities of colonic mucosal and faecal bacterial enzymes β‐glucuronidase and mucinase of the control and experimental rats. Activities of these bacterial enzymes were significantly (P < 0.05) increased in DMH‐exposed rats (group III) compared to controls and rats treated with d‐carvone alone (groups I and II). However, supplementation of d‐carvone at different doses (5, 10 and 20 mg/kg body weight) significantly reduced activities of these bacterial enzymes, effects being more pronounced on supplementing d‐carvone at 10 mg/kg body weight (group V) compared to 5 and 20 mg/kg body weight (groups IV and VI).
Table 10.
Effect of d‐carvone on bacterial enzymes in the faecal of control and experimental rats
| Parameters samples | Groups | |||||
|---|---|---|---|---|---|---|
| I | II | III | IV | V | VI | |
| Faecal | ||||||
| β‐Glucuronidase (mg of p‐nitrophenol liberated/min/g protein) | 19.73 ± 1.37a | 19.88 ± 0.76a | 31.67 ± 1.79b | 26.60 ± 1.15c | 20.80 ± 1.74a | 23.93 ± 1.15d |
| Mucinase (mg of glucose liberated/min/mg protein) | 2.73 ± 0.21a | 2.60 ± 0.17a | 6.59 ± 0.37b | 4.68 ± 0.34c | 2.59 ± 0.12a | 3.82 ± 0.21d |
Data are presented as the mean ± SD of six rats in each group. Values not sharing a common superscript letter (a–d) differ significantly at P < 0.05 (DMRT).
Effect of d‐Carvone on AB/PAS histochemistry and mucus cell counts
Figure 3 shows the AB/PAS‐stained glycoprotein (mucin) of mucus secreting cells of control and experimental rats. Control and d‐carvone‐alone‐supplemented rat colon (groups I and II) had strong and intense AB/PAS staining located in almost all areas. DMH‐alone‐exposed rat colon (group III) showed progressive loss and reduced areas of AB/PAS staining, indicating decrease in mucin content distributed throughout the cells and reduction in mucus cell numbers (43/100 cells) compared to control rats. The mucosa of DMH‐exposed rats supplemented with d‐carvone at different doses (5, 10 and 20 mg/kg body weight) showed an increase in AB/PAS staining as well as clear increase in mucus cell size and number respectively [65, 89 and 74/100 cells (groups IV–VI)], compared to those found in the mucosa of DMH‐alone‐exposed rat (group III).
Figure 3.

Cross section of rat colon stained with AB/PAS‐stained glycoprotein (mucin) in the mucus secreting cells. (a and b) Control and control + d‐carvone (20 mg/kg body weight)‐supplemented rat shows strong and intense AB/PAS staining (groups I and II). (c) Mucosa of 1,2‐dimethylhydrazine (DMH)‐alone‐exposed rat shows progressive loss and decreased area of AB/PAS staining and irregular colonic architecture (group III). (d–f) Supplementation with d‐carvone at different doses showed (groups IV–VI) an increase in AB/PAS staining ability as compared to those found in DMH‐alone‐exposed rat (c).
Effect of d‐carvone on liver and colon histopathology
Figure 4 depicts photomicrographs of H&E‐stained liver sections of the control and experimental rats. Livers of control and d‐carvone‐alone‐exposed rats had normal liver architecture (groups I and II). Animals exposed to DMH alone (group III) had changes in the liver characterized by micro and macro vesicular type of fatty changes, Kupffer cell hyperplasia, nuclear pleomorphism and inflammatory cell infiltration in the portal triad (4c). Livers of DMH + d‐carvone (5 mg/kg body weight) (group IV)‐supplemented rats had marked inflammatory cell infiltrates around the portal triad and also neoplastic cells (4d). Livers of DMH + d‐carvone (10 mg/kg body weight) (group V) rats showed near normal architecture (4e) and livers of DMH + d‐carvone (20 mg/kg body weight) (group VI)‐supplemented rats had fewer neoplastic cells (4f).
Figure 4.
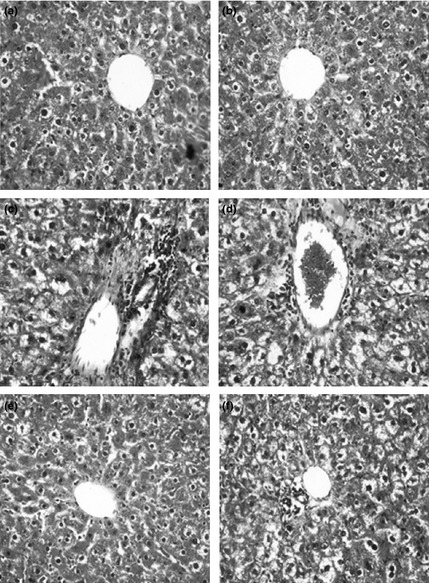
Histopathological findings in the liver of control and experimental rats [H&E staining]. (a and b) Liver of control and control + d‐carvone (20 mg/kg body weight)‐supplemented rats showing normal liver architecture with central portal vein. 1,2‐Dimethylhydrazine (DMH)‐alone‐exposed rat liver (group III) showing micro and macrovesicular type of fatty changes, Kupffer cell hyperplasia, nuclear pleomorphism and inflammatory cell infiltrates in the portal triad (c). The liver section of DMH + d‐carvone 5 mg/kg body weight (group IV)‐supplemented rat showing marked inflammatory cell infiltrates and neoplastic cells around the portal triad (d). The liver of DMH + d‐carvone 10 mg/kg body weight (group V) showing near normal architecture (e). The liver of DMH + d‐carvone 20 mg/kg body weight (group VI)‐supplemented rat showing less neoplastic cells and near normal architecture (f).
Figure 5 represents photomicrographs of H&E‐stained colon sections of control and experimental rats. Colons of control and d‐carvone‐alone‐exposed rats (groups I and II) had normal colonic architecture. DMH‐alone‐exposed rat colon (group III) showed loss of epithelial integrity, crypts with dilated lumina, prominent lymphoid aggregates and inflammatory cell infiltrates in the mucosal and submucosal layers (5c). Colon sections of DMH + d‐carvone (5 mg/kg body weight) (group IV)‐supplemented rats showed lymphoid aggregates with milder inflammatory cell infiltrates in the mucosal and submucosal layer. Colons of DMH + d‐carvone‐supplemented rats (10 mg/kg body weight) (group V) had near normal appearing glands with regular arrangements (5e). Colon sections of DMH + d‐carvone (20 mg/kg body weight) (group IV)‐supplemented rats showed milder inflammatory cell infiltrates in the mucosal layer (5f).
Figure 5.

Histopathological findings in the colon of control and experimental rats [H&E staining]. (a and b) Colon of control and control + d‐carvone (20 mg/kg body weight)‐supplemented rats showing normal colonic architecture (groups I and II). 1,2‐Dimethylhydrazine (DMH)‐alone‐exposed rat colon (group III) showing loss of epithelial integrity, crypt with dilated lumen, prominent lymphoid aggregates, inflammatory cell infiltrates in the mucosal and submucosal layers (c). The colonic section of DMH + d‐carvone 5 mg/kg body weight (group IV)‐supplemented rat showing lymphoid aggregates and milder inflammatory cell infiltrates in the mucosal and submucosal layer. The colon of DMH + d‐carvone‐supplemented rat 10 mg/kg body weight (group V) showing near normal appearing glands with regular arrangements. The colonic section of DMH + d‐carvone 20 mg/kg body weight (group VI)‐supplemented rat showing milder inflammatory cell infiltrates in the mucosal layer.
Discussion
The present study was performed to evaluate the chemopreventive potential of d‐carvone in DMH‐induced/high‐fat diet‐promoted rat colon carcinogenesis. During the experimental period of 16 weeks, no adverse effects were observed in d‐carvone‐alone‐supplemented rats, suggesting that d‐carvone was well tolerated. Reduced body weight gain, growth rate and increased polyps incidence/ACF frequency, in DMH‐alone‐exposed rats observed in the present study reflect the initiation stage of colon carcinogenesis in rats. Furthermore, we noted a significant reduction in food intake in carcinogen‐exposed rats, which could be due to progression of tumour precursors and tumour cell proliferation (ACF/polyps) in the colonic mucosa. However, oral supplementation with d‐carvone efficiently reversed body weight changes and also blunted the ability of DMH to stimulate pre‐neoplasia in the colon (polyps inhibition = 78.95%; ACF inhibition = 71.06). This inhibitory effect was apparent by reduction in number of polyps/ACF and lack of occurrence of carcinoma. The protective effect as evidenced by significant reduction in total number of ACF incidence and crypt multiplicity, surrogate markers of carcinogenesis, was more pronounced in rats supplemented with the medium dose (10 mg/kg body weight) compared to the other two tested doses.
1,2‐Dimethylhydrazine and its related compounds can induce neoplasmia specifically in the rat colon and we used peanut oil as a promoter to trigger colon carcinogenesis. DMH is metabolized to a methyl free radical, which in turn generates hydroxyl radical or hydrogen peroxide in the presence of metal ions that may contribute to initiation of LPO 26 and DNA‐methylation 27. Khan and Sultana 28 have reported that a single injection of DMH (40 mg/kg body weight) increased colonic LPO after 24 h (immediate effect) in male albino Wistar rats. On the other hand, frequent DMH injections followed by a latent period in experimental animals has shown reduced concentrations of LPO 29. Similar findings have also been reported in human malignant tissues 30. Thus, many studies have concluded that LPO is significantly reduced in rat tumour tissues (long‐term effect) compared to corresponding normal tissues, both in clinical and in pre‐clinical models 31. Presence of polyps in the colon of DMH‐exposed rats generates large amounts of H2O2, which usually enters the circulation 32 and accumulates in the liver for detoxification. Conversely, colon cancer cells behave differently from normal cells, becoming more resistant to pro‐inflammatory and pro‐apoptotic molecules in order to safeguard their own survival. Transformed cancer cells are known to acquire certain characteristics that benefit proliferation 33 and they tend to proliferate faster when LPO is low. Moreover, malignant tissues are less susceptible and more resistant to free radical attack and hence LPO is less intense in tumour tissues. Therefore, reduced colonic LPO observed in DMH‐exposed rats could be due to increased cell proliferation, increased resistance and/or reduced susceptibility of target organs to free radical attack. This may indicate that colon tissue comes into contact with excessive free radicals and/or has a weaker ability to detoxify them.
Antioxidants have been shown to inhibit initiation and promotion stages of carcinogenesis and to neutralize cell damage 34. SOD and CAT are the primary antioxidant enzymes involved in direct elimination of toxic free radicals and electrophiles. DMH/high‐ fat diet‐mediated oxidative stress enormously produces superoxide anion, which is dismutated into hydrogen peroxide by the activity of SOD. Subsequently, hydrogen peroxide is detoxified into molecular oxygen and water by activities of either CAT or GPx. GPx, being a selenium‐containing enzyme, aids removal of H2O2, thereby preventing formation of hydroxyl radical (OH−•); it also degrades hydroperoxide, a potentially toxic molecule 35. GSH, a major, non‐protein thiol in living organisms, performs a key role in coordinating innate antioxidant defence mechanisms. It is involved in maintenance of normal structure and functions of the cell, probably by its redox and detoxification reactions. GSH may function directly as an antioxidant by scavenging a variety of radical species and also by acting as an essential factor for GPx, which scavenges H2O2 36. Oxidized GSH is recycled back to GSH by GR, in an NADPH‐consuming process.
Our present study has shown significantly reduced activities of these principal antioxidants in the circulation, liver and colon of DMH‐exposed rats, which could be due to (i) their over utilization, to counter superoxide anions in cell organelles; (ii) inactivation by hydrogen peroxide; or (iii) inactivation by glycation of the enzyme. Decrease in antioxidants was paralleled by low index of LPO in the tumour environment. These findings correlate with previous reports from our laboratory and others 37, 38. Our results further indicate that supplementation with d‐carvone to DMH‐exposed rats significantly enhanced primary antioxidants in the circulation, liver and colonic tissues. In this context, plant antioxidants are generally known to possess a phenolic moiety, which can easily donate electrons to reactive free radicals due to resonance stability of the phenoxy radical, and thus retard radical chain reactions. Similarly, d‐carvone possibly confers its protective effect by scavenging free radicals and sparing activities of antioxidant enzymes.
Cytochrome p450 (CYP) isozymes are phase I biotransforming enzymes involved in activation of mutagens/carcinogens. Many CYP genes are known to exist in variant forms that have different activities 39. Metabolic activation of DMH to MAM and subsequently to a highly reactive alkylating species, probably the methyldiazonium ion, occurs mainly in the liver and colon by cytochrome P4502EI and β‐glucuronidase 40. Thus, the methyldiazonium ion formed is responsible for alkylation of DNA leading to base modifications, which, if not repaired prior to DNA replication, can represent initiation of tumourigenesis 27. Assay of these enzymes can be used as a biomarker for cancer intervention. In the present study, we observed a significant increase in activities of hepatic and colonic mucosal biotransforming enzymes and faecal β‐glucuronidase in DMH‐exposed rats, revealing induction of these enzymes during chemically induced carcinogenesis. Increase in hepatic phase I enzyme (CYP450 and CYP2E1) and faecal β‐glucuronidase activities may be attributed to the metabolism of DMH in liver microsomes and colonic epithelial cells. In this context, Dasgupta et al. 41 have suggested that enhanced activities of phase I enzymes are considered to be a potential cancer risk factor as they activate procarcinogens to the ultimate carcinogens.
Oral supplementation with d‐carvone significantly enhanced phase II enzymes GST, DTD and UDP‐GT and diminished activities of phase I (CYP450 and CYP2E1) and bacterial enzymes; this is considered to be a major mechanism of protection, not only against chemical stress but also against adverse effects of reactive metabolites of carcinogenic chemicals 42, 43. The ability to induce phase II detoxification enzymes without inducing activities of phase I enzymes might be considered beneficial and also an ideal quality of a chemopreventive agent, as this could enhance detoxification and excretion of carcinogens. The inhibitory effect of d‐carvone on activation of carcinogen‐activating enzymes and its stimulatory effect on activities of detoxifying enzymes authenticate the anti‐carcinogenic effect of d‐carvone.
In general, the mucosal lining of colonic epithelial cells is protected against toxic insult by mucin, which is a macromolecule composed of a peptide core linked via O‐glycosidic bonds to oligosaccharide chains rich in galactose and GalNAc. These mucins act as a lubricant, protect the mucosal surface from potentially injurious agents and support growth of normal bacterial flora 44. Many studies have demonstrated that evaluation of epithelial mucins and mucinase activity might be valuable markers to predict and monitor progression of colon cancer 45, 46. Increased activity of mucinase accompanied by reduced number of mucous secreting cells (goblet cells) observed in DMH‐exposed rats can be explained by the hypothesis that hypersecretion of mucinase may cause imbalance between mucus production, secretion and degradation, resulting in net reduction of the mucus blanket. This mucus depletion is thought to be one of the main factors contributing to epithelial cell invasion by mutagens and carcinogens. Modulation of gut microbial flora by DMH results in release of these carcinogen‐activating β‐glucuronidase and mucin‐degrading mucinase that culminates in colon carcinogenesis. Supplementation with d‐carvone to tumour‐bearing rats counteracts DMH‐induced toxicity as revealed by reduced activities of both β‐glucuronidase and mucinase.
Furthermore, our histopathological observations reveal that DMH induction produced a range of pathological abnormalities in the liver and colon. Liver histology of DMH‐alone‐exposed rats showed marked pathological alterations such as fatty change, Kupffer cell hyperplasia, nuclear pleomorphism and inflammatory cell infiltrate in the portal triad. DMH‐induced rat colonic tissue showed loss of epithelial integrity, dilated lumina, lymphoid aggregates and intense infiltration of inflammatory cells into the mucosal layer. However, oral supplementation with d‐carvone to DMH‐exposed rats reduced pathological alterations in the liver and colon validating d‐carvone as a promising anti‐carcinogenic and hepatoprotective agent during colon carcinogenesis.
Findings of the present study provide evidence that d‐carvone exerts inhibitory effects on DMH‐induced colon carcinogenesis, which could be attributed to its role in maintaining pro‐oxidant–antioxidant balance, detoxifying the carcinogen and also its anti‐proliferative effects. Among the three doses of d‐carvone, 10 mg/kg body weight effectively suppressed chemically induced colon carcinogenesis, probably by reducing neoplastic and inflammatory responses induced by DMH. Further long‐term pre‐clinical investigations are under way in our laboratory to confirm the chemopreventive potential of d‐carvone against colon carcinogenesis.
Conflict of interest statement
The authors declare that there are no conflicts of interest.
Acknowledgements
This work was supported by a grant from the Department of Biotechnology, Ministry of Science and Technology, New Delhi, India.
References
- 1. Rosenberg DW, Giardinal C, Tanaka T (2009) Mouse models for the study of colon carcinogenesis. Carcinogenesis 30, 183–196. [DOI] [PMC free article] [PubMed] [Google Scholar]
- 2. Bird RP (1995) Role of aberrant crypt foci in understanding the pathogenesis of colon cancer. Cancer Lett. 93, 55–71. [DOI] [PubMed] [Google Scholar]
- 3. Luo L, Li B, Pretlow TP (2003) DNA alterations in human aberrant crypt foci and colon cancers by random primed polymerase chain reaction. Cancer Res. 63, 6166–6169. [PubMed] [Google Scholar]
- 4. Johri RK (2011) Cuminum cyminum and Carum carvi: an update. Pharmacogn. Rev. 5, 63–72. [DOI] [PMC free article] [PubMed] [Google Scholar]
- 5. Aranganathan S, PanneerSelvam J, Nalini N (2009) Hesperetin exerts dose dependent chemopreventive effect against 1,2‐dimethylhydrazine induced rat colon carcinogenesis. Invest. New Drugs 27, 203–213. [DOI] [PubMed] [Google Scholar]
- 6. Karthikkumar V, Sivagami G, Vinothkumar R, Rajkumar D, Nalini N (2012) Modulatory efficacy of rosmarinic acid on premalignant lesions and antioxidant status in 1,2‐dimethylhydrazine induced rat colon carcinogenesis. Environ. Toxicol. Pharmacol. 34, 949–958. [DOI] [PubMed] [Google Scholar]
- 7. Schladt L, Wörner W, Setiabudi F, Oesch F (1986) Distribution and inducibility of cytosolic epoxide hydrolase in male Sprague‐Dawley rats. Biochem. Pharmacol. 35, 3309–3316. [DOI] [PubMed] [Google Scholar]
- 8. Ohkawa H, Ohishi N, Yagi K (1979) Assay for lipid peroxides in animal tissues by thiobarbituric acid reaction. Anal. Biochem. 95, 351–358. [DOI] [PubMed] [Google Scholar]
- 9. Yagi K (1987) Lipid peroxides and human disease. Chem. Phys. Lipids 45, 337–351. [DOI] [PubMed] [Google Scholar]
- 10. Donnan SK (1950) Thethiobarbituric acid test applied to tissues from rats treated in various ways. J. Biol. Chem. 182, 415–419. [Google Scholar]
- 11. Kakkar PS, Das B, Viswanathan PN (1984) A modified spectrophotometric assay for superoxide dismutase. Indian J. Biochem. Biophys. 21, 130–132. [PubMed] [Google Scholar]
- 12. Sinha KA (1972) Colorimetric assay of catalase. Anal. Biochem. 47, 389–394. [DOI] [PubMed] [Google Scholar]
- 13. Ellman GL (1959) Tissue sulphydryl groups. Arch. Biochem. Biophys. 82, 70–77. [DOI] [PubMed] [Google Scholar]
- 14. Rotruck JT, Pope AL, Ganther HE, Swanson AB, Hafeman DG, Hoekstra WG (1973) Selenium: biochemical role as a component of glutathione peroxidase. Science 179, 588–590. [DOI] [PubMed] [Google Scholar]
- 15. Carlberg I, Mannervik B (1985) Glutathione reductase. Methods Enzymol. 113, 484–490. [DOI] [PubMed] [Google Scholar]
- 16. Omura T, Sato R (1964) The carbon monoxide binding pigment of the liver microsomes. i. evidence for its hemoprotein nature. J. Biol. Chem. 239, 2370–2378. [PubMed] [Google Scholar]
- 17. Watt KC, Plopper CG, Buckpitt AR (1997) Measurement of cytochrome P4502E1 activity in rat tracheobronchial airways using high‐performance liquid chromatography with electrochemical detection. Anal. Biochem. 248, 26–30. [DOI] [PubMed] [Google Scholar]
- 18. Habig WH, Pabst MJ, Jokoby WB (1974) Glutathione‐S‐transferases the first step in mercapturic acid formation. J. Biol. Chem. 249, 7130–7139. [PubMed] [Google Scholar]
- 19. Ernster L, Danielson L, Ljunggren M (1962) DT‐diaphorse I purification from the soluble fraction of rat liver cytoplasm, and properties. Biochim. Biophys. Acta 58, 171–188. [DOI] [PubMed] [Google Scholar]
- 20. Isselbacher KJ, Chrabas MF, Quinn RC (1962) The solubilization and partial purification of glucuronyl transferase from rabbit liver microsomes. J. Biol. Chem. 237, 3033–3036. [PubMed] [Google Scholar]
- 21. Freeman HJ (1986) Effects of differing purified cellulose, pectin, and hemicellulose fiber diet on fecal enzymes in 1,2‐dimethylhydrazine‐induced rat colon carcinogenesis. Cancer Res. 46, 5529–5532. [PubMed] [Google Scholar]
- 22. Shiau SY, Chang GW (1983) Effects of dietary fiber on fecal mucinase and β‐glucuronidase activity in rats. J. Nutr. 113, 138–144. [DOI] [PubMed] [Google Scholar]
- 23. Lowry OH, Rosebrough NJ, Farr AL, Randall RJ (1951) Protein measurement with the folin phenol reagent. J. Biol. Chem. 193, 265–275. [PubMed] [Google Scholar]
- 24. Bird RP (1987) Observation and quantification of aberrant crypts in the murine colon treated with a colon carcinogen: preliminary findings. Cancer Lett. 37, 147–151. [DOI] [PubMed] [Google Scholar]
- 25. Mowry RW (1958) Observation on the use of sulphuric ether for the sulphation of hydroxyl groups in tissue sections. J. Histochem. Cytochem. 6, 82–83. [PubMed] [Google Scholar]
- 26. Sengottuvelan M, Senthilkumar R, Nalini N (2006) Modulatory influence of dietary resveratrol during different phases of 1,2‐dimethylhydrazine induced mucosal lipid‐peroxidation, antioxidant status and aberrant crypt foci development in rat colon carcinogenesis. Biochim. Biophys. Acta 1760, 1175–1183. [DOI] [PubMed] [Google Scholar]
- 27. O'Toole SM, Pegg AE, Swenberg JA (1993) Repair of O6‐methylguanine and O4‐methylthymidine in F344 rat liver following treatment with 1,2‐dimethylhydrazine and O6‐benzylguanine. Cancer Res. 53, 3895–3898. [PubMed] [Google Scholar]
- 28. Khan R, Sultana S (2011) Farnesol attenuates 1,2‐dimethylhydrazine induced oxidative stress, inflammation and apoptotic responses in the colon of Wistar rats. Chem. Biol. Interact. 193, 193–200. [DOI] [PubMed] [Google Scholar]
- 29. Manju V, Balasubramaniyan V, Nalini N (2005) Rat colonic lipid peroxidation and antioxidant status: the effects of dietary luteolin on 1,2‐dimethylhydrazine challenge. Cell. Mol. Biol. Lett. 10, 535–551. [PubMed] [Google Scholar]
- 30. Biasi F, Tessitore L, Zanetti D, Cutrin JC, Zingaro B, Chiarpotto E, et al (2002) Associated changes of lipid peroxidation and transforming growth factor beta1 levels in human colon cancer during tumour progression. Gut 50, 361–367. [DOI] [PMC free article] [PubMed] [Google Scholar]
- 31. Tanaka K, Kawabata K, Kakumoto M (1998) Citrus auraptene exerts dose dependent chemopreventive activity in rat large bowel tumourigenesis: the inhibition correlates with suppression of cell proliferation and lipid peroxidation and with induction of phase II drug metabolizing enzymes. Cancer Res. 58, 2550–2556. [PubMed] [Google Scholar]
- 32. Sivagami G, Karthikkumar V, Balasubramanian T, Nalini N (2012) The modulatory influence of p‐methoxycinnamic acid, an active rice bran phenolic acid, against 1,2‐dimethylhydrazine‐induced lipid peroxidation, antioxidant status and aberrant crypt foci in rat colon carcinogenesis. Chem. Biol. Interact. 196, 11–22. [DOI] [PubMed] [Google Scholar]
- 33. Nakagami K, Uchida T, Ohwada S, Koibuchi Y, Morishita Y (1990) Increased choline kinase activity in 1,2dimethylhydrazine induced rat colon cancer. Jpn. J. Cancer Res. 90, 1212–1217. [DOI] [PMC free article] [PubMed] [Google Scholar]
- 34. Badjatia N, Satyam A, Singh P, Seth A, Sharma A (2010) Altered antioxidant status and lipid peroxidation in Indian patients with urothelial bladder carcinoma. Urol Oncol. 28, 360–367. [DOI] [PubMed] [Google Scholar]
- 35. Szymonik‐Lesiuk S, Czechowska G, Stryjecka‐Zimmer M, Slomka M, Madro A, Celiński K, et al (2003) Catalase, superoxide dismutase, and glutathione peroxidase activities in various rat tissues after carbon tetrachloride intoxication. J. Hepatobiliary Pancreat. Surg. 10, 309–315. [DOI] [PubMed] [Google Scholar]
- 36. Young IS, Woodside JV (2001) Antioxidants in health and diseases. J. Clin. Pathol. 54, 176–186. [DOI] [PMC free article] [PubMed] [Google Scholar]
- 37. Giftson JS, Jayanthi S, Nalini N (2010) Chemopreventive efficacy of gallic acid, an antioxidant and anticarcinogenic polyphenol, against 1,2‐dimethyl hydrazine induced rat colon carcinogenesis. Invest. New Drugs 28, 251–259. [DOI] [PubMed] [Google Scholar]
- 38. Umesalma S, Sudhandiran G (2010) Chemo modulation of the antioxidative enzymes and peroxidative damage in the colon of 1,2‐dimethyl hydrazine‐induced rats by ellagic acid. Phytother. Res. 24, 114–119. [DOI] [PubMed] [Google Scholar]
- 39. Ding X, Kaminsky LS (2003) Human extra hepatic cytochromes P450: function in xeno‐biotic metabolism and tissue‐selective chemical toxicity in the respiratory and gastrointestinal tracts. Annu. Rev. Pharmacol. Toxicol. 43, 149–173. [DOI] [PubMed] [Google Scholar]
- 40. Rowland IR, Rumney CJ, Coutts JT, Lievense LC (1998) Effect of Bifidobacterium longum and inulin on gut bacterial metabolism and carcinogen‐induced aberrant crypt foci in rats. Carcinogenesis 19, 281–285. [DOI] [PubMed] [Google Scholar]
- 41. Dasgupta T, Banerjee S, Yadava PK, Rao AR (2004) Chemopreventive potential of Azadirachtaindica (Neem) leaf extract in murine carcinogenesis model systems. J. Ethnopharmacol. 92, 23–36. [DOI] [PubMed] [Google Scholar]
- 42. Fisher MB, Paine MF, Strelevitz TJ, Wrighton SA (2001) The role of hepatic and extra hepatic UDP‐glucuronosyl transferases in human drug metabolism. Drug Metab. Rev. 33, 273–297. [DOI] [PubMed] [Google Scholar]
- 43. Dasgupta RK, Adamson PJ, Davies FE, Rollinson S, Roddam PL, Ashcroft AJ, et al (2003) Polymorphic variation in GSTP1 modulates outcome following therapy for multiple myeloma. Blood 102, 2345–2350. [DOI] [PubMed] [Google Scholar]
- 44. Allen A, Bell A, Mantle M, Pearson JP (1982) The structure and physiology of gastrointestinal mucus. Adv. Exp. Med. Biol. 144, 115–133. [DOI] [PubMed] [Google Scholar]
- 45. Aksoy N, Corfield AP, Sheehan JK (2000) Preliminary study pointing out a significant alteration in the biochemical composition of MUC2 in colorectal mucinous carcinoma. Clin. Biochem. 33, 167–173. [DOI] [PubMed] [Google Scholar]
- 46. Salim EI, Abou‐Shafey AE, Masoud AA, Elgendy SA (2011) Cancer chemopreventive potential of the Egyptian flax seed oil in a rat colon carcinogenesis bioassay‐implications for its mechanism of action. Asian Pac. J. Cancer Prev. 12, 2385–2392. [PubMed] [Google Scholar]