

Abstract
Abstract. The applicability of flow cytometry (FCM) to analyse cell‐cycle distribution and mitotic cells in Hydra oligactis and Hydra vulgaris is demonstrated. The freshwater polyps H. vulgaris and H. oligactis are well‐accepted animal models for studying cell proliferation, regeneration and differentiation. Disintegrated animals were labelled for FCM analysis according to the method of Nuesse et al. [(1990) Flow cytometric analysis of G1 and G2/M‐phase subpopulations in mammalian cell nuclei using side scatter and DNA content measurements. Cytometry 11, 813]. Proliferation and regeneration experiments, in the absence or presence of the oligopeptide head activator, were quantified. Cell‐cycle analysis of different parts of the animals shows low proliferation in the head region and high proliferation in the gastric and foot regions. Cell‐cycle analysis of different parts of Hydra, comparison of H. oligactis and H. vulgaris, as well as pharmacological treatment, yielded results that are in agreement with prior microscopic analysis. Our results demonstrate that FCM is an appropriate technique for quantifying proliferation in this animal model. It can be used for basic research on development, regeneration and differentiation as well as for innovative drug investigation and toxicology studies.
INTRODUCTION
Freshwater polyps of Hydra (Hydra vulgaris, former Hydra attenuata, and Hydra oligactis, former Hydra fusca) belong to the metazoan phylum Cnidaria, are believed to be one of the most ancient animal groups and are the first in evolution of developed specialized tissues. The fresh‐water polyp Hydra is a well‐accepted animal model for the study of cell proliferation and differentiation (reviewed by Meinhardt 1996; Galliot & Schmid 2002; Holstein et al. 2003). Hydra has a bipolar cellular organization along a single axis of symmetry. Because of its high capacity for regeneration, Hydra is a suitable system for studying morphogenetic processes, not only in developing but also in regenerating animals (Müller 1996). Polarity is generated by two types of gradient and is maintained even during regeneration of new animals from very small pieces (Bode & Bode 1984).
Besides its major impact on developmental biology research for many years, Hydra has become of striking importance as a model organism. The successful application of molecular techniques has linked insights into molecular circuitry with cell proliferation and differentiation events. These breakthroughs include the discovery of transcription factor genes and the generation of knock‐out phenotypes using antisense and RNA interference techniques (Fenger et al. 1994; Cardenas & Salgado 2003; Kaloulis et al. 2004).
Hydra can be compared in many regards with an early‐stage embryo, as its body consists of three stem cell populations that are retained through the lifetime of the animal: ectodermal, endodermal and interstitial cells. Hydra species have therefore become important test organisms for environmental pollutants and drug treatment response (Arkhipyhuk & Malinovskaya 2002; Karntanut & Pascoe 2002; Pascoe et al. 2002; Lum et al. 2003).
Epithelial stem cells can either differentiate into head‐ or foot‐specific cells. Interstitial cells consist of pluripotent stem cells and precursor cells which can differentiate into neurones, nematocytes and gland cells. They are uniformly distributed along the body column but are absent from head and foot tissue. The formation of head‐specific tissue is regulated by a head activator (HA), which has been isolated from Hydra tissue (Bodenmüller & Schaller 1981). Besides differentiating epithelial cells into head‐specific tissues, HA also acts as a mitogen, increasing the number of S‐phase cells about 12 h after stimulation (Schaller 1976). Most organisms regulate their cell cycle by check points in the G0/G1‐phase. In Hydra, however, terminal differentiation of either head‐ or foot‐specific ectodermal epithelial cells starts and terminates in the G2‐phase, implicating restriction points for cell‐cycle regulation in the G2‐phase (Dübel & Schaller 1990). Proliferation events have been mainly accessed by microscopic counting of mitotic nuclei following Hoechst 33258 staining, by determining the nuclear content of single cells using a microscope photometer, or by pulse labelling with 5′‐bromo‐2′‐deoxyuridine (BrdU) and staining with an anti‐BrdU antibody (Dübel et al. 1987; Dübel 1989). In all of these cases, for statistical relevance large populations of cells needed to be analysed, making the methods time consuming.
In the present study, we demonstrate the applicability of flow cytometry (FCM) to measure cell cycle and proliferation in individual Hydra cells that were obtained by disintegration of whole Hydra individuals or of their different body‐parts. The technique can be used conveniently to analyse proliferation events in this important animal system during HA‐induced cell proliferation or regeneration events after dissecting live animals. We show here that the results of the cell‐cycle distribution are in accordance with previous microscopic evaluation (David & Campbell 1972; Gierer et al. 1972; Campbell & David 1974; David & Gierer 1974; David & Murphy 1977; Dübel et al. 1987; Dübel & Little 1988; Hoffmeister 1991). The technique is time saving and an appropriate tool for quantification of small differences between stimulated and unstimulated cells as the cell‐cycle distribution of large populations can be analysed.
MATERIALS AND METHODS
Hydra culture
Hydra vulgaris and Hydra oligactis were cultured in 0.5 mm sodium phosphate, 1 mm CaCl2, 0.1 mm MgCl2, 0.1 mm KCl, pH 7.6 (this and all following reagents from Sigma‐Aldrich, Deisenhofen, Germany). They were fed daily with nauplii of Artemia salina and washed 6 h after feeding. Prior to experiments Hydras were starved for 1 day.
Disintegration of whole animals or parts of animals
For determination of cell‐cycle distributions, either whole animals (Fig. 1: schematic morphology of Hydra) were used or animals dissected in head, stomach and foot, followed by mechanical disintegration into single cell suspensions (Gierer et al. 1972). To this end, animals were transferred into isolation medium (KCl 3.6 mm, CaCl2 6 mm, MgSO4 1.3 mm, Na‐citrate 6 mm, Na‐pyruvate 6 mm, glucose 6 mm, TES buffer, 12.5 mm, phenol‐red 100 mg/l, in distilled water at pH 6.9, 70 mOsm). For disintegration, 100 animals or 100 parts of animals were then placed in a plastic tube with 500 µl of isolation medium containing 7% acetic acid, 7% glycerol and 2.5 mg/ml pronase and pipetted through glass pipettes with subsequently decreasing gauge sizes starting at about 1‐mm diameter and decreasing to about 100 µm. Prior to use, pipette tips were melted to decrease the opening size and to remove sharp edges.
Figure 1.
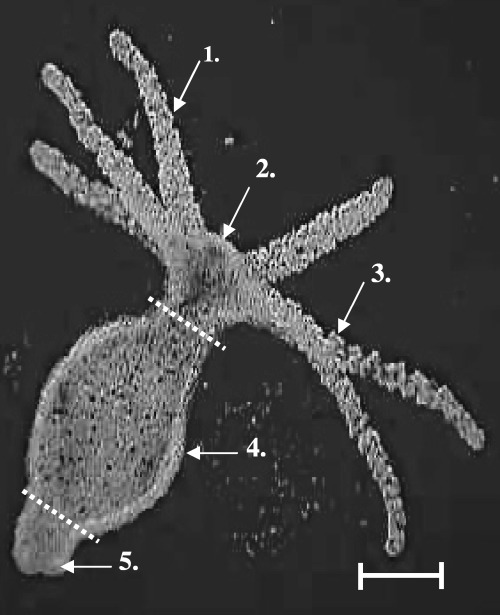
Morphology of Hydra. Microscope image of Hydra vulgaris: 1. tentacle; 2. hypostome; 3. nematocytes; 4. gastrum; 5. foot. Dotted lines indicate where the animals were cut for head, gastric and foot samples. Scale bar indicates 100 µm.
Determination of cell‐cycle distribution and mitotic index by FCM
The single cell suspensions obtained were used for cell nucleus preparation, DNA staining with PI and subsequent cell‐cycle analysis by FCM according to the method of Nuesse et al. (1990). In brief, isolated cells were spun down (400 g, 5 min) and roughly 106 cells were suspended in 500 µl staining solution I (NaCl 10 mm, NA‐citrate 1.7 mm, RNase 10 µg/ml, Nonidet P‐40 0.03%, PI 60 µm). After 30 min incubation at room temperature, staining solution II (citric acid 1.5%, sucrose 0.25 m, PI 90 µm) was added, and nuclei were stained with PI, on ice for 1 h. Before analyses by FCM, the suspension was filtered through a nylon filter, mesh size of 50 µm, to remove clumps.
FCM analysis was performed on an EPICS 751 cell sorter (Beckman‐Coulter, Hialeah, FL, USA) that was equipped with an argon‐ion laser tuned to the 488 nm emission line (laser power 50 mW; Coherent, Palo Alto, CA, USA). PI was excited and the emitted PI fluorescence was collected by a 590‐nm long‐pass filter (Omega Optical, Brattleboro, VT, USA). Side‐scatter signals were measured by means of a dichroic 500 nm long‐pass mirror, reflected blue scattered light, and detected by a 488‐nm band‐pass filter. Per sample, data of 20 000 nuclei were collected. Data were analysed offline using the DAS software, kindly provided by Dr W. Beisker (Beisker 1994).
All experiments were carried out at a constant temperature of 18 °C. For regeneration assays, gastric regions of animals were cut and then incubated for 3 h in culture medium alone or, in order to block cells in mitosis, in culture medium containing 0.5 µg/ml nocodazol (Dübel & Little 1988). Proliferation experiments with the Hydra neuropeptide HA (Schaller 1976) were performed as follows: synthetic HA (pGlu‐Pro‐Pro‐Gly‐Gly‐Ser‐Lys‐Val‐Ile‐Leu‐Phe, Bachem, Bubendorf, Switzerland) was solubilized in trifluoroethanol and lyophilized in 5‐nmol samples. Lyophilized HA samples were re‐suspended in 250 µl 3M ammonium sulphate and 250 µl distilled water and then diluted to its final concentration in Hydra culture medium. For determination of cell‐cycle distribution and percentage of cells undergoing mitosis, sliced gastric regions were incubated for 3 h in the absence or presence of HA (10−12 to 10−9 m). Then gastric regions were disintegrated and cells were stained with PI, used for determination of cell‐cycle distribution, and the percentage of cells in mitosis was determined by FCM. Data analysis was performed as described in Nuesse et al. (1990).
RESULTS
Determination of cell‐cycle distribution by FCM in disintegrated cells from Hydra oligactis
Using the preparation and staining method of Nuesse et al. (1990), cell‐cycle distributions could be easily analysed by FCM. Cell‐cycle distributions were either determined in disintegrated cells from whole animals or from dissected parts containing head, foot or gastric regions (see Fig. 1 for cut positions). The resulting coefficients of variation for the G0/G1‐peak of cell‐cycle distribution were generally below 5% in untreated animals. The fraction of disrupted nuclei appearing as a sub‐G1 population with low PI fluorescence was dependent on the number of animals that had been used in the experiment for disintegration. This fraction was above 70% of all events if 10 or fewer animals were used. Best results, that is, lowest fraction of nuclear debris, were obtained when at least 100 animals or parts of animals were used for disintegration (Fig. 2).
Figure 2.
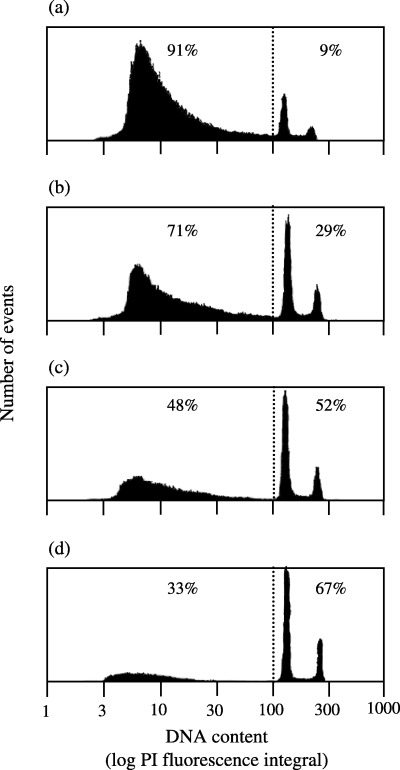
Quality of the Hydra cell nuclei preparation depends on the number of animals used for disintegration. Increasing numbers of whole Hydra oligactis animals (a, 5; b, 10; c, 50; d, 100) were mechanically disintegrated into single cell suspensions, cell nuclei were prepared as detailed in MATERIALS and METHODS. Cell nuclei were stained with PI for cell‐cycle analysis and determination of the percentage of cell debris. Cell suspensions were measured by FCM. Particles with fluorescence intensity below the dotted lines were considered as cell debris. The fractions of cell debris and intact stained nuclei are given as inserts.
Whole animals or parts of animals displayed differences in their cell‐cycle distributions. Figure 3 shows a representative experiment of Hydra oligactis cell‐cycle distribution. Cells isolated from the head region showed the highest fraction of G0/G1‐phase, whereas those from the foot region showed the highest fraction in S‐ and G2‐phase (Fig. 3). These differences are as a result of a high number of nematocytes (mostly G1‐phase) in the tentacles of the head region, of many interstitial cells (i‐cells, stem cells, 50% in S‐phase) in the gastric region and a high number of gland and epithelial cells in the foot (> 50% blocked in G2). The results of the cell‐cycle distribution were in accordance with microscopic evaluations in H. oligactis from the literature as shown in Table 1. In this table, data published in several studies are summarized (Gierer et al. 1972; Campbell & David 1974; Dübel et al. 1987; Dübel 1989; Zacharias et al. 2004). Similarly, FCM data on H. vulgaris were found to be in agreement with already published data based on microscopic counting (Table 2; David & Gierer 1974; Dübel & Little 1988; Hoffmeister 1991).
Figure 3.
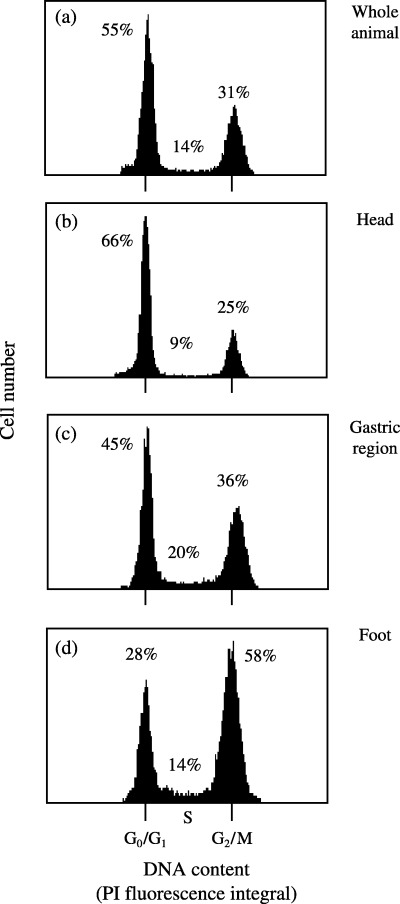
Cell‐cycle distributions in disintegrated cells from Hydra oligactis (entire animals or dissected parts). Cell suspension obtained from whole animals or parts following cutting of animals in heads, gastric regions and feet were macerated according to Gierer et al. (1972), and the single cell suspensions were stained with PI for cell‐cycle measurements. (a–d) Representative measurements of cell‐cycle distributions of whole animals: (a) head regions containing nematocytes, epithelial cells, and nerve cells; (b) gastric regions containing epithelial and interstitial cells; (c) feet regions containing gland and mucous cells, epithelial cells, and nerve cells (d). Cell‐cycle distributions are given as percentage of the whole analysed population. The data are representative for at least three independent experiments. Ranges of measured minimal and maximal values are given in Table 1.
Table 1.
Comparison of cell‐cycle distribution and mitotic index in H. oligactis determined by flow cytometry (FCM) or microscopy (fluorescence microscopy or microscope photometry, data from various sources, see Results). Cell‐cycle distributions and mitotic index are given as range of measured minimal and maximal values. (FCM, range of at least three independent experiments). Microscope data from David & Gierer (1974), David & Murphy (1977), Dübel & Little (1988) and Hoffmeister (1991)
| Tissue | Method | G0/G1 (%) | S (%) | G2/M (%) | M (%) |
|---|---|---|---|---|---|
| Total | FCM | 50–64 | 16–29 | 15–30 | 0.2–0.6 |
| Microscope | 31–37 | 24–34 | 30–42 | 1.4–2.1 | |
| Head | FCM | 55–66 | 7–28 | 11–27 | 0.4–0.6 |
| Microscope | 68–78 | 4–10 | 19–25 | 0.2–0.7 | |
| Gastrum | FCM | 41–58 | 17–37 | 17–34 | 0.8–1.2 |
| Microscope | 22–32 | 23–39 | 23–50 | 1.8–2.4 | |
| Foot | FCM | 26–45 | 17–40 | 19–52 | 1.5–1.9 |
| Microscope | 28–42 | 16–32 | 20–66 | 1.1–2.4 |
Table 2.
Determination of cell‐cycle distribution and mitotic index in H. vulgaris by FCM or microscopy (data from various sources, see Results). Cell‐cycle distributions are given as range of measured minimal and maximal values; for mitotic index no comparable data were available from the literature. (FCM, range from at least three independent experiments). Microscopic data from Gierer et al. (1972), David & Campbell (1972), Campbell & David (1974) and Dübel et al. (1987)
| Tissue | Method | G0/G1 (%) | S (%) | G2/M (%) |
|---|---|---|---|---|
| Total | FCM | 55–65 | 8–22 | 16–34 |
| Microscope | 46–51 | 20–21 | 30–33 | |
| Head | FCM | 64–71 | 6–9 | 22–29 |
| Microscope | 78–83 | 4–9 | 13–16 | |
| Gastrum | FCM | 40–45 | 15–20 | 36–45 |
| Microscope | 29–38 | 26–30 | 33–36 | |
| Foot | FCM | 28–47 | 9–21 | 32–60 |
| Microscope | 30–39 | 20–23 | 41–47 |
Increase in G2 phase and determination of the percentage of cells in mitosis following metaphase block
In order to prove the validity of FCM to determine cell‐cycle distribution and mitotic index, entire H. oligactis specimens were incubated in the absence or presence of nocodazol for 6 h and then disintegrated and analysed for cell‐cycle distribution (Fig. 4). Nocodazol arrests proliferating cells in the G2‐phase (Dübel & Little 1988), resulting in an increase of G2/M‐phase cells from 20.1 ± 3.6% (untreated control) to 37.5 ± 3.3% in the presence of 0.5 µg/ml nocodazol (P < 0.005, student's t‐test).
Figure 4.
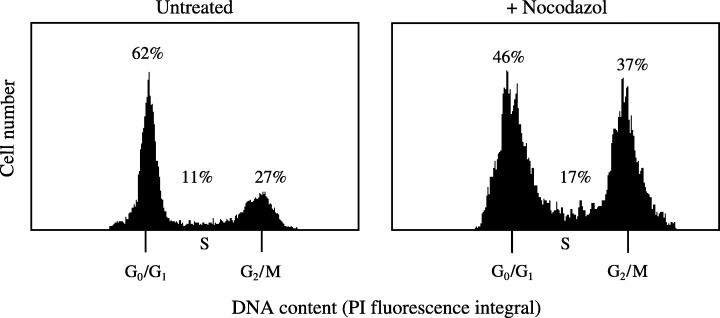
Proliferation block of Hydra oligactis in G2/M phase by nocodazol. Gastric regions from Hydra were obtained by dissection. Cuts were carried out as indicated in Figure 1. Regeneration assays were performed for 6 h in absence or presence of 0.5 µg/ml nocodazol that blocks cell division in the G2/M‐phase. Following incubation, the tissues were macerated and cell nuclei were prepared as detailed in MATERIALS and METHODS and were stained with PI. The percentage of cells in G2‐phase was increased because of the mitotic block by nocodazol. Cell‐cycle distributions are given as percentages of all nuclei. In the presence of nocodazol, an increase of cells in G2/M phase from 20.1 ± 3.6 to 37.5 ± 3.3% (mean value ± standard error) was observed. (Mean of six independent experiments; P < 0.05, unpaired student's t‐test.)
FCM can also be used to determine the mitotic index during regeneration of animals (Fig. 5). In these experiments, the head region of H. oligactis was removed by cutting, and the regeneration of the head by proliferation of cells in the gastric region was measured as an increase of cells in found in mitosis. In order to determine mitotic indices by FCM, a bivariate analysis (DNA versus side‐scatter) was employed according to Nuesse et al. (1990), which allowed the separation of mitotic nuclei from other nuclei based on their increased side‐scatter values. The localization of cells undergoing mitosis was verified in experiments where cells were arrested in mitosis by a metaphase block in the presence of nocodazol (Fig. 5; cell population in boxed area). This population was separated by cell sorting and confirmed by microscopic evaluation to contain exclusively mitotic cell nuclei only (data not shown).
Figure 5.
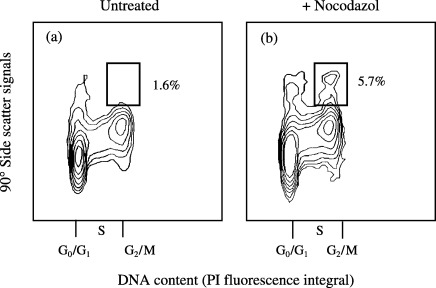
Mitotic index in regenerating gastric regions of Hydra oligactis. Bivariate analysis of DNA content versus side scatter (Nuesse et al. 1990) was employed in analogy to mammalian cells, in order to detect mitotic cell nuclei with high 90° side‐scatter signals. Gastric regions were obtained by dissection of entire animals. Regeneration assays were carried out for 2 h with or without 0.5 µg/ml nocodazol. Cells appearing in the boxed area were separated by cell sorting, and sorted cells were identified as mitotic cells by microscopic evaluation (not shown). The data are representative of three independent experiments. Mean values ± standard errors for mitotic indices in the absence and presence of nocodazol were 1.5 ± 0.2 and 5.9 ± 0.4%, respectively (mean of at least three experiments, P < 0.05).
Detection and quantification of head‐activator (HA)‐induced proliferation in Hydra HA stimulates cell proliferation in Hydra
This was brought about by incubation of freshly cut gastric regions with HA (10−10 m) for 3 h. Following incubation, animals were disintegrated and cell nuclei were stained. Figure 6(a and b) show a typical experiment in which cell‐cycle distribution and mitotic indices of cells from untreated gastric regions (Fig. 6a) were compared with those which had been treated with HA (10−10 m) (Fig. 6b) or nocodazol (Fig. 6c).
Figure 6.
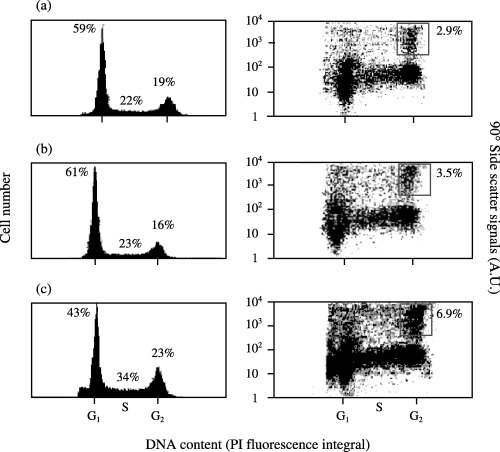
Quantification of head‐activator‐induced proliferation of the gastrum of Hydra oligactis. For induction of cell proliferation in Hydra, gastric regions were kept untreated (a)or were stimulated for 3 h with 10−10 m head activator (HA) (b) or treated with nocodazol (0.5 µg/ml) for 3 h (c) to arrest cells in mitosis and to localize the mitotic cell population (boxed areas in right panels). The left panels show cell‐cycle distributions of Hydra cells in the presence and absence of nocodazol or HA. In the right panels, mitotic indices of the respective populations were quantified. The mitotic index was determined as the fraction of nuclei in the boxed area over total nuclei.
An increase of the mitotic cell population was found following treatment by HA (Fig. 6a and b, right panels). The positions of the gating region for mitotic nuclei were again verified in the presence of nocodozal (Fig. 6c, right panel) followed by cell sorting and microscopic identification of the respective population as cells being in mitosis only (data not shown). Figure 6(a and b) (right panels) shows a representative experiment in which the mitotic index in the presence of HA (10−10 m) increased from 2.9 to 3.5%. The average mitotic index in the presence of HA (10−10 m) as the result of three independent experiments was 3.8 ± 0.5% compared with the average mitotic index of 2.8 ± 0.4% (mean ± standard deviation) of the untreated controls (P < 0.03 as determined by the unpaired student's t‐test). Using comparable conditions, Schaller (1976) used microscopic analysis to determine the increase in mitotic index of interstitial cells following treatment of Hydra specimens with HA. Mitotic indices increased from 2.5 ± 0.5 to 4.1 ± 0.8%, from 2.0 ± 0.5% to 3.4 ± 0.6%, from 1.8 ± 0.7 to 3.5 ± 0.6%, and from 1.5 ± 0.5 to 3.0 ± 0.7% (HA versus untreated control, respectively). The HA‐induced effect on stimulation of mitosis was dose dependent, reaching maximal values at HA concentrations of 10−11, decreasing at 10−9 and 10−10 m HA (Fig. 7). Increases in mitosis in the presence of 10−11 and 10−10 m HA versus control were significant (student's t‐test P < 0.05).
Figure 7.
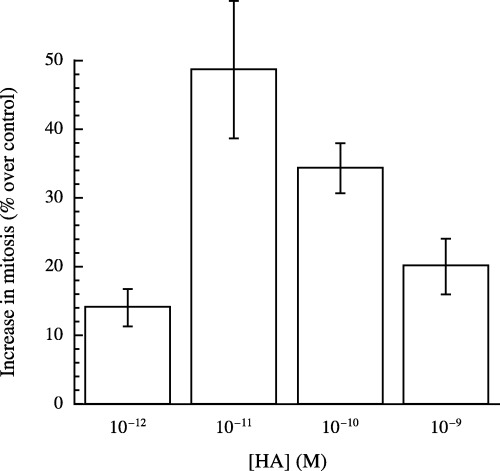
Determination of dose dependence of HA‐induced stimulation of H. oligactis mitotic index by flow cytometry. Proliferation stimulation assays of Hydra single‐cell suspensions were performed for 2 h in the absence (control) or presence of HA (10−10 to 10−9 m). Percentages of cells in mitosis were determined as detailed in legends to 5, 6 and in MATERIALS and METHODS. Data are mean values ± standard error of at least three independent experiments. The increases in mitotic index obtained in the presence of 10−11 and 10−10 m HA versus control were statistically significant (P < 0.05).
The obtained results are in accordance with the results of Neubauer et al. (1990), who characterized a high‐affinity HA receptor inducing proliferation at very low concentration of HA (> 10−13 m) and differentiation at higher HA concentrations (> 10−11 m). It is worth mentioning that the increase in percentage of mitosis, induced by HA (Figs 6a and b, right panels), correlates with a minor decrease in the percentage of cells in G2‐phase and an increase of those in G1‐phase (Figs 6a and b, left panels), as proliferating cells already accumulated in G2‐phase pass through mitosis (Dübel et al. 1987; Dübel 1989). We have shown that analysis of a relatively small increase of mitotic index in Hydra, as caused by HA (Fig. 6a and b, right panels) can be quantified by analysing a large number of cells by FCM.
Comparison of cell‐cycle distribution of different parts of Hydra oligactis and Hydra vulgaris
We have determined cell‐cycle distribution for entire animals and body parts of H. oligactis and H. vulgaris (1, 2). In the head region of both species, most cells are in the G1‐phase (up to 70% of the whole population), whereas less than 30% are in G2‐phase. Proliferation is increased in the gastric and foot regions, as determined by the percentage of cells in S‐phase. Maximal rates of proliferation and G2 were found in the foot region where up to 60% of the entire cell population were in S‐ and G2‐phase. In accordance with cell‐cycle distributions, the mitotic index was considerably higher in the gastric and the foot region of H. oligactis when compared with the head region. The discrepancy with microscopic data may result from the enormous number of cells which were analysed by FCM compared with the relatively low number of cells counted by microscopic analysis. The data for cell‐cycle distribution largely agree with findings based on microscopic evaluations listed in 1, 2. As an example, H. oligactis as a whole contain less S‐phase cells than H. vulgaris (mean FCM: 23 versus 16%; microscope: 29 versus 20%). Data for H. oligactis cell‐cycle and mitotic index are from the following sources (David & Gierer 1974; David & Murphy 1977; Dübel & Little 1988; Hoffmeister 1991). Cell cycle distribution in H. vulgaris has been investigated by the following workers (David & Campbell 1972; Gierer et al. 1972; Campbell & David 1974; Dübel et al. 1987).
DISCUSSION
We have developed a flow cytometric method, capable of rapidly determining cell proliferation events of disintegrated cells from intact H. oligactis and H. vulgaris, or their body parts, and from animals exposed to external stimuli. Hydra have a simple body plan with a head and tentacles at one side and a foot at the opposite end of a gastric column (see Fig. 1). In the intact animal, proliferation occurs as epithelial layers are continuously displaced along the body column. We have determined cell‐cycle distribution and mitotic indices of Hydra and found them to be in accordance with data obtained by BrdU labelling or mitotic cell counting. In contrast to microscopic evaluations of proliferation, FCM has the advantage that large populations of cells can be monitored in a very short time period, allowing the determination of small changes with high accuracy.
FCM has been extensively used to study cell‐cycle distribution and proliferation in mammalian cells. Furthermore, in invertebrates, cells can disintegrate from complex organisms, for example, male accessory glands of mealworm pupae (Happ et al. 1985) and protozoa such as African trypanosomes and malaria parasites (Jacobberger et al. 1992; Mutomba et al. 1997). These now can be analysed conveniently to determine their cell‐cycle distribution. Protocols for staining cell nuclei and analysis by flow cytometry have been extended to use for plant cells (Sans et al. 1997; Lucretti et al. 1999). However, to the best of our knowledge, cell‐cycle analysis by FCM has not been used previously for Hydra species.
We have shown here that cell‐cycle distribution of Hydra cells can be analysed easily by FCM. The fraction of cell nuclei in mitosis can be determined by using the method of Nuesse et al. (1990), which was originally developed to measure mitosis in mammalian cells. This method is based on the detection of high scattering properties of cells in G2 phase undergoing mitosis. The percentage of this fraction over the total cell population was increased when the cells had been treated with the metaphase blocker nocodazol during cell proliferation. The mitotic population with high light scattering characteristics could be clearly separated from the remaining population by cell sorting. Our FCM data on cell cycle and proliferation of Hydra oligactis and Hydra vulgaris, and microscopic data from others sources (David & Campbell 1972; Gierer et al. 1972; Campbell 1974; David & Gierer 1974; David & Murphy 1977; Dübel et al. 1987; Dübel & Little 1988; Hoffmeister 1991) (see 1, 2) were largely in agreement. Discrepancy of data collected by FCM from microscopic data, such as mitotic indices and percentages of cells in G2‐phase isolated from entire animals, can be explained by the different numbers of analysed cells. The huge number of cells analysed by FCM also makes small differences between two data sets statistically relevant. For instance, HA‐induced proliferation of Hydra cells yields an increase of mitotic index up to 50% above baseline.
In summary, FCM is an appropriate technique for quantification of cell proliferation by measuring cell‐cycle and mitotic index at the same time. This technique has already been shown to be extremely useful for detection of cell proliferation in neoplasms as well as in vitro cultures. Hydra is not only a model for early embryogenesis, but also demonstrates remarkable regenerative capabilities which appear to be conserved over large phylogenetic stretches with evidence for a homologue origin of regenerative capability (reviewed by Löwenheim 2003). In view of that, our assay, rapid analysis of proliferation by FCM, following modulation of gene expression could be helpful for linking activation of certain genes with biological function. Furthermore, this new approach should enable rapid high‐throughput analysis of the effects of environmental pollutants and drugs on regeneration capability of using Hydra as a biosensors.
ACKNOWLEDGEMENTS
The authors wish to thank Prof. H. C. Schaller in whose laboratory this work was carried out and Dr S. A. Hoffmeister‐Ullerich for providing us with Hydra vulgaris and Hydra oligactis. HU is currently supported by a grant from FAPESP (Fundação de Amparo à Pesquisa do Estado de São Paulo) and a fellowship from CNPq (Conselho Nacional de Desenvolvimento Científico e Tecnológico), Brazil.
REFERENCES
- Arkhipchuk VV, Malinovskaya MV (2002) Quality of water types in Ukraine evaluated by WaterTox bioassays. Environ. Toxicol. 17, 250. [DOI] [PubMed] [Google Scholar]
- Beisker W (1994) A new combined integral‐light and slit‐scan data analysis system (DAS) for flow cytometry. Comp. Methods Programs Biomed. 42, 15. [DOI] [PubMed] [Google Scholar]
- Bode MP, Bode HR (1984) Formation of pattern in regenerating tissue pieces of Hydra attenuata. III. The shaping of the body column. Dev. Biol. 106, 315. [DOI] [PubMed] [Google Scholar]
- Bodenmüller H, Schaller HC (1981) Conserved amino acid sequence of a new neuropeptide, the head activator, from coelenterates to humans. Nature 293, 579. [DOI] [PubMed] [Google Scholar]
- Campbell RD, David CN (1974) Cell cycle kinetics and development of Hydra attenuata. II. Interstitial cells. J. Cell Sci. 16, 349. [DOI] [PubMed] [Google Scholar]
- Cardenas MM, Salgado LM (2003) STK, the src homologue, is responsible for the initial commitment to develop head structures in Hydra . Dev. Biol. 264, 495. [DOI] [PubMed] [Google Scholar]
- David CN, Campbell RD (1972) Cell cycle kinetics and development of Hydra attenuata. I. Epithelial cells. J. Cell Sci. 11, 557. [DOI] [PubMed] [Google Scholar]
- David CN, Gierer A (1974) Cell cycle kinetics and development of Hydra attenuata. III. Nerve and nematocyte differentiation. J. Cell Sci. 16, 359. [DOI] [PubMed] [Google Scholar]
- David CN, Murphy S (1977) Characterization of interstitial stem cells in Hydra by cloning. Dev. Biol. 58, 372. [DOI] [PubMed] [Google Scholar]
- Dübel S (1989) Cell differentiation in the head of Hydra . Differentiation 41, 99. [Google Scholar]
- Dübel S, Little M (1988) Microtubule‐dependent cell cycle regulation is implicated in the G2 phase of Hydra cells. J. Cell Sci. 91, 347. [DOI] [PubMed] [Google Scholar]
- Dübel S, Schaller HC (1990) Terminal differentiation of ectodermal epithelial stem cells of Hydra can occur in G2 without requiring mitosis or S phase. J. Cell Biol. 110, 39. [DOI] [PMC free article] [PubMed] [Google Scholar]
- Dübel S, Hoffmeister SAH, Schaller HC (1987) Differentiation pathways of ectodermal epithelial cells in Hydra . Differentiation 35, 181. [DOI] [PubMed] [Google Scholar]
- Fenger U, Hoffmannn M, Galliot B, Schaller HC (1994) The role of the cAMP pathway in mediating the effect of head activator on nerve‐cell determination and differentiation in Hydra . Mech. Dev. 47, 115. [DOI] [PubMed] [Google Scholar]
- Galliot B, Schmid V (2002) Cnidarians as a model system for understanding evolution and regeneration. Int. J. Dev. Biol. 46, 39. [PubMed] [Google Scholar]
- Gierer A, Berking S, Bode H, David CN, Flick K, Hansmann G, Schaller H, Trenkner E (1972) Regeneration of Hydra from reaggregated cells. Nat. New Biol. 239, 98. [DOI] [PubMed] [Google Scholar]
- Happ GM, MacLeod BJ, Szopa TM, Bricker CS, Lowell TC, Sankel JH, Yuncker C (1985) Cell cycles in the male accessory glands of mealworm pupae. Dev. Biol. 107, 314. [DOI] [PubMed] [Google Scholar]
- Hoffmeister SA (1991) Analysis of a foot regeneration deficient strain of Hydra oligactis . Mech. Dev. 35, 181. [DOI] [PubMed] [Google Scholar]
- Holstein TW, Hobmayer E, Technau U (2003) Cnidarians: an evolutionary conserved model system for regeneration. Dev. Dyn. 226, 257. [DOI] [PubMed] [Google Scholar]
- Jacobberger JW, Horan PK, Hare JD (1992) Cell cycle analysis of asexual stages of erythrocytic malaria parasites. Cell Prolif. 25, 431. [DOI] [PubMed] [Google Scholar]
- Kaloulis K, Chera S, Hassel M, Gauchat D, Galliot B (2004) Reactivation of developmental programs: the cAMP response element‐binding protein is involved in Hydra head regeneration. Proc. Natl Acad. Sci. USA 101, 2363. [DOI] [PMC free article] [PubMed] [Google Scholar]
- Karntanut W, Pascoe D (2002) The toxicity of copper, cadmium and zinc to four different Hydra (Cnidaria: Hydrozoa). Chemosphere 47, 1059. [DOI] [PubMed] [Google Scholar]
- Löwenheim H (2003) Regenerative medicine for diseases of the head and neck: principles of in vivo regeneration. DNA Cell Biol. 22, 571. [DOI] [PubMed] [Google Scholar]
- Lucretti S, Nardi L, Moretti F, Gualberti G, Dolezel J (1999) Bivariate flow cytometry DNA/BrdUrd analysis of plant cell cycle. Methods Cell Sci. 21, 155. [DOI] [PubMed] [Google Scholar]
- Lum KT, Huebner HJ, Li Y, Phillips TD, Raushel FM (2003) Organophosphate nerve agent toxicity in Hydra attenuata . Chem. Res. Toxicol. 16, 953. [DOI] [PubMed] [Google Scholar]
- Meinhardt H (1996) Models of biological pattern formation: common mechanism in plant and animal development. Int. J. Dev. Biol. 40, 123. [PubMed] [Google Scholar]
- Müller AW (1996) Pattern formation in the immortal Hydra . Trends Genet. 12, 91. [DOI] [PubMed] [Google Scholar]
- Mutomba MC, To WY, Hyun WC, Wang CC (1997) Inhibition of proteasome activity blocks cell cycle progression at specific phase boundaries in African trypanosomes. Mol. Biochem. Parasitol. 90, 491. [DOI] [PubMed] [Google Scholar]
- Neubauer KH, Christians S, Hoffmeister SA, Kreger S, Schaller HC (1990) Characterisation of two types of head activator receptor on Hydra cells. Mech. Dev. 33, 39. [DOI] [PubMed] [Google Scholar]
- Nuesse M, Beisker W, Hoffmann F, Tárnok A (1990) Flow cytometric analysis of G1 and G2/M‐phase subpopulations in mammalian cell nuclei using side scatter and DNA content measurements. Cytometry 11, 813. [DOI] [PubMed] [Google Scholar]
- Pascoe D, Carroll K, Karntanut W, Watts MM (2002) Toxicity of 17α‐ethinylestradiol and bisphenol A to the freshwater Cnidarian Hydra vulgaris . Arch. Environ. Contam. Toxicol. 43, 56. [DOI] [PubMed] [Google Scholar]
- Sans J, Leyton C, Gimenez‐Abian MI, Giminez‐Abian JF, Aller P, De la Torre C (1997) Default cycle phases determined after modifying discrete DNA sequences in plant cells. Cell Prolif. 30, 61. [DOI] [PMC free article] [PubMed] [Google Scholar]
- Schaller HC (1976) Action of the head activator as a growth hormone in Hydra . Cell Diff. 5, 1. [DOI] [PubMed] [Google Scholar]
- Zacharias H, Anokhin B, Khalturin K, Bosch TCG (2004) Genome sizes and chromosomes in the basal metazoan Hydra . Zoology 107, 219. [DOI] [PubMed] [Google Scholar]