

Abstract
Abstract. Objectives: Nucleostemin (NS) is a recently identified GTP‐binding protein, predominantly expressed in embryonic and adult stem cells but not in terminally differentiated cells. NS is expressed in bone marrow‐derived mesenchymal stem cells, and its expression ceases upon induction of neural differentiation. The major aim of this study was to determine whether down‐regulation of NS expression acts as a promoter, or otherwise as a by‐product of differentiation and senescence processes. Materials and methods: We used RNA interference protocols to specifically knock down NS in rat bone marrow‐derived stromal stem cells. Changes in rate of proliferation and cell cycle profile after knocking‐down of NS were measured. In addition, changes in expression of associated genes were studied by semiquantitative RT‐PCR, Western blotting and immunocytochemistery. Results: Knocked‐down expression of NS caused a significant decrease in the rate of cell proliferation with concomitant shutting off of expression of cyclin D1 and survivin, two other well‐known regulators of cell proliferation. Interestingly, we noticed no obvious changes in expression level of p21, the main effector of p53 for its cell cycle repressing function. Conclusion: Our findings revealed a master role for NS in promoting proliferation of rat bone marrow‐derived stromal stem cells. Moreover, we suggest that despite previous proposals, the cell cycle arrest/inhibitory role of NS is unlikely to be related to its proposed property of interaction with p53.
INTRODUCTION
Nucleostemin (NS) is a GTP‐binding protein, predominantly expressed in embryonic and adult stem cells but not in terminally differentiated cells. NS protein resides in the nucleolus and it has been suggested that on binding to GTP, NS can interact with the tumour suppressor protein p53 (in the nucleoplasm), and therefore interfere with its cell cycle inhibitory function, either via direct inhibition of p53 or by promoting the function of other suppressors of the p53 protein, such as mdm2 (Tsai & McKay 2002).
So far, several groups have reported expression of NS in different types of stem cell as well as in cells of several cancer lines (Baddoo et al. 2003; Liu et al. 2004; Fan et al. 2006; Kafienah et al. 2006; Lacina et al. 2006). Furthermore, very recently, we reported expression of NS in bone marrow‐derived stromal stem cells (BMSCs) and that this expression abruptly disappeared on in vitro neural differentiation (Yaghoobi et al. 2005). However, it is not yet clear whether the observed down‐regulation of NS expression is, alone, a promoter of the differentiation and senescence, or otherwise, merely a by‐product of the processes responsible for the cell cycle exit phenomenon.
To address this question, we exploited RNA interference (RNAi) technology to knockdown expression of NS, specifically, in rat BMSCs and investigated consequences of its down‐regulation on rate of proliferation of these cells. Meanwhile, to assess whether the proliferation promotive role of NS is solely due to its p53‐inactivating potential or not, we studied expression pattern of p21, the main effector of p53 for its cell cycle repressing function, in BMSCs before and after NS knockdown. Our observations demonstrate that NS plays a major role in regulation of cell proliferation in BMSCs and that this function might not be related to its proposed p53 binding and probable inactivation function.
MATERIALS AND METHODS
Cell extraction and culture
Rat BMSCs were isolated as described previously (Yaghoobi & Mowla 2006). Briefly, marrows were flushed from tibias and femurs of 8‐ to 10‐week‐old rats. Extracted cells were seeded in α‐MEM supplemented with 20% foetal bovine serum (Invitrogen, Loughborough, UK), 100 U/mL penicillin, 100 µg/mL streptomycin and 25 ng/mL amphotericin B and were incubated at 37 °C with 5% humidified CO2. Non‐adherent cells were eliminated by changing medium the next day allowing adherent cells to propagate.
RNA interference
Double‐stranded siRNA corresponding to NS (NS‐siRNA) and an irrelevant siRNA (IR‐siRNA) with no complementary target sequence more than 16 out of its 21 mer length within the rat genome, were designed using the siRNA selection program at the Whitehead Institute for Biomedical Research (http://jura.wi.mit.edu/) with the following sequences, and were synthesized by Qiagen (Qiagen, Valencia, CA, USA): NS: sense: GAACUAAAACAGCAGCAGdTdT; antisense: UCUGCUGCUGUUUUAGUUCdTdT. IR: sense: CUGAUGCAGGUAAUCGCGUdTdT; antisense: ACGCGAUUACCUGCAUCAGdTdT.
For transfection, rat BMSCs was seeded in six‐well plates at a density of 4 × 10⁴ cells per well. Next day, when cultures were 30–50% confluent, siRNAs were introduced into the cells using Oligofectamine transfection reagent (Invitrogen, Carlsbad, CA, USA). In brief, 10 µL siRNA (20 µm solution) was incubated with 4 µL Oligofectamine in 190 µL Opti‐MEM medium (Invitrogen) for 20 min; the mixture was then added to the cells with a final volume of 1 mL. Transfected cells were cultured and were fed daily with fresh medium until were assay.
RNA extraction and RT‐PCR
Total RNA was extracted from NS‐siRNA and IR‐siRNA transfected cells 24 h after transfection using RNX plus™ kit (Cinnagen, Tehran, Iran). Reverse transcription was carried out on 1 µg of total RNA in a final volume of 20 µL, using random hexamer primers and RevertAid™ M‐MuLV Reverse Transcriptase (Fermentas, Lithuania). PCRs were performed using 2 µL of cDNA with 1 U Taq polymerase (Cinnagen), 1.5 mm MgCl2, 200 µm dNTPs, 0.5 µm of each primer and buffer supplied by the company in 25 µL reaction volumes. Primers were designed as follows: NS (NM‐175580): forward: TCCGAAGTCCAGCAAGTATTG; reverse: AATGAGGCACCTGTCCACTC. Cyclin D1 (NM‐171992): forward: ATGTTCGTGGCCTCTAAGATG; reverse: TGCGGATGATCTGCTTGTTC. Survivin (NM‐022274): forward: TCTACACCTTCAAGAACTGGC; reverse: CTGGAAAGCTGGGACAAGTG. CDKN1A (p21) (NM‐080782.3): forward: TCCACAGCGATATCGAGACA; reverse: AACACGCTCCCAGACGTAGT. β‐2‐Microglobulin (NM‐012512): forward: CCGTGATCTTTCTGGTGCTT; reverse: TTTTGGGCTCCTTCAGAGTG.
Expression of β‐2‐microglobulin (a housekeeping gene) was monitored in all semiquantitative RT‐PCR experiments as internal control.
Cell growth analysis
Twenty‐four and 48 h after transfection, NS‐siRNA and IR‐siRNA treated cells were trypsinized, harvested and the number of cells counted, using a haemocytometer.
Cell cycle analysis
For FACS analysis, cells were harvested by trypsinization 24 h after transfection, were fixed with ice‐cooled 70% ethanol, then were stained with 60 mg/mL propidium iodide solution containing 20 mg/mL RNase A, for 30 min, and were analysed for cell cycle status using a FACScan cell sorter (Becton Dickinson, Mountain View, CA, USA). Cell cycle profiles were calculated by using WinMDI version 2.8 software (J. Trotter, Scripps Research Institute, La Jolla, CA, USA).
Western blotting
Cells were lysed 24 h after transfection in radioimmunoprecipitation buffer (phosphate‐buffered saline, 1% triton X‐100, 0.5% sodium deoxycholate, 0.1% sodium dodecyl sulfate). Lysates containing the equivalent of 50 µg protein per lane were electrophoresed using sodium dodecyl sulfate polyacrylamide gel electrophoresis (12% polyacrylamide gel) and were blotted on polyvinylidene fluoride membranes (Amersham Biosciences, Germany). Blots were blocked for 2 h with enhanced chemiluminescence advanced kit blocking solution. Samples were then probed with polyclonal antibodies against NS (1 : 1000; R&D Systems, Abingdon, UK), β‐actin (1: 2000; Prosci, Poway, CA, USA) or p21 (1 : 200; Novus Biologicals, Littleton, CO, USA) and subsequently with the horseradish peroxidase (HRP)‐conjugated antigoat (1 : 5000; abcam, Cambridge, UK) or HRP‐conjugated secondary antirabbit (1 : 5000; DakoCytomation, Glostrup, Denmark) antibodies. Staining was visualized using an enhanced chemiluminescence kit (enhanced chemiluminescence advanced, Amersham Biosciences, Buckinghamshire, UK).
Immunocytochemistry
Cells were cultured on collagen‐coated coverslips and were fixed with 4% paraformaldehyde. For detection of NS, polyclonal antibody against NS (1 : 200; R&D system) was applied for 2 h at 37 °C, then with polyclonal HRP‐conjugated rabbit antigoat (1 : 500; Abcam, Cambridge, UK) as secondary antibody, for 2 h followed by addition of 3,3′‐diaminobenzidine (Sigma, St. Louis, MO, USA) as a substrate for HRP.
Statistical analyses
All experiments were replicated two or three times, and statistical significance was measured by using the one‐way anova test. P values of < 0.05 were considered to indicate statistical significance.
RESULTS
Extraction and characterization of BMSCs
We isolated stromal stem cells from bone marrow of 5‐ to 10‐week‐old rats and cultured the cells as described previously (Yaghoobi et al. 2005; Yaghoobi & Mowla 2006; Marandi et al. 2007); they were positively selected for their ability to adhere to plastic surfaces. The phenotype of the isolated cells and expression pattern of several markers, has confirmed that they are indeed BMSCs (Yaghoobi et al. 2005; Yaghoobi & Mowla 2006). According to our previous work, these cells express certain mesenchymal lineage markers such as type I α1 collagen and vimentin, as well as stem cell specific genes such as NS but not OCT4, Nanog and Notch1 (Yaghoobi et al. 2005).
NS‐specific siRNA reduced NS mRNA level in a specific manner
A specifically designed siRNA that could exclusively identify a complementary sequence in the open reading frame of rat NS mRNA was introduced into the culture of rat BMSCs. Furthermore, to rule out possible false results due to off‐target binding of NS RNAi, we designed an irrelevant siRNA as control with no complementary sequence in rodent.
The RT‐PCR analysis revealed that application of NS‐siRNA caused dramatic reduction in expression of NS, when normalized to the corresponding β2m internal control, compared to IR‐siRNA‐treated cells (Fig. 1a). Furthermore, to assess whether the observed reduction in NS mRNA level, follows a similar reduction at protein level, we performed immunostaining and Western blotting on transfected cells. Both Western blotting (Fig. 1b) and immunocytochemistry (Fig. 1c,d), confirmed a significant reduction at protein level.
Figure 1.
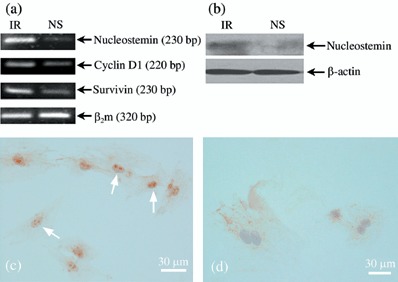
(a) RT‐PCR analysis of expression of nucleostemin, cyclin D1 and survivin in rat BMSCs. Expression of β2m was used as internal control. Note expression of nucleostemin (NS) in the NS group is reduced by up to 20–30% of that of the irrelevant (IR) group, and expression of cyclin D1 and survivin declined to almost half those of the IR group. (b) Western blot analysis of expression of nucleostemin protein in IR and NS groups. Expression of β‐actin was used as loading control. (c) Anti‐NS staining in IR‐siRNA‐treated cells (typical nucleolus localization of NS protein, arrows). (d) Anti‐NS staining in NS‐siRNA‐treated cells; very few cells retained any indication of NS expression.
Cell proliferation reduction by NS down‐regulation
Cell growth curves of NS‐siRNA‐treated cells (Fig. 2a) revealed a significant reduction in rate of proliferation compared to those of the IR‐siRNA‐transfected cells. Forty‐eight hours after transfection, numbers of cells in the NS group (10.6 ± 0.5 × 10⁴) were 85% of those of the control group (12.4 ± 0.4 × 10⁴).
Figure 2.
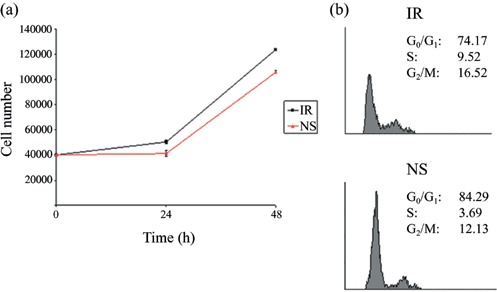
(a) Cell growth curves of the two groups of rat BMSCs at 24 and 48 h post‐transfection. (b) Analysis of cell cycle progression. Distribution and percentage of cells in G0/G1, S and G2+ M phases of the cell cycle are indicated.
Cell cycle alteration after knocking‐down expression of NS
To investigate whether reduction in rate of proliferation of NS‐siRNA‐treated cells was due to an increase in cell cycle length or in number of cells that exit the cell cycle, ratios of the cells existing in different cell cycle phases were measured by staining cell DNA content by propidium iodide, followed then by FACS analysis. According to our data, the ratio of cells in S and G2+ M phases in the NS group was proportionally lower (15.71%) than that of the irrelevant group (25.83%). In contrast, percentage of cells in G0/G1 in the NS group was higher (84.29%) than that of the IR group (74.17%; Fig. 2b).
Changes in the expression pattern of certain cell cycle regulatory genes in NS‐siRNA‐treated cells
According to RT‐PCR results (Fig. 1), as early as 24 h after transfection of BMSCs by NS‐specific siRNA, levels of expression of both cyclin D1 and survivin reduced to almost half of that of controls. Additionally, we tried to monitor changes in expression level of one of the main effectors of p53 tumour suppressor gene in cell cycle checkpoints, p21. As shown in Fig. 3, we were not able to detect any considerable changes in expression of either its mRNA or the protein, in NS‐siRNA‐treated cells compared to IR‐siRNA‐treated cells.
Figure 3.
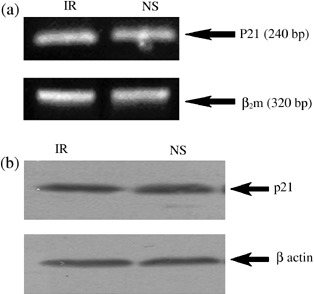
(a) Expression of p21 gene in irrelevant (IR) and nucleostemin (NS) groups compared to expression of β2m. Nucleostemin's knockdown had no influence on expression level of p21 mRNA. (b) Western blot analysis of expression of p21 protein in IR and NS groups. Expression of β‐actin was used as internal control.
DISCUSSION
Recent work on stem cell‐specific genes (sometimes called ‘stemness’ genes, which can sustain unique properties of stem cells, self‐renewal and developmental potential) have resulted in identifying certain candidate genes such as OCT4, Nanog, Sox family members, and more (Ivanova et al. 2002; Cai et al. 2004; Chambers & Smith 2004). However, the exact roles and functional mechanisms of most of these genes are not yet fully understood (Chambers & Smith 2004).
Nucleostemin (NS) is one of these genes, initially described by Tsai & McKay in 2002. NS is highly expressed in central nervous system stem/progenitor cells and in haematopoietic stem cells, but not in their differentiated progeny (Tsai & McKay 2002). NS expression has also been shown in certain somatic cells, such as human BMSCs and those of several cancer cell lines (Baddoo et al. 2003; Liu et al. 2004; Fan et al. 2006; Kafienah et al. 2006; Lacina et al. 2006). Previously, we have shown that NS is highly expressed in rat BMSCs, and its expression shuts off abruptly upon induction of neural differentiation. Interestingly, down‐regulation of NS precedes reduction in expression of the proliferative cell stage limiting protein, cyclin D1. The latter observation has promoted us to investigate whether down‐regulation of NS is an inducer of cells’ entry into the course of differentiation then senescence, or otherwise it is merely a by‐product of cell cycle exit.
To this aim, we used an RNAi approach to specifically promote degradation of NS mRNA. This designed siRNA specifically reduced expression of NS by 70–80% compared to that in the irrelevant siRNA‐treated control group. Down‐regulation of NS mRNA was also mirrored at the protein level, as demonstrated by Western blot analysis, and disappearance of nucleolar protein in NS in immunocytochemistry. It was interesting that RNAi‐mediated down‐regulation of NS was accompanied by a significant decrease in rate of proliferation of BMSCs, suggesting a master regulatory role for NS in promoting proliferation of these cells. This result is in contrast to a recent report by Kafienah et al. (2006), which reported that down‐regulation of NS in human BMSCs does not have any detectable impact on their proliferation rate, in the absence of soluble basic fibroblast growth factor in the culture media. This discrepancy could be due either to possible intrinsic differences between the two species (rat/human) or due to differences in the experimental procedures.
Consequently, we used FACS analysis to determine whether the reduction in rate of cell proliferation in the NS‐siRNA‐treated group was due to an increase in the number of cells leaving the cell cycle or by lengthening cell cycle progression time. Our results revealed that this treatment caused a proportional decline in ratio of cells in S and G2+ M phases of the cell cycle and a comparable increase in the ratio of cells in G0/G1. Furthermore, the results of FACS analysis closely resembled those of cell population growth analysis. Thus, it would be plausible to propose that absence of NS or reduction in its expression induces cell cycle arrest and promotes at least a subset of these cells to leave the cell cycle. This conclusion was further supported by our data showing that abolition of NS expression was followed by a considerable reduction in expression of cyclin D1 and survivin, two well‐known positive regulators of cell proliferation that are present in proliferative cells but not in terminally differentiated, quiescent cells (Astier et al. 2003; Caldas et al. 2005). However, the exact mechanism by which NS influences their expression is yet to be identified.
It was first proposed that the proliferation promotive function of NS is due to its p53 binding and possibly inactivating property (Bernardi & Pandolfi 2003). Nevertheless, to date no experimental evidence has been presented to support the hypothesis, beyond the observation that these two proteins co‐immunoprecipitate and can bind to each other, as demonstrated by the GST pull‐down assay (Tsai & McKay 2002). Thus, we tried for the first time to experimentally evaluate the above‐mentioned hypothesis. To this aim, we studied changes in the expression level of p21 (also known as p21WAF1/CIP1) and CDKN1A, one of the most prominent effectors of p53 in its cell cycle regulatory function (Deng et al. 1995). It was anticipiated that down‐regulation of NS would result in a dramatic increase in expression of p21 (as its transcription is under tight control of p53) and the activated p53 (due to absence of NS) would promote its transcription in order to repress cell cycle progression (Gartel & Radhakrishnan 2005). Nevertheless, our analysis revealed that down‐regulation of NS did not have any detectable impact on expression of p21, despite apparent reduction in cell proliferation and increasing the proportion of cells in G0/G1. This reveals that the proliferation promotion function of NS might not be merely due to its p53 binding activity. Moreover, this observation is in line with our other experiments on human p53‐negative bladder carcinoma cell line 5637 cells (Stott et al. 1998; Nixdorf et al. 2004), in which down‐regulation of NS caused a proportional reduction in their proliferation rate. Reduction in the number of cells in the NS‐siRNA‐treated 5637 cells is in line with our results in rat BMSCs and further support a p53‐independent route of function for NS (Nikpoor et al., unpublished observations). Furthermore, similar experimentation has previously shown that down‐regulation of NS would decrease the rate of propagation of the p53‐null HeLa cells (Sijin et al. 2004). These observations would further support our claim that NS might be able to conduct its function via mediators other than p53 protein. Of great interest, a recently published paper by Beekman's group (Beekman et al. 2006) revealed that removal of p53 in NS−/– mice could not rescue the embryonic lethality associated with impaired cell division in the course of blastocyst formation. The latter report is clearly consistent with our findings.
In conclusion, our data suggest an effective, master regulatory role of NS in coordinating proliferation of rat BMSCs. We observed a significant reduction in cell proliferation of NS‐siRNA‐treated cells, which was concomitant with proportional down‐regulation of certain cell cycle promoting genes. However, despite initial presumption that assigned the proliferation promotive function of NS to its p53‐binding ability, our study suggests a potential p53‐independent scenario for NS function, as its down‐regulation‐induced cell cycle arrest neither was mediated by up‐regulation of p21, nor could be impaired in the absence of functional p53. Finally, considering these observations and lack of solid experimental data regarding the mechanism of function of NS, a comprehensive analysis of the transcriptome and proteome in the presence and absence of NS, for identification of candidate pathways and putative mediator genes for conduction of its function in stem and cancerous cells, seems desirable.
ACKNOWLEDGEMENTS
We are grateful to Dr. Ahmad‐Reza Bahrami, Dr. Kamran Ali Moghadam, Parvaneh Nikpoor and Mohamad Marandi for their valuable help and assistance. This work was supported, in part, by a research grant from the Iranian Stem Cell Network.
REFERENCES
- Astier AL, Xu R, Svoboda M, Hinds E, Munoz O, De Beaumont R, Crean CD, Gabig T, Freedman AS (2003) Temporal gene expression profile of human precursor B leukemia cells induced by adhesion receptor: identification of pathways regulating B‐cell survival. Blood 101, 1118–1127. [DOI] [PubMed] [Google Scholar]
- Baddoo M, Hill K, Wilkinson R, Gaupp D, Hughes C, Kopen GC, Phinney DG (2003) Characterization of mesenchymal stem cells isolated from murine bone marrow by negative selection. J. Cell. Biochem. 89, 1235–1249. [DOI] [PubMed] [Google Scholar]
- Beekman C, Nichane M, De Clercq S, Maetens M, Floss T, Wurst W, Bellefroid E, Marine JC (2006) Evolutionarily conserved role of nucleostemin: controlling proliferation of stem/progenitor cells during early vertebrate development. Mol. Cell. Biol. 26, 9291–9301. [DOI] [PMC free article] [PubMed] [Google Scholar]
- Bernardi R, Pandolfi PP (2003) The nucleolus: at the stem of immortality. Nat. Med. 9, 24–25. [DOI] [PubMed] [Google Scholar]
- Cai JL, Weiss ML, Rao MS (2004) In search of ‘stemness’. Exp. Hematol. 32, 585–598. [DOI] [PMC free article] [PubMed] [Google Scholar]
- Caldas H, Jiang YY, Holloway MP, Fangusaro J, Mahotka C, Conway EM, Altura RA (2005) Survivin splice variants regulate the balance between proliferation and cell death. Oncogene 24, 1994–2007. [DOI] [PubMed] [Google Scholar]
- Chambers I, Smith A (2004) Self‐renewal of teratocarcinoma and embryonic stem cells. Oncogene 23, 7150–7160. [DOI] [PubMed] [Google Scholar]
- Deng CX, Zhang PM, Harper JW, Elledge SJ, Leder P (1995) Mice lacking p21 (CIP1/WAF1) undergo normal development, but are defective in G1 checkpoint control. Cell 82, 675–684. [DOI] [PubMed] [Google Scholar]
- Fan Y, Liu Z, Zhao S, Lou F, Nilsson S, Ekman P, Xu D, Fang X (2006) Nucleostemin mrna is expressed in both normal and malignant renal tissues. Br. J. Cancer 94, 1658–1662. [DOI] [PMC free article] [PubMed] [Google Scholar]
- Gartel AL, Radhakrishnan SK (2005) Lost in transcription: p21 repression, mechanisms, and consequences. Cancer Res. 65, 3980–3985. [DOI] [PubMed] [Google Scholar]
- Ivanova NB, Dimos JT, Schaniel C, Hackney JA, Moore KA, Lemischka IR (2002) A stem cell molecular signature. Science 298, 601–604. [DOI] [PubMed] [Google Scholar]
- Kafienah W, Mistry S, Williams C, Hollander AP (2006) Nucleostemin is a marker of proliferating stromal stem cells in adult human bone marrow. Stem Cells 24, 1113–1120. [DOI] [PubMed] [Google Scholar]
- Lacina L, Smetana K Jr, Dvorankova B, Stork J, Plzakova Z, Gabius HJ (2006) Immunocyto‐ and histochemical profiling of nucleostemin expression: marker of epidermal stem cells? J. Dermatol. Sci. 44, 73–80. [DOI] [PubMed] [Google Scholar]
- Liu SJ, Cai ZW, Liu YJ, Dong MY, Sun LQ, Hu GF, Wei YY, Lao WD (2004) Role of nucleostemin in growth regulation of gastric cancer, liver cancer and other malignancies. World J. Gastroenterol. 10, 1246–1249. [DOI] [PMC free article] [PubMed] [Google Scholar]
- Marandi M, Mowla SJ, Tavallaei M, Yaghoobi MM, Jafarnejad SM (2007) Proprotein convertases 1 and 2 (PC1 and PC2) are expressed in neurally differentiated rat bone marrow stromal stem cells (BMSCs). Neurosci. Lett. 420, 198–203. [DOI] [PubMed] [Google Scholar]
- Nixdorf S, Grimm MO, Loberg R, Marreiros A, Russell PJ, Pienta KJ, Jackson P (2004) Expression and regulation of MIM (missing in metastasis), a novel putative metastasis suppressor gene, and MIM‐B, in bladder cancer cell lines. Cancer Lett. 215, 209–220. [DOI] [PubMed] [Google Scholar]
- Sijin L, Ziwei C, Yajun L, Meiyu D, Hongwei Z, Guofa H, Siguo L, Hong G, Zhihong Z, Xiaolei L, Yingyun W, Yan X, Weide L (2004) The effect of knocking‐down nucleostemin gene expression on the in vitro proliferation and in vivo tumorigenesis of hela cells. J. Exp. Clin. Cancer Res. 23, 529–538. [PubMed] [Google Scholar]
- Stott FJ, Bates S, James MC, McConnell BB, Starborg M, Brookes S, Palmero I, Ryan K, Hara E, Vousden KH, Peters G (1998) The alternative product from the human CDKN2A locus, p14 (ARF), participates in a regulatory feedback loop with p53 and MDM2. EMBO J. 17, 5001–5014. [DOI] [PMC free article] [PubMed] [Google Scholar]
- Tsai RY, McKay RD (2002) A nucleolar mechanism controlling cell proliferation in stem cells and cancer cells. Genes Dev. 16, 2991–3003. [DOI] [PMC free article] [PubMed] [Google Scholar]
- Yaghoobi MM, Mowla SJ (2006) Differential gene expression pattern of neurotrophins and their receptors during neuronal differentiation of rat bone marrow stromal cells. Neurosci. Lett. 397, 149–154. [DOI] [PubMed] [Google Scholar]
- Yaghoobi MM, Mowla SJ, Tiraihi T (2005) Nucleostemin, a coordinator of self‐renewal, is expressed in rat marrow stromal cells and turns off after induction of neural differentiation. Neurosci. Lett. 390, 81–86. [DOI] [PubMed] [Google Scholar]