

Abstract
Abstract. Objectives: In this study, we have sought to establish the cellular origin and proliferative status of the renal parenchyma as it regenerates after damage induced by mercuric chloride, with or without erythropoietin treatments, that might alter the response. Materials and methods: Female mice were irradiated and male whole bone marrow was transplanted into them. Six weeks later recipient mice were assigned to one of four groups: control, mercuric chloride treated, erythropoietin treated and treated with mercuric chloride plus erythropoietin. Results: Tubular injury scores were high 3 days after mercuric chloride and had recovered partially after 14 days, in line with serum urea nitrogen levels. Confocal microscopy confirmed the tubular location of bone marrow‐derived cells. A ‘four‐in‐one’ analytical technique (identifying cell origin, tubular phenotype, tubular basement membranes and S‐phase status) revealed that tubular necrosis increased bone marrow derivation of renal tubular epithelium from a baseline of ∼1.3% to ∼4.0%. Erythropoietin increased the haematocrit, but no other effects were detected. Conclusion: As 1 in 12 proximal tubular cells in S‐phase was derived from bone marrow, we conclude that in the kidney, the presence of bone marrow‐derived cells makes a minor but important regenerative contribution after tubular necrosis.
INTRODUCTION
Recovery of renal function after tubular injury, whether ischaemic or toxic, depends on the replacement of lost epithelial cells with functional epithelium. In transplant settings, new epithelial cells may originate from indigenous renal cells or from cells derived from bone marrow (BM) (Poulsom et al. 2001). The phrase ‘adult stem cell plasticity’ has been be used to describe a change in cell fate (Alison et al. 2000) such as from BM to renal, but it should be made clear that there is no well‐defined renal stem cell population within the adult mammalian kidney.
However, following our report in 2001 (Poulsom et al. 2001), other groups have also reported BM contributions to renal tubular parenchyma, in humans and mice. Gupta et al. (2002) reported in a small series that 1% of female allograft tubules contained Y‐chromosome‐positive cells, but only when acute tubular necrosis (ATN) had developed. Mengel et al. (2004) detected epithelial chimaerism in 88% of 36 human renal allografts using laser microdissection and short tandem repeat genotyping. Epithelial chimaerism was present as early as 8 days after transplantation and was stable in over two‐thirds of patients. The abundance of chimaeric tubular epithelial cells ranged from 2.4% to 6.6% in gender‐mismatched cases where Y‐probe in situ hybridization (ISH) was possible (Mengel et al. 2004).
Several studies have refined our original observation that BM gives rise to renal parenchyma (Poulsom et al. 2001) in mice too, by seeking to identify specific cell types that are capable of engraftment. As examples, a haematopoietic stem cell population from male Rosa26 mice helped regenerate renal tubular epithelium after renal ischaemic reperfusion (I/R) injury (Lin et al. 2003), and transient renal ischaemia mobilized a Lin−Sca‐1+ population into the circulation from adult mouse BM, and this appeared to engraft specifically in the injured regions of renal tubules, forming BM‐derived renal tubular epithelial cells (Kale et al. 2003). Bone marrow mesenchymal cells were reported by Morigi et al. (2004) to engraft in tubules damaged by cisplatin.
Several groups have sought to identify factors that accelerate recovery from renal injury and some have tested whether they affect BM‐to‐kidney cell trafficking. As examples, Iwasaki et al. (2005), also using cisplatin‐induced renal failure, showed that BM‐derived cells mobilized by granulocyte‐colony‐stimulating factor (G‐CSF) accelerated the recovery of renal function and prevented renal tubular injury; furthermore, the effects of G‐CSF were enhanced by the addition of macrophage‐colony‐stimulating factor. Additional support for a beneficial effect of G‐CSF in regeneration after renal damage comes from our own report that G‐CSF treatments assisted recovery from ATN induced by folic acid; serum urea nitrogen (SUN) levels were improved and the prevalence of regenerative BM‐derived tubular epithelial cells was nearly doubled (Fang et al. 2005). Conversely, Togel et al. (2004) found that G‐CSF preconditioning had adverse effects, and ascribed the renoprotective effects of mesenchymal cell injection simply to changes in cytokine milieu (Togel et al. 2005).
Considering which other circulating factors might be involved, erythropoietin (EPO) has recently emerged as a most promising multifunctional cytokine that can play a significant role in regeneration of the kidney (Vaziri et al. 1994; Bagnis et al. 2001; Yang et al. 2003; Bahlmann et al. 2004; Patel et al. 2004; Sharples et al. 2004; Kang et al. 2005). EPO is produced mainly by peri‐tubular fibroblasts within the adult kidney in response to hypoxia. Released into the circulation, the primary recognized role of EPO is the regulation of red cell production in the BM (by preventing apoptosis of erythroid progenitor cells), although EPO and its receptor have been localized to several non‐haematopoietic tissues, including the brain, retina, heart, spleen, lung, kidney and endothelial cells (Juul et al. 1998; Olsen 2003).
The exact mechanism of renal protection by EPO is unclear, but given such current data in various animal renal I/R models (Yang et al. 2003; Patel et al. 2004; Sharples et al. 2004), heavy metal toxicity (Vaziri et al. 1994; Bagnis et al. 2001) and the classic remnant kidney studies (Bahlmann et al. 2004; Kang et al. 2005), we hypothesized that EPO might exert a stimulating effect on BM thereby increasing the number of BM‐derived tubular cells.
In this study, we have examined damaged tissues from female mice following adoptive transfer of male whole population BM cells, enabling the Y chromosome to be used as a marker of cell origin. We used mercuric chloride (HgCl2) as a toxin as it affects the S3 segment of the proximal tubule selectively (Hultman & Enestrom 1986) causing direct ATN, and which (unlike cisplatin) does not suppress division of indigenous renal cells, BM‐derived cells or cells within the BM. Initially, we used confocal microscopy to confirm the tubular location of BM‐derived cells, and then a ‘four‐in‐one’ histological protocol to identify simultaneously: cells of BM origin, tubular cell phenotype, location of basement membrane and cell population proliferative status, and thus calculated the proportion of regenerating renal parenchyma that derived from BM.
MATERIALS AND METHODS
All animal procedures were carried out under British Home Office procedural and ethical guidelines.
BM adoptive transfer
Before transplantation, C57BL6 mice were given acidified water for 1 week to prevent Pseudomonas growth. Eight‐week‐old female recipients received 10 Gy whole body gamma irradiation (divided dose 3 h apart), to ablate their BM, followed immediately by tail vein injection of male whole BM cells (2 × 10⁶).
HgCl2 and EPO injections
Six weeks after transplantation, groups of recipient mice (n = 9) were assigned to one of four treatments: (1) control mice were injected intraperitoneally (i.p.) with vehicle solution [0.2 ml phosphate‐buffed saline (PBS)]; (2) HgCl2 at 3 mg/kg body weight i.p.; (3) EPO (550649; Ortho Biotech, High Wycombe, UK), at 1000 units/kg body weight, up to five doses over 2 weeks (day 0, day 2, day 4, day 8 and day 10); and (4) EPO + HgCl2 group mice received both HgCl2 and EPO injections. We used EPO at levels that did not exceed previously reported dosage in mice (300–5000 units/kg body weight; Vaziri et al. 1994; Bagnis et al. 2001; Yang et al. 2003; Bahlmann et al. 2004; Patel et al. 2004; Sharples et al. 2004; Kang et al. 2005).
[3H]Thymidine injection, tissue harvesting and blood sampling
Recipient mice were killed at either 3 days (16 mice, four in each group) or 14 days (20 mice, five in each group) following HgCl2 administration. Timing was based on our pilot observation that tubular damage peaked at 3 days following HgCl2, followed by histological restitution at 14 days (Hultman & Enestrom 1986). To label cells in DNA synthesis, [3H]thymidine (TRK120, Amersham Biosciences, Chalfont St Giles, UK) was injected at 1 µCi/g body weight i.p. 1 h prior to killing. Organs were removed, fixed overnight in 10% neutral buffered formalin and then were transferred to 70% ethanol before embedding in paraffin wax. Caution was taken to avoid over‐fixation, which substantially reduces the sensitivity of Y‐chromosome ISH. Terminal blood was obtained by direct cardiac puncture into an ethylenediaminetetraacetic acid (EDTA) tube for determination of SUN, using a diagnostic assay kit (542946, Boehringer Mannheim, Germany). During the study, all mice had free access to normal mouse diet and drinking water, and showed no evidence of dehydration or gastrointestinal bleeding that might cause a disproportionate increase of SUN compared to serum creatinine.
Scoring renal tissue injury
Sections (4 µm) were stained with diastase periodic acid‐Schiff (PAS) and haematoxylin and eosin. Analyses were performed, blind to the sample identity. The tissue injury score assessed tubular necrosis, tubular dilatation (more than double normal diameter) and cast formation, as previously described (Turnberg et al. 2004) by point counting at ×400 magnification, using a Weibel 1 graticule with 50 random points (Pyser‐SGI Ltd., Edenbridge, Kent, UK). For each tissue section, 10 consecutive non‐overlapping fields (five cortex and five medulla) were scored. Results for each component are percentage volume fractions (v/V%).
ISH for Y‐chromosome detection – fluorescence and confocal imaging
Four‐micrometre sections were dewaxed, incubated in 1 m sodium thiocyanate (S7757; Sigma‐Aldrich, Poole, UK) for 10 min at 80 °C, were washed in PBS, then were digested in 0.4% w/v pepsin (P6887; Sigma) in 0.1 m HCl for 5–10 min at 37 °C to improve access for the Y probe. Pepsin digestion time depended on tissue fixation. Pepsin was quenched in 0.2% glycine (G4392; Sigma) in double concentration PBS. Sections were rinsed in PBS, post‐fixed in 4% paraformaldehyde (P6148; Sigma) in PBS, dehydrated through graded alcohols, then air‐dried. A fluorescein isothiocyanate (FITC)‐labelled Y‐chromosome paint (1189‐YMF‐01; Cambio, Cambridge, UK) in the supplier's hybridization mix was applied and samples were sealed under glass with rubber cement. Slides were heated to 60 °C for 10 min then were hybridized overnight at 37 °C. These slides were then washed in 50% formamide (284226P; BDH Laboratory Supplies, Poole, UK)/2× standard saline citrate (SSC) at 37 °C, then 2× SSC, and 4× SSC/0.05% Tween‐20 for 10 min at 37 °C. For direct visualization of the Y chromosome, sections were rinsed in PBS and were cover‐slipped with Vectashield Hard Set mounting medium with 4′,6‐diamidine‐2′‐phenylindole dihydrochloride (DAPI) (H‐1500; Vector Laboratories, Ltd, Peterborough, UK), as described in Brittan et al. (2005) and Direkze et al. (2006). Sections were examined using an Olympus BX61 epi‐fluorescence microscope system with SmartCaptureX software (Digital Scientific, Cambridge, UK) to generate Red‐Green‐Blue (RGB) images from multi‐channel monochrome captures (Fig. 1e,f). A laser scanning microscope system (LSM 510, Zeiss, Jena, Germany) was used to produce a Z‐series of sequential scans imaging four channels: DAPI (band pass 420–480 nm), FITC (505–530 nm), red (560–615 nm) and deep red (650 nm long pass) to visualize autofluorescent structural landmarks. Examples of Y‐positive cells were scanned at high magnification with 12‐bit scan dimensions of 1024 × 1024 pixels, averaged eight times, for each of 10–20 ‘optical sections’ of 0.4 µm in the Z‐axis, and archived using the Zeiss LSM 510 software package. Z‐projections were exported as QuickTimeTM movie files. Figure 1 (g–j) shows selected frames from a movie prepared from 17 optical sections (512 × 512 pixels) showing data from a volume of 76.8 × 76.8 × 5.8 µm. (A compressed movie is presented as Supplementary material (Movie S1).)
Figure 1.

Demonstration of short‐term haematopoietic reconstitution and BM‐derived tubule cells. (a–d) Paired conventional and reflected light dark‐field microscopic images of sections of bone (a, b) and spleen (c, d) using combined indirect FISH for Y chromosomes (brown nuclear signals) and dipped emulsion autoradiography to detect [3H]thymidine incorporated by cells in S‐phase. Sub‐panels reveal 2‐fold magnification of the areas marked with asterisks; both tissues contain abundant BM‐derived cells, some of which are in S‐phase (asterisks). Haematoxylin counterstain. (e, f) Multichannel fluorescence microscopy of sections of kidney after direct FISH for Y chromosomes (green) that are seen in most nuclei (blue) of control male cells (e) but not in female cells (f). Autofluorescence in FITC, Cy3 and Cy5 channels was combined to reveal details of tissue structure using SmartCapture X software. (g–j) Four channel laser scanning confocal microscopy of a section from a female mouse recipient of male BM, following HgCl2 + EPO; Y chromosomes (green) are within cell nuclei (blue). BM‐derived cells are seen within the interstitium, that is, outside the tubule basement membranes (autofluorescence imaged in red and deep‐red [grey] channels). The asterisk indicates a BM‐derived cell within tubule boundaries; its epithelial or proliferative character cannot be determined using this method. A z‐series projection was generated in Zeiss LSM 510 operating software and exported as a QuickTime™ movie (Movie S1) and four frames exported for this figure.
‘Four‐in‐one’ analysis
Sections were stained first for a tubular epithelial marker using lectin histochemistry, then for the Y chromosome using ISH (indirect method), plus for tubule basement membrane using PAS, and finally cells actively synthesizing DNA (from [3H]thymidine) were visualized by autoradiography. The procedure took over 2 weeks for completion.
Lectin histochemistry
Four‐micrometre sections were dewaxed, their endogenous peroxidases blocked (0.18% hydrogen peroxide in methanol) and then were taken through graded alcohols to PBS. Biotinylated lectins were used to stain proximal tubules (Phaseolus vulgaris leucoagglutinin [PHA‐L]; 1/1000; B‐1115, Vector Laboratories) or distal tubules and b‐type intercalated cells of collecting tubules (peanut agglutinin [PNA]; 1/500; B‐1075, Vector Laboratories) with a visible and fluorescent red reaction product (SK5100; Vector Laboratories) as previously described (Fang et al. 2005).
ISH for Y chromosome – indirect detection
Lectin‐stained sections were processed as described for direct detection (see above), then were incubated with a peroxidase‐conjugated antifluorescein antibody (11 426346 910; 1/250; Roche Diagnostics Ltd, Burgess Hill, UK) for 60 min at room temperature, were washed, and Y‐signals were developed in 3,3′‐diaminobenzidine (D5637; Sigma) plus 0.3% hydrogen peroxide. Slides were rinsed in PBS before PAS staining.
PAS staining
Sections were oxidized with 1% aqueous periodic acid (BDH) for 5 min, washed in water, then were incubated in Schiff's reagent (BDH) before rinsing in distilled water for 10 min each. A light haematoxylin counterstain was followed by dehydration through graded alcohols, air‐drying and autoradiography.
Autoradiography
Sections were dipped in LM‐1 hypercoat emulsion (RPN40; Amersham Biosciences) at 45 °C in a dark room under ‘safe light’ (902 filter) illumination. When dry, sections were stored in complete darkness at 4 °C for 10–14 days then were developed, washed extensively, dehydrated, cleared and mounted in DePeX (BDH Laboratory Supplies, Poole, UK).
Identification and counting of BM‐derived tubular cells
To estimate the separate contributions of indigenous (female) and BM‐derived (male) cells to regeneration after renal injury, 1000 consecutively observed renal tubular epithelial cells per mouse were scored using a light‐ and dark‐field microscope (×200 magnification; Nikon Eclipse ME600, Japan). Any proliferating BM‐derived tubular cell was defined by the following criteria: positive for the tubular epithelial marker lectin, positive for a Y chromosome signal, being within the PAS‐stained tubular cell basement membrane and with more than five overlying silver grains on the nucleus after autoradiography. As sections were 4 µm thick, enabling the Y chromosome to be detected in only 71% of tubule nuclei in male control kidneys, we divided the counted values of Y‐positive cells in our female recipients by 0.71 to estimate the total donor‐derived cell population.
CD45 immunohistochemistry
Four‐micrometre sections were dewaxed, endogenous peroxidases blocked, and were rehydrated to PBS. Sections were subjected to microwaving (700 W) in 2 mm EDTA solution at pH 9.0 for 10 min for antigen retrieval, then were incubated with primary CD45 antibody for 35 min (550539; 1/20; Becton Dickinson Pharmingen, San Diego, CA, USA), followed with biotinylated rabbit antirat antibody for 35 min (A485; 1/100; Dako, Ely, UK), then with streptavidin‐peroxidase for 35 min (P397; 1/500; Dako). Slides were developed in 3,3′‐diaminobenzidine plus 0.3% hydrogen peroxide, were lightly counterstained with haematoxylin, dehydrated and mounted.
Statistics
Values presented in the text and figures are given as means with the standard error of mean for the number of observations. Statistical analyses were performed using GraphPad Prism 4.0 (GraphPad Software, San Diego, CA, USA). All data were routinely tested for normality of distribution and equality of standard deviation before analysis. The data were compared and analysed using two‐way analysis of variance (the column factor being treatment group and the row factor time period), followed by Bonferroni post‐tests to compare replicate means by row. The criterion for significance was 95% confidence interval, to reject the null hypothesis.
RESULTS
ATN following HgCl2 administration
Grossly damaged kidneys appeared enlarged, tense and pale. Microscopically (Fig. 2), there was extensive necrosis of tubular epithelial cells; cell nuclei were irregularly spaced and were fewer in number than controls. Some proximal tubules appeared dilated, with flattening of the cells and attenuation of brush borders. A proportion of distal tubules were also dilated, also with flattened epithelial cells. Proteinaceous casts were frequent. Tubule lumina contained many sloughed epithelial cells, leucocytes and cell debris. There were few apoptotic cells evident in sections after immunostaining for activated caspase‐3 (AF835; R&D Systems, Minneapolis, MN, USA) after an extensive survey (data not shown). Consistent with the strain of mouse used, there was no evidence of HgCl2‐induced vasculitis (data not shown), which can develop in some strains, for example B10.S (Specks 2000). Figure 2 reveals that all three parameters of damage scored were restricted to HgCl2‐treated groups, and were not influenced by EPO. Injury parameters recovered incompletely by day 14 and remained unaffected by EPO. The ATN scores were in line with determinations of SUN (Table 1).
Figure 2.
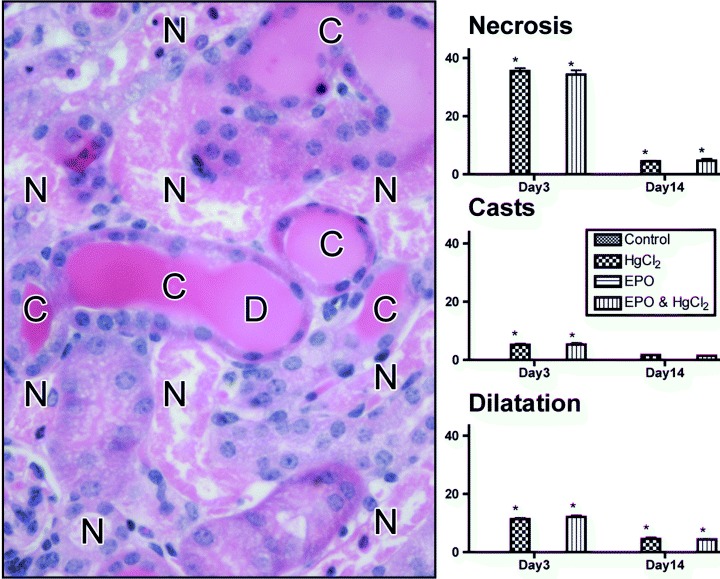
Assessment of renal damage. Transverse section of the kidney, haematoxylin and eosin stained, 3 days after HgCl2 treatment, reveals extensive tubule cell necrosis (N), cast formation (C) and tubule lumen dilatation (D). Histograms display the percentage area containing these features for each treatment group; no damage was seen without HgCl2 treatment. *P < 0.05 effect of HgCl2 versus respective non‐HgCl2 groups.
Table 1.
Haematocrit and serum urea nitrogen levels in mice given mercuric chloride (HgCl2) with or without erythropoietin (EPO)
| Group | Haematocrit (%) | Serum urea nitrogen (mg/dl) | ||
|---|---|---|---|---|
| Day 3 (n = 4) | Day 14 (n = 5) | Day 3 (n = 4) | Day 14 (n = 5) | |
| Control | 35.4 ± 1.2 | 39.3 ± 1.8 | 16.9 ± 2.0 | 15.7 ± 1.6 |
| HgCl2 | 38.1 ± 2.0 | 36.4 ± 1.7 | 109.0 ± 7.5‡ | 79.6 ± 3.2‡ |
| EPO | 45.0 ± 2.9† | 46.4 ± 1.6† | 15.3 ± 1.8 | 20.1 ± 2.4 |
| HgCl2 + EPO | 45.4 ± 2.7† | 45.8 ± 1.4† | 108.6 ± 7.6‡ | 84.9 ± 2.0‡ |
Values are mean ± standard error of mean.
P < 0.05 effect of EPO versus respective non‐EPO group.
P < 0.05 effect of HgCl2 versus respective non‐HgCl2 group.
Short‐term haematopoietic reconstitution following adoptive transfer of BM
The efficiency of short‐term haematopoietic reconstitution was high in all recipient mice, with the great majority of cells in the spleen and BM of recipient females possessing a Y chromosome; indirect fluorescent in situ hybridization (FISH) combined with autoradiography revealed many of these BM‐derived cells were in S‐phase (Fig. 1a–d).
Haematocrit and SUN levels
The mean haematocrit (Table 1) was increased significantly by EPO treatment by day 3 (P < 0.05) irrespective of HgCl2 administration. Values remained elevated at day 14, with still no effect of HgCl2 administration as the interval is too short for uraemic anaemia to develop. Normal levels of haematocrit also indicated that recipient mice did not suffer from dehydration or upper gastrointestinal bleeding. The single dose of HgCl2 induced a significant increase in SUN that was unaffected by EPO; some recovery was evident at day 14, although the more than 4‐fold elevation above normal indicated that renal function remained compromised.
BM‐derived cells in the kidney
Presence of male cells within recipient BM, spleen and kidney was initially detected using direct fluorescence of a FITC‐labelled Y chromosome paint that gave signals over of ∼70% of tubular epithelial cells in male but not in female control kidney (Fig. 1e,f). Confocal imaging established that male cells were present throughout the kidney, and putative epithelial cells were observed (within the boundary of tubule basement membranes) with a Y‐probe signal confined to the nucleus (Fig. 1g–j). However, unambiguous assessment of the phenotype and proliferative status of such cells required the ‘four‐in‐one’ method described below.
Quantification of BM‐derived tubule epithelium and DNA‐synthesizing cells
The ‘four‐in‐one’ protocol enabled us to count tubule cells (which certifiably excludes any intraepithelial lymphocytes or macrophages that might be present, as these cells would not be stained by the lectin histochemistry). Their DNA‐synthesizing (regenerative) status was assessed, and their BM or indigenous origin was determined (Fig. 3). Phenotype of BM‐derived tubule cells was confirmed by lectin‐binding markers, as well as the absence of the pan‐leucocytic marker CD45. At the first time point, when renal damage was most severe (Fig. 4a), percentages of PHA‐L‐positive proximal tubule cells that were Y‐positive were at least doubled by HgCl2 injury. At day 14, when some recovery and regeneration had occurred, the BM cell contribution to proximal tubule epithelium remained similarly and significantly higher: 4.0 ± 0.3 (HgCl2), 3.9 ± 0.2 (EPO and HgCl2) versus 1.3 ± 0.1 (control), 1.4 ± 0.1 (EPO). Thus, the BM cell contribution to proximal tubule cell replacement was increased by ATN but was unaffected by EPO.
Figure 3.

Detection of BM‐derived tubule epithelial cells in S‐phase using the ‘four‐in‐one’ analytical protocol. (a, b) Control tissues stained with PHA lectin (red) and indirect FISH for Y chromosomes (DAB – brown) showing colocalization of staining in the proximal tubule in male (a) but not female (b) tissue. (c, d) A section of female kidney following HgCl2 + EPO treatments; cell marked with the asterisk is positive for PHA‐L (red), has a Y chromosome (brown) within a haematoxylin counterstained nucleus (grey/blue), is within the PAS‐positive basement membrane and has incorporated [3H]thymidine as evidenced by silver grains over the nucleus; reflective in dark‐field (d). (e, f) A section of female kidney following HgCl2 + EPO treatments; cell marked with the asterisk is positive for PHA (red), has a Y chromosome (brown) within a haematoxylin counterstained nucleus (grey/blue), is within the PAS‐positive basement membrane but has not incorporated [3H]thymidine (f).
Figure 4.

Proportions of Y‐positive and [3H]thymidine‐labelled cells. Data are presented for (a) proximal (PHA‐L‐positive) and (b) distal (PNA‐positive) tubules at days 3 and 14 after treatments as shown in the key. *P < 0.05 effect of HgCl2 versus respective non‐HgCl2 groups.
Considering the proliferative status of PHA‐L‐positive proximal tubule cells; at day 3 (Fig. 4a), HgCl2‐induced ATN was accompanied by significant increases in the percentage of cells that were in S‐phase: 7.6 ± 0.4 (HgCl2), 7.5 ± 0.3 (EPO and HgCl2) versus 0.6 ± 0.1 (control), 0.7 ± 0.1 (EPO), P < 0.05. At day 14, percentages of proximal tubule cells in S‐phase remained significantly higher than normal: 4.8 ± 0.3 (HgCl2), 5.0 ± 0.3 (EPO and HgCl2) versus 0.6 ± 0.1 (control), 0.6 ± 0.1 (EPO), P < 0.05. Thus, ATN was followed by a wave of regeneration (12‐fold the normal level at day 3; 8‐fold at day 14) that was unaffected by EPO treatment.
Considering the origin of the PHA‐L‐positive tubule cells in S‐phase, at day 3: for HgCl2‐treated mice, 7.0 ± 0.4% cells were derived from the indigenous kidney cell population and 0.6 ± 0.1% were from BM; and for the EPO and HgCl2 group, 6.9 ± 0.3% cells were derived from the indigenous kidney cell population and 0.7 ± 0.1% were of BM origin (Fig. 4a). At day 14, the majority of DNA‐synthesizing cells was still of indigenous origin: for the HgCl2‐treated mice 4.4 ± 0.3% cells were of indigenous origin and 0.4 ± 0.1% were of BM origin; and for the EPO and HgCl2 group, 4.5 ± 0.3% cells were of indigenous kidney origin and 0.5 ± 0.1% of BM origin (Fig. 4a). Thus, approximately 1 in 12 proximal tubule cells in S‐phase was of BM origin at day 3, and similarly 1 in 11 at day 14; again, there was no effect with EPO treatment.
Very similar patterns of response were seen in the PNA‐labelled distal tubule cells (Fig. 4b), with significant increases in the labelling index in response to ATN, and with the majority of regenerating cells in S‐phase being of indigenous origin, although 1 in 12 was of BM origin. EPO treatment produced no significant effect in these parameters.
DISCUSSION
Conventional two‐dimensional fluorescence microscopy, three‐dimensional reconstruction of laser scanning confocal images and deconvolution techniques have been used to provide evidence for Mengel et al. (2004), Spyridonidis et al. (2004), and Fang et al. (2005) and against Duffield et al. (2005) there being a BM cell‐derived contribution to renal regeneration after injury. Spyridonidis et al. (2004) used a triple staining protocol and confocal microscopy to detect epithelial‐specific cytokeratin, nuclear DNA and the Y chromosome in sections of colon from female patients with graft‐versus‐host disease, after they had received male BM grafts. They concluded that true epithelial chimaerism occurred but did not investigate the proliferative status of cells per specimen. We used our ‘four‐in‐one’ staining protocol, and this confirmed our earlier reports that there is a small basal ‘wear and tear’ contribution from BM cells to generate ∼1.3% of epithelial cells forming the proximal and distal tubules, and showed for the first time that this contribution can be increased to almost 4% during recovery from HgCl2‐induced ATN. One in 12 regenerating cells (in S‐phase) bearing markers for tubule cell differentiation was of BM origin. The proportion is similar to that observed during recovery from folic acid ATN (Fang et al. 2005) and I/R (Lin et al. 2005) in mice.
The adult mammalian kidney has no well‐defined stem cell population, and is unable to produce new nephrons in response to metabolic demand or damage. Tubule cell turnover and regeneration are thought by most to rely on expansion of the resident epithelium. Some groups consider that cell population regeneration may be assisted by epithelial–mesenchymal transition; a process in which tubule cells lose some of their phenotypic markers, migrate through the tubule basement membrane, acquire fibroblastic markers (such as alpha smooth muscle actin), and support the tubule while its surviving epithelium regenerates (Yang & Liu 2001; Strutz et al. 2002). A proportion of this peri‐tubular myofibroblast cell population is BM‐derived (Grimm et al. 2001; Iwano et al. 2002; Roufosse et al. 2006), and mesenchymal–epithelial conversion may explain how some tubule cells come to be of BM origin (2003, 2001; Gupta et al. 2002; 2003, 2005; Mengel et al. 2004; Fang et al. 2005).
The possibility that tubule cell damage increases BM cell contribution to tubules has been studied by groups seeking effects of I/R (Kale et al. 2003; 2003, 2005), or agents like cisplatin (Morigi et al. 2004; Iwasaki et al. 2005) or folic acid (Fang et al. 2005) that induce ATN. The ability of I/R to increase the numbers of BM‐derived tubule cells may be due to mobilization of BM by G‐CSF, or perhaps by EPO, which with its receptor are primary mediators of the normal physiological response to hypoxia, but which also may have other effects (Brines & Cerami 2006), including inhibition of apoptosis, stimulation of tubule cell proliferation (Westenfelder et al. 1999) and mobilization of precursor cells (Bahlmann et al. 2004).
The possibility that some (Fang et al. 2005) or even the majority (Held et al. 2006) of BM‐derived tubule cells may be formed by cell fusion should raise concerns over the long‐term survival and behaviour of these cells. Our results show clearly that some BM‐derived tubule cells entered S‐phase, but the lifespan of these chimaeric cells is unknown, although a recent study has demonstrated that the extent of proximal tubule engraftment by BM cells can reach 50% when a strong selective pressure is exerted (Held et al. 2006).
What factors might account for the lack of effect of EPO in our model? EPO treatment increased haematocrit levels, confirming its biological activity, but it affected neither SUN levels, ATN scores and the numbers of BM‐derived tubule cells, nor the numbers of tubule cells in S‐phase. The effects of EPO reported by others (Vaziri et al. 1994; Bagnis et al. 2001; Yang et al. 2003; Bahlmann et al. 2004; Patel et al. 2004; Sharples et al. 2004; Kang et al. 2005) might depend on the different experimental models studied. We used HgCl2 that causes kidney damage in a different manner from either cisplatin (via binding to nuclear DNA and subsequent interference with normal transcription and/or DNA replication mechanisms) (Fuertesa et al. 2003), renal I/R injury (via tissue hypoxia, with subsequently altered outer medullary microcirculation, inflammation and tubular injury) (Bonventre 1993), or partial nephrectomy (via injury to renal microvascular endothelium, leading to glomerular sclerosis accompanied by ischaemia‐induced tubulointerstitial damage) (Bahlmann et al. 2004). Another possibility is that the gamma irradiation altered expression of EPO receptors, although there is no evidence for this. In clinical settings, most uraemic patients on maintenance dialysis also have long‐term EPO treatment, but renal improvement is seldom observed before successful kidney transplantation. Because the pleiotropic action of EPO is of great interest to nephrologists (Brines & Cerami 2006), we suggest further studies to explore the full potential of EPO, especially to establish which clinical situations would benefit from EPO treatment inclusion.
In summary, we report that regeneration of renal parenchyma after HgCl2 is due primarily to proliferation of indigenous cells, accompanied by a small but significant contribution from BM cells. Our data reveal that as many as 1 in 12 proximal tubular cells in S‐phase was derived from the BM following damage. We hypothesize that the underlying principle behind these observations is that there is either a natural flux of cells from BM to kidney that is stimulated by damage and assists regeneration and repair, or there is a cell fusion process that may produce adverse consequences. EPO did not stimulate the process in this model, but other factors might be able to, and this possibility merits investigation as a way to increase the BM‐derived cell population for regeneration or as a route for cell or gene therapy to help reduce the need for kidney transplantation. Our model and analytical technique are useful tools for examining BM contribution to renal parenchymal regeneration, plus the impact of various cytokines on kidney engraftment and proliferative status (Yen et al. 2004).
Supporting information
Supporting info item
ACKNOWLEDGEMENTS
We are grateful for the generous technical assistance of Gill Hutchinson and George Elia. Parts of this study were presented at the 3rd Annual Meeting of the International Society for Stem Cell Research (23–25 June 2005, San Francisco, CA, USA), the 7th Meeting of the European Cell Proliferation Society (7–10 September 2005, London), the Renal Week 2005 of the American Society of Nephrology (8–13 November 2005, Philadelphia, PA, USA) and the 189th Meeting of the Pathological Society of Great Britain & Ireland (4–6 January 2006, Cambridge, UK).
REFERENCES
- Alison MR, Poulsom R, Jeffery R, Dhillon AP, Quaglia A, Jacob J, Novelli M, Prentice G, Williamson J, Wright NA (2000) Hepatocytes from non‐hepatic adult stem cells. Nature 406, 257. [DOI] [PubMed] [Google Scholar]
- Bagnis C, Beaufils H, Jacquiaud C, Adabra Y, Jouanneau C, Le Nahour G, Jaudon MC, Bourbouze R, Jacobs C, Deray G (2001) Erythropoietin enhances recovery after cisplatin‐induced acute renal failure in the rat. Nephrol. Dial. Transplant. 16, 932–938. [DOI] [PubMed] [Google Scholar]
- Bahlmann FH, Song R, Boehm SM, Mengel M, Von Wasielewski R, Lindschau C, Kirsch T, De Groot K, Laudeley R, Niemczyk E, Guler F, Menne J, Haller H, Fliser D (2004) Low‐dose therapy with the long‐acting erythropoietin analogue darbepoetin alpha persistently activates endothelial Akt and attenuates progressive organ failure. Circulation 110, 1006–1012. [DOI] [PubMed] [Google Scholar]
- Bonventre JV (1993) Mechanisms of ischemic acute renal failure. Kidney Int. 43, 1160–1178. [DOI] [PubMed] [Google Scholar]
- Brines M, Cerami A (2006) Discovering erythropoietin's extra‐hematopoietic functions: Biology and clinical promise. Kidney Int. 70, 246–250. [DOI] [PubMed] [Google Scholar]
- Brittan M, Chance V, Elia G, Poulsom R, Alison MR, Macdonald TT, Wright NA (2005) A regenerative role for bone marrow following experimental colitis: contribution to neovasculogenesis and myofibroblasts. Gastroenterology 128, 1984–1985. [DOI] [PubMed] [Google Scholar]
- Direkze NC, Jeffery R, Hodivala‐Dilke K, Hunt T, Playford RJ, Elia G, Poulsom R, Wright NA, Alison MR (2006) Bone marrow‐derived stromal cells express lineage‐related messenger RNA species. Cancer Res. 66, 1265–1269. [DOI] [PubMed] [Google Scholar]
- Duffield JS, Park KM, Hsiao LL, Kelley VR, Scadden DT, Ichimura T, Bonventre JV (2005) Restoration of tubular epithelial cells during repair of the postischemic kidney occurs independently of bone marrow‐derived stem cells. J. Clin. Invest. 115, 1743–1755. [DOI] [PMC free article] [PubMed] [Google Scholar]
- Fang TC, Alison MR, Cook HT, Jeffery R, Wright NA, Poulsom R (2005) Proliferation of bone marrow‐derived cells contributes to regeneration after folic acid‐induced acute tubular injury. J. Am. Soc. Nephrol. 16, 1723–1732. [DOI] [PubMed] [Google Scholar]
- Fuertesa MA, Castillab J, Alonsoa C, Perez JM (2003) Cisplatin biochemical mechanism of action: from cytotoxicity to induction of cell death through interconnections between apoptotic and necrotic pathways. Curr. Med. Chem. 10, 257–266. [DOI] [PubMed] [Google Scholar]
- Grimm PC, Nickerson P, Jeffery J, Savani RC, Gough J, McKenna RM, Stern E, Rush DN (2001) Neointimal and tubulointerstitial infiltration by recipient mesenchymal cells in chronic renal‐allograft rejection. N. Engl. J. Med. 345, 93–97. [DOI] [PubMed] [Google Scholar]
- Gupta S, Verfaillie C, Chmielewski D, Kim Y, Rosenberg ME (2002) A role for extrarenal cells in the regeneration following acute renal failure. Kidney Int. 62, 1285–1290. [DOI] [PubMed] [Google Scholar]
- Held PK, Al‐Dhalimy M, Willenbring H, Akkari Y, Jiang S, Torimaru Y, Olson S, Fleming WH, Finegold M, Grompe M (2006) In vivo genetic selection of renal proximal tubules. Mol. Ther. 13, 49–58. [DOI] [PubMed] [Google Scholar]
- Hultman P, Enestrom S (1986) Localization of mercury in the kidney during experimental acute tubular necrosis studied by the cytochemical Silver Amplification method. Br. J. Exp. Pathol. 67, 493–503. [PMC free article] [PubMed] [Google Scholar]
- Iwano M, Plieth D, Danoff TM, Xue C, Okada H, Neilson EG (2002) Evidence that fibroblasts derive from epithelium during tissue fibrosis. J. Clin. Invest. 110, 341–350. [DOI] [PMC free article] [PubMed] [Google Scholar]
- Iwasaki M, Adachi Y, Minamino K, Suzuki Y, Zhang Y, Okigaki M, Nakano K, Koike Y, Wang J, Mukaide H, Taketani S, Mori Y, Takahashi H, Iwasaka T, Ikehara S (2005) Mobilization of bone marrow cells by G‐CSF rescues mice from cisplatin‐induced renal failure, and M‐CSF enhances the effects of G‐CSF. J. Am. Soc. Nephrol. 16, 658–666. [DOI] [PubMed] [Google Scholar]
- Juul SE, Yachnis AT, Christensen RD (1998) Tissue distribution of erythropoietin and erythropoietin receptor in the developing human fetus. Early Hum. Dev. 52, 235–249. [DOI] [PubMed] [Google Scholar]
- Kale S, Karihaloo A, Clark PR, Kashgarian M, Krause DS, Cantley LG (2003) Bone marrow stem cells contribute to repair of the ischemically injured renal tubule. J. Clin. Invest. 112, 42–49. [DOI] [PMC free article] [PubMed] [Google Scholar]
- Kang DH, Park EY, Yu ES, Lee YS, Yoon KI (2005) Renoprotective effect of erythropoietin (EPO): possibly via an amelioration of renal hypoxia with stimulation of angiogenesis in the kidney. Kidney Int. 67, 1683. [DOI] [PubMed] [Google Scholar]
- Lin F, Cordes K, Li L, Hood L, Couser WG, Shankland SJ, Igarashi P (2003) Hematopoietic stem cells contribute to the regeneration of renal tubules after renal ischemia‐reperfusion injury in mice. J. Am. Soc. Nephrol. 14, 1188–1199. [DOI] [PubMed] [Google Scholar]
- Lin F, Moran A, Igarashi P (2005) Intrarenal cells, not bone marrow‐derived cells, are the major source for regeneration in postischemic kidney. J. Clin. Invest. 115, 1756–1765. [DOI] [PMC free article] [PubMed] [Google Scholar]
- Mengel M, Jonigk D, Marwedel M, Kleeberger W, Bredt M, Bock O, Lehmann U, Gwinner W, Haller H, Kreipe H (2004) Tubular chimerism occurs regularly in renal allografts and is not correlated to outcome. J. Am. Soc. Nephrol. 15, 978–986. [DOI] [PubMed] [Google Scholar]
- Morigi M, Imberti B, Zoja C, Corna D, Tomasoni S, Abbate M, Rottoli D, Angioletti S, Benigni A, Perico N, Alison M, Remuzzi G (2004) Mesenchymal stem cells are renotropic, helping to repair the kidney and improve function in acute renal failure. J. Am. Soc. Nephrol. 15, 1794–1804. [DOI] [PubMed] [Google Scholar]
- Olsen NV (2003) Central nervous system frontiers for the use of erythropoietin. Clin. Infect. Dis. 37 (Suppl. 4), S323–S330. [DOI] [PubMed] [Google Scholar]
- Patel NS, Sharples EJ, Cuzzocrea S, Chatterjee PK, Britti D, Yaqoob MM, Thiemermann C (2004) Pretreatment with EPO reduces the injury and dysfunction caused by ischemia/reperfusion in the mouse kidney in vivo . Kidney Int. 66, 983–989. [DOI] [PubMed] [Google Scholar]
- Poulsom R, Alison MR, Cook T, Jeffery R, Ryan E, Forbes SJ, Hunt T, Wyles S, Wright NA (2003) Bone marrow stem cells contribute to healing of the kidney. J. Am. Soc. Nephrol. 14 (Suppl. 1), S48–S54. [DOI] [PubMed] [Google Scholar]
- Poulsom R, Forbes SJ, Hodivala‐Dilke K, Ryan E, Wyles S, Navaratnarasah S, Jeffery R, Hunt T, Alison M, Cook T, Pusey C, Wright NA (2001) Bone marrow contributes to renal parenchymal turnover and regeneration. J. Pathol. 195, 229–235. [DOI] [PubMed] [Google Scholar]
- Roufosse C, Bou‐Gharios G, Prodromidi E, Alexakis C, Jeffery R, Khan S, Otto WR, Alter J, Poulsom R, Cook HT (2006) Bone marrow‐derived cells do not contribute significantly to collagen I synthesis in a murine model of renal fibrosis. J. Am. Soc. Nephrol. 17, 775–782. [DOI] [PubMed] [Google Scholar]
- Sharples EJ, Patel N, Brown P, Stewart K, Mota‐Philipe H, Sheaff M, Kieswich J, Allen D, Harwood S, Raftery M, Thiemermann C, Yaqoob MM (2004) Erythropoietin protects the kidney against the injury and dysfunction caused by ischemia‐reperfusion. J. Am. Soc. Nephrol. 15, 2115–2124. [DOI] [PubMed] [Google Scholar]
- Specks U (2000) Are animal models of vasculitis suitable tools? Curr. Opin. Rheumatol. 12, 11–19. [DOI] [PubMed] [Google Scholar]
- Spyridonidis A, Schmitt‐Graff A, Tomann T, Dwenger A, Follo M, Behringer D, Finke J (2004) Epithelial tissue chimerism after human hematopoietic cell transplantation is a real phenomenon. Am. J. Pathol. 164, 1147–1155. [DOI] [PMC free article] [PubMed] [Google Scholar]
- Strutz F, Zeisberg M, Ziyadeh FN, Yang CQ, Kalluri R, Muller GA, Neilson EG (2002) Role of basic fibroblast growth factor‐2 in epithelial‐mesenchymal transformation. Kidney Int. 61, 1714–1728. [DOI] [PubMed] [Google Scholar]
- Togel F, Hu Z, Weiss K, Isaac J, Lange C, Westenfelder C (2005) Administered mesenchymal stem cells protect against ischemic acute renal failure through differentiation‐independent mechanisms. Am. J. Physiol. Renal Physiol. 289, F31–F42. [DOI] [PubMed] [Google Scholar]
- Togel F, Isaac J, Westenfelder C (2004) Hematopoietic stem cell mobilization‐associated granulocytosis severely worsens acute renal failure. J. Am. Soc. Nephrol. 15, 1261–1267. [DOI] [PubMed] [Google Scholar]
- Turnberg D, Botto M, Lewis M, Zhou W, Sacks SH, Morgan BP, Walport MJ, Cook HT (2004) CD59a deficiency exacerbates ischemia‐reperfusion injury in mice. Am. J. Pathol. 165, 825–832. [DOI] [PMC free article] [PubMed] [Google Scholar]
- Vaziri ND, Zhou XJ, Liao SY (1994) Erythropoietin enhances recovery from cisplatin‐induced acute renal failure. Am. J. Physiol. 266, F360–F366. [DOI] [PubMed] [Google Scholar]
- Westenfelder C, Biddle DL, Baranowski RL (1999) Human, rat, and mouse kidney cells express functional erythropoietin receptors. Kidney Int. 55, 808–820. [DOI] [PubMed] [Google Scholar]
- Yang CW, Li C, Jung JY, Shin SJ, Choi BS, Lim SW, Sun BK, Kim YS, Kim J, Chang YS, Bang BK (2003) Preconditioning with erythropoietin protects against subsequent ischemia‐reperfusion injury in rat kidney. FASEB J. 17, 1754–1755. [DOI] [PubMed] [Google Scholar]
- Yang J, Liu Y (2001) Dissection of key events in tubular epithelial to myofibroblast transition and its implications in renal interstitial fibrosis. Am. J. Pathol. 159, 1465–1475. [DOI] [PMC free article] [PubMed] [Google Scholar]
- Yen TH, Wright NA, Poulsom R (2004) Bone marrow stem cells: from development to therapy In: Franklyn J, ed. Horizons in Medicine, Vol. 16, pp. 249–257. London, UK: Royal College of Physicians of London. [Google Scholar]
Associated Data
This section collects any data citations, data availability statements, or supplementary materials included in this article.
Supplementary Materials
Supporting info item