

Abstract
Objectives
The present study aimed to investigate overall effect of quercetin on proliferation and osteogenic differentiation of mouse adipose stem cells (mASCs) in vitro.
Materials and methods
Mouse adipose stem cells were isolated from subcutaneous fat pads and induced into the osteogenic lineage. Effects of quercetin on cell proliferation were assessed using MTT assay. Then they were treated by quercetin for 3, 7 and 11 days in a range of concentrations. Finally, effects of quercetin on osteogenic differentiation of mASCs were analysed by real‐time PCR.
Results
Data of MTT assay showed that quercetin did not enhance mASC proliferation in a dose‐dependent or time‐dependent manner. Results of qPCR indicated that quercetin promoted expressions of Osx, Runx2, BMP‐2, Col‐1, OPN and OCN at the mRNA level in the presence of osteo‐induction medium.
Conclusions
Our data demonstrated that quercetin was not active in terms of enhancing mASCs proliferation; however, it increased osteogenesis of mASCs by up‐regulation of genes including Osx, Runx2, BMP‐2, Col‐1, OPN and OCN.
Introduction
Mesenchymal stem cells (MSCs) derived from adult organs and tissues have the capacity of self‐renewal and differentiation into multi‐lineage tissues 1. MSCs can be isolated from multiple organs and tissues including umbilical cord blood, bone marrow, muscle, adipose tissue and pulp of deciduous teeth 2, 3, 4. Accordingly, MSCs derived from adipose tissues are usually called adipose‐derived stem cells (ASCs). Previous studies have demonstrated that ASCs could be a source of stem cells with easy isolation from fat tissue and relatively high frequency of clonogenic cells 5. As MSCs isolated from other sources, ASCs can also differentiate into cells of osteogenic 6 chondrogenic 7, myogenic 8, adipogenic 9 and hepatic 10 lineages. Thus, ASCs are considered to be a promising cell source for tissue engineering purposes.
Flavonoids are a large group of natural compounds, including catechin, quercetin, rutin and more. They are found in plants and can be consumed by humans as food stuffs. A kind of bioflavonoid, quercetin is present widely in extracts of Ginkgo biloba and edible plants (fruit, vegetables, tea, wine, amongst others) 11; it is the most widely studied product of its kind with potential pharmacological properties and beneficial health effects 12, 13. It has been reported to have advantageous properties, such as being an antioxidant 14, anti‐inflammatory and anti‐carcinogenic 15, 16. Quercetin 17 is claimed to be one of the most prominent antioxidants and able to inhibit activity of enzymes such as those that scavenge free radicals 18. It has been reported that quercetin inhibits both acute and chronic inflammation in rats 18 and exerts growth inhibitory activity on human cancer cells 19, 20, 21, 22, 23. Several recent studies 24, 25, 26 have indicated that quercetin might play a protective role against bone loss. Prouillet et al. 24 found that quercetin significantly increased alkaline phosphatase activity and stimulated MG‐63‐cultured human osteoblasts. Thus, flavonol derivatives may represent a new pharmacological tool for treatment of osteoporosis. A further study 25 has shown that addition of 0.25% rutin (a glycoside containing quercetin) to the diet provided for ovariectomized rats slows down bone resorption, and specially inhibits oestrogen deficiency‐induced bone loss of the femoral trabecular by enhancing osteoblast activity. Meanwhile, other studies have also 26 demonstrated that quercetin could potentially inhibit in vitro bone resorption of osteoclasts and reduce bone resorption in a time‐ and dose‐dependent manner. Up to now, however, no studies had been performed to investigate effects of quercetin on mouse ASCs (mASCs).
In the present study, we investigated overall effect of quercetin on osteogenesis of mASCs. Between quercetin pre‐treated groups and controls, we compared expression of osterix (Osx), runt‐related transcription factor 2 (Runx2), bone morphogenetic protein‐2 (BMP‐2), collagen‐1 (Col‐1), osteopontin (OPN) and osteocalcin (OCN) after osteogenic induction, and analysed effects of quercetin on cell proliferation.
Materials and methods
Isolation and culture of mASCs
Work with 4‐week‐old female Kunming mice used in this study was approved by the Sichuan University Experimental Animal Center, in accordance with the International Guiding Principles for Animal Research (1985). Subcutaneous fat pads were dissected from the groin and back of the mice and washed extensively in germ‐free PBS to remove remaining debris. Tissues were then chopped and digested in 0.075% type I collagenase (Sigma‐Aldrich, St. Louis, MO, USA) in α‐MEM medium without FBS, for an hour at 37 °C with agitation. Sequentially, cells were filtered and collected at 300 g for 8 min by centrifugation. Resulting pellets were suspended and washed three times in medium. Then, cells were seeded in tissue culture flasks with α‐MEM medium plus 10% FBS and cultured at 37 °C in a humidified atmosphere with 5% CO2. After 3–5 days, adherent cells were incubated in a monolayer while non‐adherent cells were removed. mASCs were passaged three times before all assays.
Immunofluorescence staining for mASCs
To demonstrate phenotype of mASCs, the third passage cells were placed on glass coverslips for immunofluorescence staining. They were briefly washed three times in PBS, fixed in cold paraformaldehyde for 20 min at room temperature, then blocked in 0.5% bovine serum albumin for 20 min. Coverslips were incubated at room temperature in alexa fluor 488 anti‐mouse CD44 (Biolegend, San Diego, CA, USA) for 0.5 h, CD90 (Biolegend) for 2 h, CD146 (Biolegend) for 1.5 h and α‐SMA (Abcam, Cambridge, MA, USA) for 2 h, respectively. Sequentially, cells were incubated in secondary antibodies conjugated to FITC (Goat Anti‐Mouse IgG; Zhongshanjinqiao, Beijing, China) for 0.5 h at room temperature. Nuclei were counterstained with DAPI (Molecular Probes, Eugene, OR, USA) for 5 min. After being rinsed in PBS, cells were observed and photomicrographs were taken using a DMi 6000‐B fluorescence microscope (Leica, Wetzlar, Germany). Image analysis was performed using Image‐Pro Plus 6.0.0.260 (Media Cybernetics, Inc, Rockville, MD, USA), and integral optical density was measured to evaluate CD44, CD90, CD146 and α‐SMA concentration.
MTT testing
Effects of quercetin on cell proliferation were assessed using the MTT assay [3‐(4,5‐dimethylthiazol‐2‐yl)‐2,5‐diphenyltetrazolium bromide]. mASCs were seeded in 96‐well plates at 1000 cells per well in growth medium for 24 h, and treated with quercetin at different concentrations (10, 50 and 100 μm) for 1–5 days, respectively. Cells cultured in control medium (CC group) and osteogenic medium (OM group) served as controls. Each plate was treated with a solution of 20 μl (1 mg/ml) MTT (Zhongshanjinqiao) and incubated for 4 h at 37 °C. After medium was removed, formed formazan crystals were dissolved in 150 μl dimethyl sulphoxide (DMSO). Control cultures were treated without test samples and with DMSO. Subsequently, optical density was read at test wavelength of 570 nm on the plate reader referring to wavelength 630 nm. Each experiment was repeated twice and mean value of the three experiments was considered as the result. Cell number was determined according to the standard curve.
Quercetin treatment and osteogenic induction
After passaging three times, mASCs were seeded into six‐well plates at initial density 2 × 10⁵ cells/ml, and cultured in basic medium for 2 days, to reach confluence. Once 60% confluence was reached, all wells were divided into five experimental groups: one negative control group (Control), one positive control (OM) and 3 quercetin‐treated groups (10, 50 and 100 mm). At least three parallel wells were used in each group. Quercetin (Sigma) was dissolved in sterile PBS to obtain stock solution of 1 mm, which was then diluted with basic medium to desired concentrations. Cells cultured in basic medium alone were set up as negative control. Cells cultured in OM were used as positive control. In quercetin groups, mASCs were cultured in osteogenic media containing quercetin at different concentrations (10, 50 and 100 μm, respectively). Total RNA was extracted from all groups at days 3, 7 and 11. OM was made by dissolving dexamethasone (10 nm), ascorbate 2‐phosphate (50 μm), β‐glycerophosphate (10 mm) in α‐MEM.
Extraction of total RNA, RT‐PCR and real‐time PCR
Expression of Osx, Runx2, Bmp‐2, Col‐1, OPN and OCN at transcriptional levels was investigated utilizing real‐time PCR assay. Initially, we extracted total RNA using Simply P total Tissue/cell RNA extraction kit (BioFlux, Hangzhou, China). cDNA synthesis was performed using PrimeScript RT reagent Kit with gDNA Eraser (Takara Bio, Tokyo, Japan) according to manufacturer's protocol. Agarose electrophoresis was applied to test total RNA and cDNA of each sample according to the method outlined in Molecular Cloning: A Laboratory Manual (2001, 3rd edition). RT‐PCR kit (Tiangen, Beijing, China) was used to amplify cDNA samples; primers are listed in Table 1. Then, expression of certain genes was quantified in real‐time PCR using ABI PRISM 7300 Sequence Detection system (Applied Biosystems, Foster City, CA, USA) with the program containing 95 °C, 10 min; 40 cycles of 95 °C, 15 s; 60 °C, 1 min. A melting curve was generated with each reaction to test primer dimmer formation/ false priming. Then relative expression of PCR products was verified by double standard curve analysis. Results of real‐time PCR were normalized by GAPDH for comparison of target gene transcription levels in different samples.
Table 1.
Primer sequences of target genes and housekeeping genes for RT‐PCR assay
| Sequence (5′→3′) | Length of products | GenBank number | |
|---|---|---|---|
| GAPDH | F: GACGGCCGCATCTTCTTGTGC | 192 | NM_008084.2 |
| R: TGCAAATGGCAGCCCTGGTGA | |||
| Osx | F: GTCCTATGGCGGGGAGGACTGG | 173 | NM_130458.3 |
| R: TGGCAGCTGCAAGCTCTCTGTA | |||
| Runx2 | F: CCGAACTGGTCCGCACCGAC | 199 | NM_009820.4 |
| R: CTTGAAGGCCACGGGCAGGG | |||
| BMP2 | F: ACCCCCAGCAAGGACGTCGT | 168 | NM_007553.2 |
| R: TGGAAGCTGCGCACGGTGTT | |||
| Col‐1 | F: CCACCCCAGCCGCAAAGAGTC | 198 | NM_007742.3 |
| R: GTCATCGCACACAGCCGTGC | |||
| OCN | F: AGCAGCTTGGCCCAGACCTA | 164 | NM_001032298 |
| R: TGAGGCTCCAAGGTAGCGCC | |||
| OPN | F: GTGGTGATCTAGTGGTGCCAAGAGT | 157 | NM_009263 |
| R: AGGCACCGGCCATGTGGCTAT |
Data statistical analysis
All experiments were repeated at least three times with similar results obtained. Differences within groups in all assays were tested by ANOVA and Dunnett's t‐test was conducted to analyse effectiveness of different quercetin concentrations. Differences were considered statistically significant at P < 0.05. All statistical analyses were implemented with spss 19.0 software (SPSS Inc., Chicago IL, USA).
Results
mASC characterization
To characterize cells we isolated from fat tissue, we performed immunofluorescence staining to test expression of a number of charcteristic CD markers. As shown in Fig. 1, our cells were positive for α‐SMA, CD44, CD146, and negative for CD90; this is a typical phenotype for ASCs.
Figure 1.
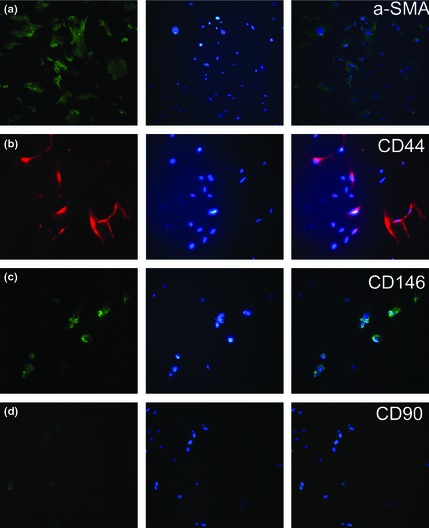
Immunofluorescence staining of CD markers on mouse adipose stem cells revealed expressions of α‐SMA (a), CD44 (b), CD146 (c), and absence of CD90 (d).
MTT results
Effects of the range of concentrations of quercetin on ASC proliferation for 1–5 days are shown in Fig. 2. It was observed that cell number was significantly higher in the 100 μm group than in controls on day 1 (P < 0.05). Number of cells was significantly higher in OM group on day 1 compared to the 10 μm‐treated group (P < 0.05). However, there was no significant difference between the groups on day 2. Quercetin (10 μm) significantly enhanced mASC proliferation after 3 days incubation compared to the other 4 groups (controls, OM group 50 and 100 μm group) (P < 0.05). In the 50 μm group on day 3, numbers were significantly higher compared to controls (P < 0.05). On day 4, cell numbers in quercetin‐treated groups and control groups were not significantly different. On day 5, both 10 and 50 μm groups revealed a significant effect compared to the control group (P < 0.05). In the group treated with quercetin at 100 μm and OM, cell numbers were significantly higher than all other groups (P < 0.05). Overall, none of the quercetin‐treated groups consistently exhibited any effect of enhancing mASC proliferation.
Figure 2.
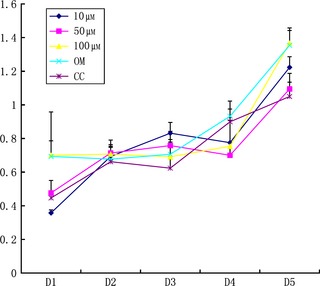
Effects of various concentrations of quercetin on proliferation of mouse adipose stem cells. 10, 50 and 100 μm are concentrations of quercetin in the media. OM, osteogenic medium; CC, control group cultured in basal medium.
Quercetin promoted Osx, Runx2, Bmp‐2, Col, OPN and OCN transcription after osteogenic induction
After 3, 7 and 11 days, quercetin incubation plus osteogenic differentiation, Osx, Runx2, BMP2, Col I, OPN and OCN mRNAs were examined by real‐time PCR (Fig. 3).
Figure 3.
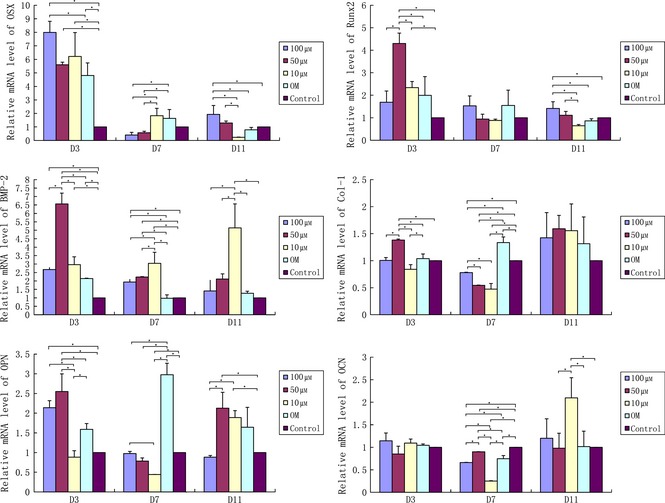
Quantitative RT‐PCR analysis of Osx, Runx2, BMP‐2, Col‐I, OPN and OCN at different time points. Quercetin promoted Osx, Runx2, BMP‐2, Col‐I, OPN and OCN transcription in mouse adipose stem cells compared to controls after osteogenic induction. #*Represent significant differences between control and treated groups, respectively (P < 0.05 by ANOVA).
Osx transcription
mRNA levels of Osx in the three quercetin groups (100 μm, 50 μm and 10 μm) were significantly higher than that in control groups on day 3 (P < 0.05), and that in 100 μm quercetin groups was significantly higher than in OM groups (P < 0.05). However, mRNA level of Osx in 100 μm quercetin groups was significantly lower than the 10 μm and OM quercetin groups on day 7 (P < 0.05). Additionally, transcript levels of OSX gene coding in 50 μm groups were similar than the 100 μm quercetin in groups on the same day. On day 11, this was significantly higher in 100 μm quercetin groups than in the other three groups (10 μm, OM and controls) (P < 0.05). Also, it was found to be higher in the 50 μm group compared to the 10 μm group on day 11 (P < 0.05) (Fig. 3).
Runx2 transcription
Runx2 transcript levels in 50 μm quercetin groups were significantly higher than in the other four groups (50 μm, 10 μm, OM and controls) on day 3 (P < 0.05), and on day 11, 100 μm quercetin groups were significantly higher compared to the three quercetin‐treated groups (10 μm, OM and controls) (P < 0.05). Additionally, transcript levels of the gene coding for Runx‐2 in 10 μm quercetin‐treated groups were significantly higher compared to controls on day 3 (P < 0.05). However, it was the opposite between the two groups on day 11 (P < 0.05). On day 7, there were no differences between the groups (Fig. 3).
BMP‐2 transcription
On day 3, mRNA levels of Bmp‐2 in the four groups (100 μm, 50 μm, 10 μm and OM) were significantly higher compared to control groups (P < 0.05). It was also significantly higher in the 50 μm‐treated groups compared to the other three groups (100 μm, 10 μm, OM) on day 3 (P < 0.05). Transcript levels of the three quercetin‐treated groups (100 μm, 50 μm and 10 μm) on day 7 were significantly higher compared to OM and controls (P < 0.05). Moreover, in the 10 μm group, it was significantly higher than in 100 μm‐ and 50 μm‐treated groups on day 11 (P < 0.05) (Fig. 3).
Col‐I transcription
In the 50 μm quercetin groups, Col‐I transcription was significantly higher compared to the other four groups (100 μm, 10 μm, 0 μm and controls) on day 3 (P < 0.05). Transcript levels of Col‐I in both the OM groups and controls were significantly higher compared to all three groups (100 μm, 50 μm and 10 μm) on day 7 (P < 0.05). Additionally, in the 100 μm groups, it was significantly higher compared to 50 and 10 μm groups on day 7. There were no differences between groups on day 11 (P < 0.05) (Fig. 3).
OPN transcription
mRNA levels of OPN in 10 μm quercetin‐treated groups suggested a reduction compared to the other groups (100 μm, 50 μm and OM) on day 3 (P < 0.05). At the same time, expression of OPN gene in 50 μm groups was significantly higher compared to OM groups on day 3 (P < 0.05). In addition, both in 100 μm and 50 μm groups, values on day 3 were significantly higher compared to controls (P < 0.05). However, it was significantly higher in OM groups than in the other three quercetin‐treated ones (100 μm, 50 μm and 10 μm), and transcript levels of OPN of 100 μm groups and the controls were significantly higher compared to 10 μm groups on day 7 (P < 0.05). Additionally, 50 μm and 10 μm groups were significantly higher compared to 100 μm after 11 days incubation (P < 0.05). Moreover, results were similar to those of controls (Fig. 3).
OCN transcription
On day 3, there was no difference about the OCN transcription level among the groups. On day 7, expression of OCN gene in the three quercetin‐treated groups (100 μm, 50 μm and 10 μm) was significantly lower compared to controls (P < 0.05). Both 100 μm and 10 μm groups were significantly lower than 50 μm and OM groups, respectively (P < 0.05), and it was significantly lower in 10 μm groups compared to 100 μm groups on day 7 (P < 0.05). However, in the 10 μm quercetin‐treated groups, mRNA levels were significantly higher compared to the other three groups (50 μm, 0 μm and controls) on day 11 (P < 0.05) (Fig. 3).
Discussion
Adipose stem cells isolated with current protocols include a mixture of several cell types. Besides actual stem cells or progenitors, fibroblasts or other cells may also be propagated in vitro. It may be difficult to evaluate results of ASC studies due to lack of enrichment of stem cells or progenitors by cell markers. Recent studies have shown that a combination of markers is useful for identifying stem cells or progenitors in heterogenic cell populations. As reported, typical ASCs should express markers such as α‐SMA, CD44 and CD146, but not CD90 27, 28, 29, 30. The cells we isolated from mouse fat pads exhibited the same phenotype as mentioned above.
MTT assay, as a tetrazolium reduction‐based methodology for viable cells, has also been thoroughly used to assess mitochondrial dehydrogenase activity and measure cell viability 31. Data concerning influence of quercetin on mASC growth have not been demonstrated in previous studies. Accordingly, as indicated by our data, quercetin has no clear potential of any time‐dependent effect on enhancment or reduction of mASC proliferation under the experimental conditions we tested. Results showed that our three concentrations were inactive on mASC proliferation and no optimal concentration was found in our experimental setup.
During the process of osteogenic differentiation of mesenchymal progenitor cells, a group of osteogenic genes is expressed in a characteristic pattern. In studies of testing osteogenic potential of stem cells under certain stimuli, these genes are usually evaluated to determine whether the stimuli are effective. In general, both Osx and Runx2 are essential transcription factors for early stages of osteogenic differentiation from mesenchymal cells 32. BMP‐2 is also considered as an early marker, while Col‐I and OCN are late markers, concomitant with the process of mineralization. OPN appears twice, that is, during proliferation and later in stages of differentiation 33. Osx, located downstream of Runx2 32, plays an important role in bone tissue formation 32 and is highly specific to osteoblasts 32. Runx2, is a master regulator of osteogenesis 34, 35, is up‐regulated early in osteoblast differentiation 36 and activates expression of many further downstream osteoblast genes, such as OCN and Col1‐a1 37, 38. As a key mediator of bone development, BMP‐2 stimulates osteogenic differentiation and plays an important role in initiating and regulating bone formation and healing 39, 40, 41, 42, 43, 44. Similarly, Col‐I belongs to the main structural component of bone matrix and is expressed from initial stages of osteoblast differentiation. A further marker gene of bone differentiation is OPN which promotes remodelling of bone 45, 46. As a non‐collagenous matrix protein, OPN is important in stabilizing the matrix and has an active effect on reconstructing bone mineralization tissue 47, 48. OCN is another non‐collagenous protein, which is present at the late differentiation stage, possibly for regulating matrix mineralization 49.
Although several results were not significant, our outcome by PCR indicated an increased trend in expression of genes consistent with previous studies. In general, our data demonstrated that quercetin promoted transcription of mASC Osx, Runx2, BMP‐2, Col‐1, OPN and OCN after osteogenic induction. Inductive effects were more prominent on early markers of osteogenesis such as BMP‐2, Osx and Runx2 as summarized in Fig. 4.
Figure 4.
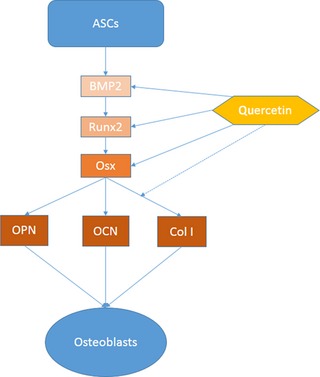
Schematics of hierarchy of gene expressions during differentiation from adipose stem cells to osteoblasts. Dominant effects of quercetin are indicated by solid arrows, while minor effects are indicated by dashed arrows.
Wattel et al. 26 showed that quercetin was potentially able to inhibit resorption of osteoclasts in vitro with reduced bone resorption in a time‐ and dose‐dependent manner, at concentrations ranging from 0.1 to 100 μm. The study suggested that antioxidant properties partially explained the inhibitory effect on bone resorption. Moreover, it was indicated that 0.25% rutin (a glycoside containing quercetin) inhibited femoral trabecular bone loss induced by oestrogen deficiency to make bone resorption slower and increase osteoblast activity 25. Our research showed that 10 and 50 μm partially promoted RNA levels of the related mASC genes after osteogenic induction, which was in accord with previous results. However, effects of quercetin at certain concentrations were not identified. Accordingly, the results of this study have shown that there were no more quercetin‐treated groups of different concentrations; this was due to design limitations here. Exact concentration of quercetin is very important for osteoblast differentiation of mASCs. Thus, in future research, the range of concentrations will be expanded based on this work. In addition, multiple parallel experiments need to be performed to optimize concentration of quercetin for enhancing osteogenic differentiation of mASCs. Prouillet et al. 24 found that quercetin significantly increased alkaline phosphatase activity and stimulated osteoblast activity of MG‐63‐cultured human osteoblasts. It has been suggested that flavonol derivatives may represent a new pharmacological tool for treatment of osteoporosis. Thus, the capacity of quercetin must be advanced to improve it for increasing osteogenic differentiation of mASCs; this could bring about a more fulfilled future to treat diseases such as osteoporosis.
In conclusion, our data have demonstrated that quercetin was not active on mASC proliferation, but generally enhanced their osteogenesis by up‐regulating gene expression of osteoblast markers such as Osx, Runx2, BMP‐2, Col‐1, OPN and OCN.
Acknowledgements
This work was funded by National Natural Science Foundation of China (81071273, 31170929), Foundation for the Author of National Excellent Doctoral Dissertation of China (FANEDD 200977), Funding for Distinguished Young Scientists in Sichuan (2010JQ0010).
Competing interests: The authors have declared that no competing interests exist.
References
- 1. Le Blanc K, Pittenger M (2005) Mesenchymal stem cells: progress toward promise. Cytotherapy 7, 36–45. [DOI] [PubMed] [Google Scholar]
- 2. Lee OK, Kuo TK, Chen WM, Lee KD, Hsieh SL, Chen TH (2004) Isolation of multipotent mesenchymal stem cells from umbilical cord blood. Blood 103, 1669–1675. [DOI] [PubMed] [Google Scholar]
- 3. Kern S, Eichler H, Stoeve J, Kluter H, Bieback K (2006) Comparative analysis of mesenchymal stem cells from bone marrow, umbilical cord blood, or adipose tissue. Stem Cells 24, 1294–1301. [DOI] [PubMed] [Google Scholar]
- 4. Phinney DG, Kopen G, Isaacson RL, Prockop DJ (1999) Plastic adherent stromal cells from the bone marrow of commonly used strains of inbred mice: variations in yield, growth, and differentiation. J. Cell. Biochem. 72, 570–585. [PubMed] [Google Scholar]
- 5. Mizuno H (2009) Adipose‐derived stem cells for tissue repair and regeneration: ten years of research and a literature review. J. Nippon Med. Sch. 76, 56–66. [DOI] [PubMed] [Google Scholar]
- 6. Kakudo N, Shimotsuma A, Miyake S, Kushida S, Kusumoto K (2008) Bone tissue engineering using human adipose‐derived stem cells and honeycomb collagen scaffold. J. Biomed. Mater. Res. A 84, 191–197. [DOI] [PubMed] [Google Scholar]
- 7. Winter A, Breit S, Parsch D, Benz K, Steck E, Hauner H et al (2003) Cartilage‐like gene expression in differentiated human stem cell spheroids: a comparison of bone marrow–derived and adipose tissue–derived stromal cells. Arthritis Rheum. 48, 418–429. [DOI] [PubMed] [Google Scholar]
- 8. Zuk PA, Zhu M, Ashjian P, De Ugarte DA, Huang JI, Mizuno H et al (2002) Human adipose tissue is a source of multipotent stem cells. Mol. Biol. Cell 13, 4279–4295. [DOI] [PMC free article] [PubMed] [Google Scholar]
- 9. Gimble J, Guilak F (2002) Adipose‐derived adult stem cells: isolation, characterization, and differentiation potential. Cytotherapy 5, 362–369. [DOI] [PubMed] [Google Scholar]
- 10. Banas A, Teratani T, Yamamoto Y, Tokuhara M, Takeshita F, Osaki M et al (2009) Rapid hepatic fate specification of adipose‐derived stem cells and their therapeutic potential for liver failure. J. Gastroenterol. Hepatol. 2009, 70–77. [DOI] [PubMed] [Google Scholar]
- 11. Kühnau J (1976) The flavonoids, a class of semi‐essential food components: their role in human nutrition. World Rev. Nutr. Diet 24, 117–191. [PubMed] [Google Scholar]
- 12. Wu BY, Yu AC (2000) Quercetin inhibits c‐fos, heat shock protein, and glial fibrillary acidic protein expression in injured astrocytes. J. Neurosci. Res. 62, 730–736. [DOI] [PubMed] [Google Scholar]
- 13. Utesch D, Feige K, Dasenbrock J, Broschard TH, Harwood M, Danielewska‐Nikiel B et al (2008) Evaluation of the potential in vivo genotoxicity of quercetin. Mutat. Res. 654, 38–44. [DOI] [PubMed] [Google Scholar]
- 14. Bors W, Michel C, Saran M (1994) Flavonoid antioxidants: rate constants for reactions with oxygen radicals. Methods Enzymol. 234, 420–429. [DOI] [PubMed] [Google Scholar]
- 15. Skibola CF, Smith MT (2000) Potential health impacts of excessive flavonoid intake. Free Radic. Biol. Med. 29, 375–383. [DOI] [PubMed] [Google Scholar]
- 16. Hollman PC, Katan MB (1999) Dietary flavonoids: intake, health effects and bioavailability. Food Chem. Toxicol. 37, 937–942. [DOI] [PubMed] [Google Scholar]
- 17. Borbulevych OY, Jankun J, Selman SH, Skrzypczak‐Jankun E (2004) Lipoxygenase interactions with natural flavonoid, quercetin, reveal a complex with protocatechuic acid in its X‐ray structure at 2.1 A resolution. Proteins 54, 13–19. [DOI] [PubMed] [Google Scholar]
- 18. Guardia T, Rotelli AE, Juarez AO, Pelzer LE (2001) Anti‐inflammatory properties of plant flavonoids. Effects of rutin, quercetin and hesperidin on adjuvant arthritis in rat. Farmaco 56, 683–687. [DOI] [PubMed] [Google Scholar]
- 19. Scambia G, Rannelletti FO, Benedetti Panici P, Piantelli M, Bonanno G, De Vincenzo R et al (1990) Inhibitory effect of quercetin on OVCA 433 cells and presence of type‐II oestrogen binding sites in primary ovarian tumors and cultured cells. Br. J. Cancer 62, 942–946. [DOI] [PMC free article] [PubMed] [Google Scholar]
- 20. Scambia G, Ranelletti FO, Benedetti‐Panici P, Piantelli M, De Vincenzo R, Ferrandina G et al (1993) Quercetin induces type‐II estrogen binding sites in estrogen‐receptor‐negative (MDAMB‐231) and estrogen‐receptor‐positive (MCF‐7) human breast cancer cell lines. Int. J. Cancer 54, 462–466. [DOI] [PubMed] [Google Scholar]
- 21. Kuo SM (1996) Antiproliferative potency of structurally distinct dietary flavonoids on human colon cancer cells. Cancer Lett. 110, 41–48. [DOI] [PubMed] [Google Scholar]
- 22. Singhal RL, Yeah YA, Prajda N, Olah E, Sledge GS, Weber G (1995) Quercetin down‐regulates signal transduction in human breast carcinoma cells. Biochem. Biophys. Res. Commun. 208, 425–431. [DOI] [PubMed] [Google Scholar]
- 23. Larocca LM, Piantelli M, Leone G, Sica S, Teofili L, Benedetti Panici P et al (1990) Type‐II oestrogen binding sites in acute lymphoid and myeloid leukemias: growth inhibitory effect of oestrogen and flovonoids. Br. J. Haematol. 75, 489–495. [DOI] [PubMed] [Google Scholar]
- 24. Prouillet C, Mazière JC, Mazière C, Wattel A, Brazier M, Kamel S (2004) Stimulatory effect of naturally occurring flavonols quercetin and kaempferol on alkaline phosphatase activity in MG‐63 human osteoblasts through ERK and estrogen receptor pathway. Biochem. Pharmacol. 67, 1307–1313. [DOI] [PubMed] [Google Scholar]
- 25. Horcajada‐Molteni MN, Crespy V, Coxam V, Davicco MJ, Rémésy C, Barlet JP (2000) Rutin inhibits ovariectomy‐induced osteopenia in rats. J. Bone Miner. Res. 15, 2251–2258. [DOI] [PubMed] [Google Scholar]
- 26. Wattel A, Kamel S, Mentaverri R, Lorget F, Prouillet C, Petit JP et al (2003) Potent inhibitory effect of naturally occurring flavonoids quercetin and kaempferol on in vitro osteoclastic bone resorption. Biochem. Pharmacol. 65, 35–42. [DOI] [PubMed] [Google Scholar]
- 27. Katoh S, Matsumoto N, Kawakita K, Tominaga A, Kincade PW, Matsukura S (2003) A role for CD44 in an antigen‐induced murine model of pulmonary eosinophilia. J. Clin. Invest. 111, 1563–1570. [DOI] [PMC free article] [PubMed] [Google Scholar]
- 28. Baer PC, Kuçi S, Krause M, Kuçi Z, Zielen S, Geiger H et al (2013) Comprehensive phenotypic characterization of human adipose‐derived stromal/stem cells and their subsets by a high throughput technology. Stem Cells Dev. 22, 330–339. [DOI] [PubMed] [Google Scholar]
- 29. Zannettino AC, Paton S, Arthur A, Khor F, Itescu S, Gimble JM et al (2008) Multipotential human adipose‐derived stromal stem cells exhibit a perivascular phenotype in vitro and in vivo. J. Cell. Physiol. 214, 413–421. [DOI] [PubMed] [Google Scholar]
- 30. Gronthos S, Franklin DM, Leddy HA, Robey PG, Storms RW, Gimble JM (2001) Surface protein characterization of human adipose tissue‐derived stromal cells. J. Cell. Physiol. 189, 54–63. [DOI] [PubMed] [Google Scholar]
- 31. Fernandes AS, Gaspar J, Cabral MF, Caneiras C, Guedes R, Rueff J et al (2007) Macrocyclic copper (II) complexes: superoxide scavenging activity, structural studies and cytotoxicity evaluation. J. Inorg. Biochem. 101, 849–858. [DOI] [PubMed] [Google Scholar]
- 32. Nakashima K, Zhou X, Kunkel G, Zhang Z, Deng JM, Behringer RR et al (2002) The novel zinc finger‐containing transcription factor osterix is required for osteoblast differentiation and bone formation. Cell 108, 17–29. [DOI] [PubMed] [Google Scholar]
- 33. Huang W, Yang SY, Shao JZ, Li YP (2013) Signaling and transcriptional regulation in osteoblast commitment and differentiation. Front. Biosci. 12, 3068–3092. [DOI] [PMC free article] [PubMed] [Google Scholar]
- 34. Zhang X, Yang M, Lin L, Chen P, Ma K, Zhou C et al (2006) Runx2 overexpression enhances osteoblastic differentiation and mineralization in adipose‐derived stem cells in vitro and in vivo. Calcif. Tissue Int. 79, 169–178. [DOI] [PubMed] [Google Scholar]
- 35. Pockwinse SM, Rajgopal A, Young DW, Mujeeb KA, Nickerson J, Javed A et al (2005) Microtubule‐dependent nuclear‐cytoplasmic shuttling of Runx2. J. Cell. Physiol. 206, 354–362. [DOI] [PubMed] [Google Scholar]
- 36. Enomoto H, Furuichi T, Zanma A, Yamana K, Yoshida C, Sumitani S et al (2004) Runx2 deficiency in chondrocytes causes adipogenic changes in vitro. J. Cell Sci. 117, 417–425. [DOI] [PubMed] [Google Scholar]
- 37. Ducy P, Zhang R, Geoffroy V, Ridall AL, Karsenty G (1997) Osf2/Cbfa1: a transcriptional activator of osteoblast differentiation. Cell 89, 747–754. [DOI] [PubMed] [Google Scholar]
- 38. Kern B, Shen J, Starbuck M, Karsenty G (2001) Cbfa1 contributes to the osteoblast‐specific expression of type I collagen genes. J. Biol. Chem. 276, 7101–7107. [DOI] [PubMed] [Google Scholar]
- 39. Harris SE, Bonewald LF, Harris MA, Sabatini M, Dallas S, Feng JQ et al (1994) Effects of transforming growth factor beta on bone nodule formation and expression of bone morphogenetic protein 2, osteocalcin, osteopontin, alkaline phosphatase, and type I collagen mRNA in long‐term cultures of fetal rat calvarial osteoblasts. J. Bone Miner. Res. 9, 855–863. [DOI] [PubMed] [Google Scholar]
- 40. Wang EA, Rosen V, D'Alessandro JS, Bauduy M, Cordes P, Harada T et al (1990). Recombinant human bone morphogenetic protein induces bone formation. Proc. Natl. Acad. Sci. USA 87, 2220–2224. [DOI] [PMC free article] [PubMed] [Google Scholar]
- 41. Yamaguchi A, Ishizuya T, Kintou N, Wada Y, Ketagiri T, Wozney JM et al (1996) Effects of BMP‐2, BMP‐4, and BMP‐6 on osteoblastic differentiation of bone marrow derived stromal cell lines, ST2 and MC3T3–G2/PA6. Biochem. Biophys. Res. Commun. 220, 366–371. [DOI] [PubMed] [Google Scholar]
- 42. Xiao G, Gopalakrishnan R, Jiang D, Reith E, Benson MD (2000) Bone morphogenetic proteins, extracellular matrix, and mitogen‐activated protein kinase signaling pathways are required for osteoblast‐specific gene expression and differentiation in MC3T3‐E1 cells. J. Bone Miner. Res. 17, 101–110. [DOI] [PubMed] [Google Scholar]
- 43. Cho TJ, Gerstenfeld LC, Einhorn TA (2002) Differential temporal expression of members of the transforming growth factor beta superfamily during murine fracture healing. J. Bone Miner. Res. 17, 513–520. [DOI] [PubMed] [Google Scholar]
- 44. Tsuji K, Bandyopadhyay A, Harfe BD, Cox K, Kakar S, Gerstenfeld L et al (2006) BMP2 activity, although dispensable for bone formation, is required for the initiation of fracture healing. Nat. Genet. 38, 1424–1429. [DOI] [PubMed] [Google Scholar]
- 45. Kojima H, Uede T, Uemura T (2004) In vitro and in vivo effects of the overexpression of osteopontin on osteoblast differentiation using a recombinant adenoviral vector. J. Biochem. 136, 377–386. [DOI] [PubMed] [Google Scholar]
- 46. Yang YQ, Tan YY, Wong R, Wenden A, Zhang LK, Rabie AB (2012) The role of vascular endothelial growth factor in ossification. Int. J. Oral. Sci. 4, 64–68. [DOI] [PMC free article] [PubMed] [Google Scholar]
- 47. Brinker MR, O'Connor DP (2004) The incidence of fractures and dislocations referred for orthopaedic services in a capitated population. J. Bone Joint Surg. 86, 290–297. [PubMed] [Google Scholar]
- 48. Rangiani A, Cao ZG, Liu Y, Voisey Rodgers A, Jiang Y, Qin CL et al (2012) Dentin matrix protein 1 and phosphate homeostasis are critical for postnatal pulp, dentin and enamel formation. Int. J. Oral Sci. 4, 189–195. [DOI] [PMC free article] [PubMed] [Google Scholar]
- 49. Thomas GP, Baker SU, Eisman JA, Gardiner EM (2001) Changing RANKL/OPG mRNA expression in differentiating murine primary osteoblasts. J. Endocrinol. 170, 451–460. [DOI] [PubMed] [Google Scholar]