

Abstract
Abstract. Objectives: Microgravity is known to affect the differentiation of bone marrow mesenchymal stem cells (BMSCs). However, a few controversial findings have recently been reported with respect to the effects of microgravity on BMSC proliferation. Thus, we investigated the effects of simulated microgravity on rat BMSC (rBMSC) proliferation and their osteogeneic potential. Materials and methods: rBMSCs isolated from marrow using our established effective method, based on erythrocyte lysis, were identified by their surface markers and their proliferation characteristics under normal conditions. Then, they were cultured in a clinostat to simulate microgravity, with or without growth factors, and in osteogenic medium. Subsequently, proliferation and cell cycle parameters were assessed using methylene blue staining and flow cytometry, respectively; gene expression was determined using Western blotting and microarray analysis. Results: Simulated microgravity inhibited population growth of the rBMSCs, cells being arrested in the G0/G1 phase of cell cycle. Growth factors, such as insulin‐like growth factor‐I, epidermal growth factor and basic fibroblastic growth factor, markedly stimulated rBMSC proliferation in normal gravity, but had only a slight effect in simulated microgravity. Akt and extracellular signal‐related kinase 1/2 phosphorylation levels and the expression of core‐binding factor α1 decreased after 3 days of clinorotation culture. Microarray and gene ontology analyses further confirmed that rBMSC proliferation and osteogenesis decreased under simulated microgravity. Conclusions: The above data suggest that simulated microgravity inhibits population growth of rBMSCs and their differentiation towards osteoblasts. These changes may be responsible for some of the physiological changes noted during spaceflight.
INTRODUCTION
During the past 40 years of human spaceflight, it has been confirmed that exposure to microgravity during the expeditions affects almost all human physiological systems; these changes are some of the main obstacles that have prevented human interplanetary missions (Sonnenfeld 1999; Turner 2000; West 2000; Crawford‐Young 2006). Based on the development of space medicine and bioastronautics, research has identified that the changes in activity and differentiation of tissue cells are the leading causes of physiological changes (Weinreb 1994; Michurina et al. 1996; Carmeliet et al. 1997; Woods et al. 2003). During spaceflight, some physiological adaptations occur, such as bone loss, anaemia, muscle atrophy and immune alterations; they are at least partly due to the decreased activity of functional cells and their reduced differentiation from progenitors (Davis et al. 1996; Ichiki et al. 1996; Plett et al. 2004). Given their intimate relationship with these systems, bone marrow mesenchymal stem cells (BMSCs) have become the subject of intense investigation.
Bone marrow mesenchymal stem cells are important progenitor and supporting cells that have the intrinsic ability to self‐renew and differentiate into multiple functional cells (Pittenger et al. 1999). They participate in normal replacement of damaged cells and in disease healing processes within different organ systems, including bone and the haematopoietic system. Mesenchymal progenitor BMSCs can produce adventitial cells in the marrow microenvironment; these cells provide support for haematopoiesis and for lymphocytic differentiation by producing membrane‐bound and also soluble signals, as well as cytokines (Koc et al. 2000). In postnatal animals, BMSCs serve as a major source for osteoblasts for bone remodelling and repair. When required, BMSCs can circulate to bone surfaces, and then proliferate and differentiate into functional cells (Osyczka & Leboy 2005). Meanwhile, experiments have also shown that BMSCs respond to microgravity, both in vivo and in vitro (Merzlikina et al. 2004; Zayzafoon et al. 2004; Meyers et al. 2005). The number of stromal fibroblastic progenitors (CFC‐f) in the bone marrow of spaceflight rats statistically significantly decreases, in common with those of other progenitor cells, such as the erythrocyte lineages (BFU‐e and CFU‐e) (Colvin et al. 2002; Domaratskaya et al. 2002). Zayzafoon et al. (2004) and colleagues found that simulated microgravity inhibited osteogenic differentiation of human mesenchymal stem cells and increased adipogenesis. These results are congruent with the finding that fat accumulates in bone marrow under mechanical unloading conditions. Understanding the precise effects of microgravity on BMSCs would help clarify the mechanism of bone loss and anaemia that occurs during spaceflight.
The effects and mechanisms of microgravity on BMSC proliferation and differentiation have been of great interest due to their potential use in tissue engineering and cell therapy (Nishikawa et al. 2005; Chen et al. 2006), and a few controversial results have been published recently (Domaratskaya et al. 2002; Merzlikina et al. 2004; Zayzafoon et al. 2004; Chen et al. 2006). In the present study, cell population growth, cell cycle, differentiation and gene expression profiles of rBMSCs, under simulated microgravity, were examined in detail to elucidate subsequent effects. Due to the difficulties in obtaining an adequate supply of BMSCs, we developed an effective method based on erythrocyte lysis for isolating and culturing rat BMSCs in vitro. Our data suggest that simulated microgravity inhibits the proliferation of rBMSCs and their differentiation towards osteoblasts and depresses their response to growth factors. Changes in the bone marrow stroma may damage local microenvironment and, hence, may be responsible for some of the physiological changes, such as bone loss and anaemia, that occur during spaceflight.
MATERIALS AND METHODS
Isolation and identification of rBMSCs
The tibia and the femur were isolated from 1‐month‐old male SD rats (Beijing experimental animal centre, Beijing, China) and all bone marrow was flushed out with a 10‐ml syringe using low‐glucose Dulbecco's modified Eagle's medium (LG‐DMEM; Sigma, St. Louis, MO, USA) supplemented with 10% foetal calf serum (PAA laboratories, GmbH, Pasching, Austria), 100 U/mL penicillin, 100 U/mL streptomycin and 25 mmol/L 4‐(2‐hydroxyethyl)‐1‐piperazineethanesulfonic acid (Sigma). To augment cell numbers, the whole marrow washouts were collected, sifted with a 400‐mesh filter and centrifuged. Then, they were treated with selected erythrocyte lysis buffers (as described below, group A) and were plated into a culture flask in 5% CO2 at 37 °C. Non‐adherent cells were removed by media super‐seeding every 3 or 4 days for a period of 2 weeks. When large colonies formed and became confluent, primary rBMSCs were trypsinized and passaged. Analysis of cell surface molecules was performed on passages 2 and 4 using immunochemistry for CD34, CD44 and CD106. The 2nd to 4th passage rBMSCs were used for subsequent experiments.
Erythrocyte lysis effects
Marrow washouts were mixed with an equal volume of erythrocyte lysis buffers [A: NH4CL 0.15 mol/L, KHCO3 10 mmol/L, ethylenediaminetetraacetic acid 0.01 mmol/L; B: acaetic acid 4%; C: 0.01 mmol/L phosphate‐buffered saline (PBS)] for 5–7 min. After centrifugation at 1100 g for 5 min, the supernatants were assayed by spectrophotometry at 415 nm, 450 nm and 700 nm. Haemoglobin (Hb) concentration of the supernatant was calculated using the formula: Hb (mg/L) = (154.7 × A415 – 130.7 × A450 – 123.9 × A700) × 10. Pre‐treated cells were washed three times with PBS, centrifuged at 300 g, and were then plated into culture flasks.
Cell proliferation assessment
Cultured cells were passaged into 24‐well plates at a concentration of 2 × 10⁴ cells/well. After 1–7 days of culture, they were fixed in 4% paraformaldehyde and were assayed, using a methylene blue assay, to determine their population growth curve, as shown below. Cell numbers on days 1 and 7 were counted, and the mean doubling time was obtained using the formula: TD = t × lg2/(lgNt–lgN0), where N0 is the cell number on day 1, Nt is the cell harvest number and t is the duration of culture (hours). A variety of concentrations of growth factors [epidermal growth factor (EGF), insulin‐like growth factor‐I (IGF‐I) and basic fibroblastic growth factor (bFGF)] was added to the rBMSCs, followed by culture for 1–4 days; then, cells were fixed in 4% paraformaldehyde for proliferation determination using the methylene blue assay.
Methylene blue method
Relative population cell density was also measured using the methylene blue method (Currie 1981). Fixed cells were rinsed twice with PBS, stained with 1% methylene blue in borate buffer (10 mm/L, pH 8.8) for 10 min and then washed several times with borate buffer. Bound methylene blue was eluted with 0.1 mm/L HCl, and measurements with performed using a microplate reader (µQuant, Bio‐Tech, Winooski, VT, USA) at 650 nm. Relative cell numbers are expressed as the absorption values, AMB.
Differentiation potential
The rBMSCs were plated on glass coverslips in 6‐well plates, to which osteogenic medium (10 mmol/L β‐glycerophosphate, 10 nmol/L dexamethasone and 50 mg/L ascorbic acid‐2‐phosphate) and adipogenesis medium (1 µmol/L dexamethasone, 10 g/L insulin, 0.5 mmol/L isobutylmethylxanthine and 0.2 mmol/L indomethacin) in LG‐DMEM supplemented with 10% FBS were added in each case. After a further 7 or 18 days of culture, cells were stained using standard von Kossa stain and oil red O to detect the presence of calcium deposition in osteoblasts or neutral lipid vacuoles in adipocytes, respectively. For von Kossa staining, cells were fixed with 4% paraformaldehyde for 30 min and were rinsed with deionized water. After the addition of 1% silver nitrate solution, wells were exposed to ultraviolet light for 45 min. Plates were rinsed with deionized water, and residual silver nitrate was neutralized using 3% sodium thiosulphate. Fixed cells were washed with PBS and stained with oil red O (Sigma) for 10 min, and then were counterstained with haematoxylin (Sigma) for 3 min.
Cell cultures under simulated microgravity
Fresh cells were plated on glass coverslips in 6‐well plates or in 25 cm2 culture flasks. After adherence, the coverslips were transferred to a biocompatible polyethylene culture bag; this was stabilized by using two bars at the edges. All samples were filled with medium, with or without growth factors at known concentrations (EGF 20 ng/mL, bFGF 2 ng/mL and IGF‐I 20 ng/mL; Sigma); the bags were then sealed ensuring that no air bubbles were present. All flasks had either normal medium or osteogenic induction medium. Half the samples were randomly selected to be cultured in a clinostat (developed by the Institute of Biophysics Chinese Academy of Sciences), which would simulate microgravity for 24–96 h, at a rotation speed of 30 r.p.m. The cells rotated around a horizontal axis resulting in randomization of the gravitational vector, low fluid shear stress and three‐dimensional spatial freedom (all of which simulate microgravitational effects) (Dai et al. 2006). The other half of the samples (static controls) were placed in a similar incubator without simulated microgravity. At the end time of experiments, the samples on coverslips were fixed with 4% paraformaldehyde for proliferation testing using methylene blue or for microfilament staining. Samples in the flasks were treated with TRIzol (Invitrogen, Carlsbad, CA, USA) to extract RNA; with trypsin for cell cycle analysis; with lysis buffer (50 mm Tris, pH 8.0, 150 mm NaCl, 0.02% NaN3, 0.1% sodium dodecyl sulfate, 1% NP‐40, 0.5% sodium deoxycholate), 2 mm phenylmethylsulphonyl fluoride, protease and phosphatase inhibitor cocktails (Sigma) to extract total proteins.
Cell cycle analysis using FACScan
Both groups of rBMSCs that had been cultured for 1–4 days were digested with 0.25% trypsin after washing with PBS, then were fixed in ice‐cold 75% ethanol and were stored at 4 °C prior to analysis. The ethanol was removed by washing twice with PBS. For cell cycle analysis, 50 µg/mL propidium iodide, 10 µg/mL RNaseA (Sigma), and 0.01% ethylenediaminetetraacetic acid were added to the fixed cells for 30 min, and their DNA content was analysed by FACScan flow cytometer (Becton Dickinson, Mountain View, CA, USA).
Fluorescence staining of microfilaments
The fixed cells were washed with PBS and were pre‐incubated in blocking buffer (1% bovine serum albumin) for 30 min, then incubated in 50 µL Texas red isothiocyanate‐conjugated phalloidin (Molecular Probes, Invitrogen), in blocking buffer at room temperature for 2 h. Subsequently, they were briefly washed three times in PBS and then were mounted using Mowiol, a mounting medium (Merck KGaA, Darmstadt, Germany). Now immunofluorescently stained, the cells were viewed using a Leica fluorescence microscope system using an N2.1 green excitation filter system (Leica Microsystems GmbH Wetzlar, Germany).
Microarray assay and data analysis
RNA preparation and the microarray assay were performed by CapitalBio Corporation (Beijing, China) according to the manufacturer's instruction manual. In brief, total RNA was isolated from the rBMSCs exposed to simulated microgravity and from static controls, after 3 days, using the RNeasy kit (Qiagen, Valencia, CA, USA) as per instruction manual. Double‐stranded cDNA was synthesized from total RNA using the cDNA synthesis kit (TaKaRa, Dalian, China) and then was reverse transcribed into cRNA using the T7 RiboMAX Express Large Scale RNA Production System (Promega, Madison, WI, USA). The purified cRNA was reversely transcribed with Superscript II reverse transcriptase (Invitrogen), and the transcript production was labelled with cy3‐dCTP for the control group and cy5‐dCTP for the simulated microgravity group. Labelled targets were resuspended in hybridization buffer and were applied to a glass microarray. The biochip slide (rat genomic oligonucleotide array, CapitalBio Corporation) contained in the region of 5705 rat genes, which included three duplication probes (69 m per probe) and interior control genes. Hybridizations were performed overnight at 50–55 °C. Following a stringent wash, dried slides were imaged with ScanArray Express (Packard Bioscience, Billerica, MA, USA), and the signal intensities of individual spots were obtained with GenePix Pro 4.0 image analysis software (Axon Instruments, Foster City, CA, USA). Expression levels of every gene were normalized using the Lowess method, and Student's t‐test was used to test for significant differences of expressions. The genes for which simulated microgravity group to static control ratio only, differed by a factor of at least 1.5 and was statistically significant at P < 0.05 which were also included in the gene ontology (GO) annotation analysis using Database for Annotation, Visualization and Integrated Discovery tools (http://niaid.abcc.ncifcrf.gov). During the analysis process, we focused on the terms related to cell proliferation and differentiation; results from the Database for Annotation, Visualization and Integrated Discovery analysis were further clustered manually and are shown in Table 1.
Table 1.
Gene ontology annotation analysis of the changed gene into cluster
| Terms | All changed | Changed gene number | |
|---|---|---|---|
| Up‐regulated | Down‐regulated | ||
| Cell cycle | 40(7.9E‐7)* | 22(1.0E‐4) | 18(4.2E‐3) |
| Regulation of cell cycle | 25(1.9E‐4) | 15(9.9E‐4) | 10(8.5E‐2) |
| Negative regulation of progression through cell cycle | 8(1.8E‐2) | 5(4.5E‐2) | 3(3.8E‐1) |
| Cell cycle arrest | 5(5.3E‐2) | 4(3.4E‐2) | 1 |
| Cell proliferation | 40(9.1E‐6) | 24(5.5E‐5) | 16(4.3E‐2) |
| Regulation of cell proliferation | 27(1.4E‐4) | 18(9.0E‐5) | 9(7.1E‐1) |
| Negative regulation of cell proliferation | 15(8.0E‐4) | 11(3.1E‐4) | 4(7.9E‐1) |
| Cell differentiation | 46(1.6E‐4) | 23(9.6E‐3) | 23(8.5E‐3) |
| Regulation of cell differentiation | 14(1.7E‐3) | 6(1.1E‐1) | 8(1.3E‐2) |
| WNT receptor signalling pathway | 6(6.1E‐2) | 6(4.0E‐3) | |
| Osteoblast differentiation | 3(1.6E‐1) | 3(4.8E‐2) | |
| Response to stress | 62(2.2E‐7) | 27(6.8E‐3) | 35(8.7E‐6) |
| Apoptosis | 39(2.2E‐6) | 18(4.8E‐3) | 21(2.6E‐4) |
| Regulation of apoptosis | 36(3.8E‐8) | 17(5.8E‐4) | 19(5.2E‐5) |
| Positive regulation of apoptosis | 16(1.8E‐3) | 8(4.1E‐2) | 8(3.9E‐2) |
| Negative regulation of apoptosis | 16(1.9E‐4) | 7(4.4E‐2) | 9(4.0E‐3) |
| Anti‐apoptosis | 15(4.5E‐5) | 6(5.1E‐2) | 9(8.3E‐4) |
| Induction of apoptosis | 13(6.8E‐3) | 6(1.3E‐1) | 7(4.8E‐2) |
| Cytoskeleton | 27(6.4E‐2) | 8(8.6E‐1) | 19(4.6E‐3) |
| Actin cytoskeleton | 14(5.2E‐3) | 4 | 10(1.9E‐3) |
| Protein localization | 28(4.0E‐3) | 7(8.0E‐1) | 21(9.2E‐5) |
| Intracellular transport | 34(2.3E‐4) | 11(3.6E‐1) | 23(3.8E‐5) |
| Protein transport | 27(1.4E‐3) | 7(6.9E‐1) | 20(5.2E‐5) |
The number in the brace was Fisher's exact P‐value that presents the genes specifically associated (enriched) in the term than random chance if P ≤ 0.05.
Western blotting
Total rBMSC proteins were extracted using standard methods and were quantified using the bicinchoninic acid protein assay kit (Pierce Technology, Rockford, IL, USA). Whole cell protein extracts (20 µg/lane) were separated by sodium dodecyl sulfate polyacrylamide gel electrophoresis and were transferred to poly‐vinylidene fluoride membranes (Millipore, Billerica, MA, USA) using a semidry electroblotter (CLP, San Diego, CA, USA). Protein transfer efficiency and size determination were verified using prestained protein markers (Sigma). Membranes were blocked with 5% milk for 30 min at room temperature followed by overnight incubation at 4 °C with primary antibodies directed against core‐binding factor α1 (Cbfa1), phosphorylated Akt and phosphorylated extracellular signal‐related kinase (ERK) (Santa Cruz, CA, USA). Primary antibody binding was detected using a horseradish peroxidase‐conjugated secondary antibody and an enhanced chemiluminescence detection system (Amersham Bioscience, Piscataway, NJ, USA).
RESULTS
Acquisition and identification of rBMSCs
Effects of erythrocyte lysis buffer
In the present study, an easy‐to‐use method for isolating and culturing rBMSCs in vitro was developed based on erythrocyte lysis. Marrow flushed out from tibias and femurs was pre‐treated with a variety of erythrocyte lysis buffers before seeding. The effects of erythrocyte lysis had a positive relationship with the supernatant Hb concentration. As shown in Fig. 1, Hb concentration of group B was the highest and that of group C was the lowest by spectrophotometer assay. Group B, which was treated with 4% acaetic acid, was used as a positive control of erythrocyte lysis. Compared to group B, almost 85% of the red blood cells were removed in group A, but only 25% of them were removed in group C.
Figure 1.
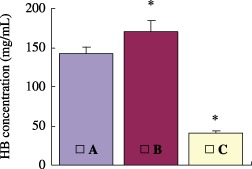
Effects of different erythrocyte lysis buffers. Bone marrow erythrocytes were treated with erythrocyte lysis buffers. Group A: 0.15 mol/L NH4CL, 10 mmol/L KHCO3, 0.01 mmol/L EDTA; group B: 4% acaetic acid; and group C: 0.01 mmol/L PBS. After centrifugation, haemoglobin (Hb) concentration in the supernatant was determined by spectrophotometry. Values were obtained from three experiments and represent the mean ± SE. *P < 0.05, groups B and C versus group A.
Isolation and culture of rBMSCs
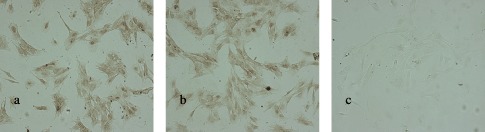
Pre‐treated marrow cells were plated into flasks and were cultured for approximately 2 weeks. Non‐adherent cells were removed by fresh medium exchange every 3 days. Some adherent, slightly expanded cells were found 24 h after seeding; at 72 h, typical spindle‐shaped cells appeared and began to grow and to divide. Colonies appeared at days 6–9 and became confluent after around 2–3 weeks (Fig. 2d). Disposal of erythrocyte lysis by‐products removed most of them more adherent cells were harvested (group A, Fig. 2a) than the PBS control (group C, Fig. 2c); there were few adherent cells in group B at the time of the second medium exchange (Fig. 2b). All results so far suggest that removal of red blood cells reduced the degree of interference present for mononuclear cell proliferation, and increased likelihood for formation of clones.
Figure 2.

Primary culture of rBMSCs from marrow treated with different lysis buffers. (a) Treated with NH4CL, resulting in more cells being adherent; (b) treated with 4% acaetic acid, and almost no cells were adherent; and (c) treated with PBS. The images of a, b and c were taken on the 6th day after seeding. d was part of the rBMSC clone from group A after 2 weeks of culture (×4).
Surface marker of rBMSC identification
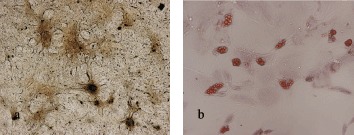
Rat BMSCs isolated at passages 2 and 4 were identified, based on surface marker expression, by using immunochemistry. By 3,3′‐diaminobenzidine staining, a brown final reaction deposit identified detected molecules. Positive results for CD44 (Fig. 3a) and CD106 (Fig. 3b) and the negative results for CD34 (Fig. 3c) suggested that these cells had mesenchymal stem cell characteristics and none of the characteristics of haematopoietic cells.
Figure 3.
Characteristics of rBMSCs. Passage 4 rBMSCs were stained for surface markers, CD44 (a), CD106 (b) and CD34 (c), using 3,3′‐diaminobenzidine as the final reaction product. The brown deposit (a and b) suggests positive results, but no deposit is seen in c. These results imply that the isolated rBMSCs expressed CD44 and CD106 but not CD34.
Growth of rBMSCs at normal gravity
Cell population growth pattern and proportion of rBMSCs in cycle were determined. From the growth curve (Fig. 4a), a lag phase occurred around 24–48 h of culture, which was followed by a logarithmic growth stage and then a growth‐arrested phase. Average doubling time of the cells was 34 h. Cell cycle analysis showed that the percentage of cells in the G0/G1 phase was 80–90% (4, 6), which indicates that most of the rBMSCs were quiescent, and only a small fraction of them was actively proliferating.
Figure 4.
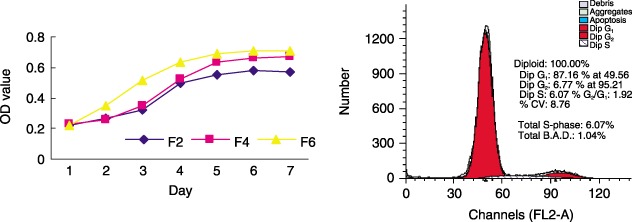
Growth curves of 2nd, 4th and 6th passage rBMSCs and the percentage of 3rd passage cells in each phase of the cell cycle. rBMSCs were plated on coverslips for the methylene blue proliferation assay from day 1 to day 7 (a), or cells were placed into flasks for cell cycle analysis based on propidium iodide staining and FACScan flow cytometer on the 3rd day (b). Growth curves and the percentages of cells in each phase of the cell cycle represent the results of two separate experiments.
Figure 6.
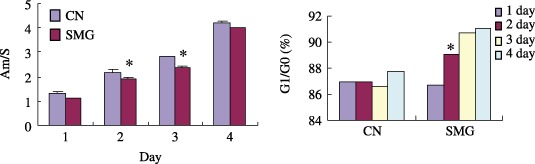
rBMSCs proliferation under simulated microgravity. rBMSCs were plated on glass coverslips or placed in flasks, and were cultured in normal medium under simulated microgravity for 1–4 days. Cell proliferation was detected by methylene blue staining (a), Am presents the optical density value and S is the area of the measured coverslips. Cell cycle participation was assessed by flow cytometry (b) and represented the same tendency in three separated experiments. *P < 0.05, SMG versus CN, n = 3. CN, normal gravity; SMG, simulated microgravity.
Differentiation potential of rBMSCs
Differentiation potential of rBMSCs was evaluated by von Kossa and oil red O staining after osteogenic and adipogenic induction, respectively. After osteogenic induction for 12 days, calcium deposition appeared (data not shown) and became notable at day 18, as shown in Fig. 5a. Oil red O stains neutral lipid in vacuoles (Fig. 5b) and this was seen after 7 days of adipogenic induction.
Figure 5.
rBMSC differentiation into osteogenic (a) and adipogenic cells (b). rBMSC differentiation into osteogenic cells was confirmed by von Kossa staining after 18 days of culture in osteogenic media; differentiation into adipogenic cells was confirmed by oil red O staining after 7 days of culture, in adipogenic medium. Cells in normal media served as controls. The images represent the results of three experiments.
Effects of simulated microgravity on rBMSCs
Proliferation inhibition
To simulate microgravity, rBMSCs were cultured in the clinostat for 1–4 days; as shown in Fig. 6a, simulated microgravity inhibited their proliferation. Cell cycle analysis showed that an increasing number of rBMSCs proceeded into the G0/G1 phase (Fig. 6b) in the three separated experiments. Apoptosis analysis indicated that no significant changes occurred during simulated microgravity (data not shown). The activities of two important signal molecules that are related to cell proliferation were examined by Western blotting. After three days of clinorotation, Akt and Erk1/2 phosphorylation levels were markedly decreased, as shown in 7, 8; this implies that activity of cell proliferation signalling through Akt and mitogen‐activated protein kinase had decreased, which supported our previous findings.
Figure 7.
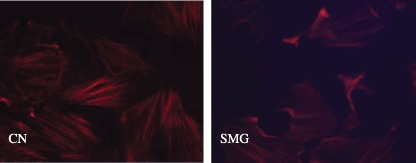
Disruption of actin stress fibre formation under simulated microgravity. rBMSCs were plated on coverslips and were cultured in normal medium for 3 days under normal gravity (CN) or simulated microgravity (SMG). At the end of the study, cells were labelled with Texas red isothiocyanate‐conjugated phalloidin, to visualize filamentous actin. Images were acquired using a fluorescence microscope (Leica Microsystems GmbH Wetzlar, Germany) using a ×40 objective. Images represent the results of three separate experiments.
Figure 8.
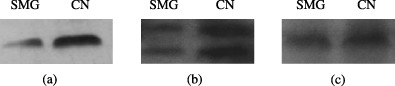
Reduction of Akt and ERK1/2 phosphorylation levels and Cbfa1 expression under simulated microgravity. rBMSCs were cultured for 3 days in the clinostat either using normal medium (for phosphorylation detection) or using osteogenic induction medium (for Cbfa1 detection). Total protein was extracted, quantified and separated by 10% sodium dodecyl sulfate‐polyacrylamide gel electrophoresis. Immunoblots were probed using specific antibodies to phosphorylated Akt (a), phosphorylated Erk1/2 (b) and Cbfa1 (c). Images represent the results of three separate experiments. CN, normal gravity (1 g); SMG, simulated microgravity.
Decreased response to growth factors
Under normal gravity, IGF‐I (Fig. 9a) and EGF (data not shown), used at concentrations ranging from 0 to 20 ng/mL, and a low concentration of bFGF (data not shown), dramatically stimulated rBMSC population growth. Optimal concentrations and culture times that facilitated rapid expansion were determined for subsequent experiments examining the impact of simulated microgravity on growth factor stimulation. Figure 9b shows that there was only a slight increase in rBMSC population growth in response to growth factors under simulated microgravity, while there was a high increase with growth factor stimulation under normal gravity. All of the collected data support the conclusion that stimulation of cell population expansion by these three growth factors was significantly inhibited under simulated microgravity.
Figure 9.
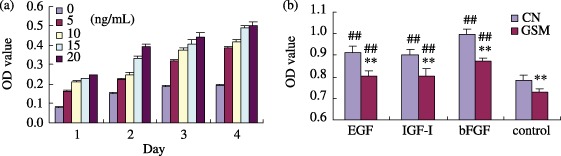
Simulated microgravity affected the stimulation of rBMSCs by growth factors. Cell proliferation effects were detected by methylene blue staining. IGF‐I at concentrations ranging from 0 to 20 ng/mL significantly stimulated rBMSCs growth from day 1 to day 4 (a). rBMSCs were cultured for 3 days under simulated microgravity (SMG) with or without growth factors (EGF 20 ng/mL, bFGF 2 ng/mL, IGF‐I 20 ng/mL) and then were assessed once more using methylene blue staining (bFGF and control, n = 3; EGF and IGF‐I, n = 5). Compared to normal gravity (CN), all treated cells presented a significant difference in picture A. SMG markedly inhibited the effect of the growth factors (b) ##P < 0.01 growth factor treated versus control; **P < 0.01 CN (1 g control) versus SMG.
Disorganization of microfilament system
Cell cytoskeleton system is sensitive to gravity changes. To study this, first, microfilaments were labelled with Texas red isothiocyanate‐conjugated phalloidin. Compared to the well‐organized, thick actin filaments in static controls, after clinorotation for 3 days, rBMSC actin filaments became depolymerized and extenuated, and showed dispersed distribution as shown in Fig. 7. These results are consistent with findings obtained with osteoblast‐like cells ROS17/2.8 under real and simulated microgravity (Dai et al. 2006) and are in agreement with microarray and GO analysis results that have shown that many of the genes associated with the actin cytoskeleton were down‐regulated (as described below).
Decreased osteogenesis
Bone marrow mesenchymal stem cells can differentiate into many cell lineages, for example, osteoblasts and adipocytes. Cbfa1 is an essential transcription factor and commitment factor in osteoblast differentiation (Ducy et al. 1997). Expression of Cbfa1, as determined by Western blotting, was decreased after BMSC culture in osteogenic medium under simulated microgravity for 3 days as shown in Fig. 8c. This result is consistent with a previous report (Zayzafoon et al. 2004).
Gene expression profile of rBMSCs under simulated microgravity
To assess changes in gene expression profile under simulated microgravity, microarray analyses were performed using total RNA from rBMSCs exposed to simulated microgravity for 3 days and rat genomic oligonucleotide array. Four hundred and thirteen differentially expressed genes were identified in rBMSCs under simulated microgravity based on statistical testing (P < 0.05) and a 1.5‐fold difference as the cut‐off; 207 genes were down‐regulated, including 27 expressed sequence tags, and 206 genes were up‐regulated, including 15 expressed sequence tags. Functional characterization of these genes showed that differential expression occurred in every term category; this indicates that profound changes occur under simulated microgravity. We were particularly interested in changes in the terms related to the cell cycle, proliferation and differentiation. As shown in Table 1, more than 40 genes (about 10% of all changed gene expression) were clustered with respect to those terms related to changes in cell cycle, cell proliferation and cell differentiation, respectively. Most of the changed expressions that negatively regulate the cell cycle and proliferation were up‐regulated, including ABI1 (NM_024397), PTTG1(NM_022391), PMP22(NM_017037), BTG1 (NM_017258), ETS1 (NM_012555), while several genes that positively regulate cell function were down‐regulated, including cell cycle influencing genes and signal transduction proteins CCND1 (X75207), CDK5 (L02121), CDC5L (AF000578), and Ras‐related protein RASA1 (NM_013135), RAF1 (NM_012639), RAB7 (NM_023950), RAB 9 (AF325692), RAB 10 (NM_017359), RAB 13(M83678). In particular, only one in five changed gene expressions was down‐regulated in the term related to cell cycle arrest (P ≤ 0.05), while the others were up‐regulated. More interestingly, all of the altered gene functions in the term related to osteoblast differentiation were down‐regulated, including CATNB (AF121265), FZD1 (NM_021266), GPNMB (AF184983), WNT5A (NM_022631), WISP1 (NM_031716). The response to stress and apoptosis terms also yielded interesting results; 62 and 46 changed genes were enriched in these two terms, respectively, equally distributed between down‐regulated and up‐regulated (P ≤ 0.05); this indicates that while these states were altered, they were still in balance. Under simulated microgravity, cytoskeleton gene expression was significantly decreased, especially in the actin cytoskeleton term (P ≤ 0.01), including actin α1 (NM_031978), ARP3 (AF307852) and Cofilin1 (NM_017147), which further confirmed our observation of actin‐cytoskeleton depolymerization in rBMSCs. Cytoskeleton changes in return, affect protein location and intracellular transport; thus, genes controlling protein location and intracellular transport terms were significantly down‐regulated (P ≤ 0.01).
DISCUSSION
There is increasing evidence that inhibition of cell differentiation contributes to some of the physiological changes that occur during spaceflight, such as bone loss, anaemia and immune alterations. BMSCs are important progenitor cells that support differentiation of haematopoietic cells, lymphocytes, osteoblasts and other cell types. Thus, biological response of BMSCs to microgravity must be understood before the mechanism of physiological changes that occur during spaceflight can be identified.
In the present study, we developed an effective method for isolating and culturing rBMSCs. Because there is only one mesenchymal stem cell for every 100 000 marrow cells, optimal isolation methods based on BMSCs adhesion to plastic characteristics, including density gradient centrifugation, have been developed (Zohar et al. 1997; Hung et al. 2002). Here, BMSCs were isolated from bone marrow by pre‐treatment with erythrocyte lysis buffer, which reduces interference with BMSCs adherence. Then, the BMSCs were identified on the basis of their surface markers and proliferation characteristics. Compared to positive and negative controls, most of the erythrocytes were removed and more clones were formed. Isolated cells were positive for CD44 and CD106, negative for CD34, and had the proliferation characteristics of BMSCs (Guo et al. 2001). Removal of most red blood cells reduced interference with BMSCs adherence. Furthermore, the residue appeared to provide a cytokine or other factor that could stimulate BMSCs adherence (Friedensein et al. 1992). All of these data suggest that the method presented in this paper was effective for isolating BMSCs from bone marrow.
We have also investigated the effects of simulated microgravity on rBMSCs using the methylene blue assay, flow cytometry, microarray and further methods. BMSCs were found to be sensitive to changes in the gravity vector and responded to microgravity by changing their activity levels. Their function depends on the cellular microenvironment and several soluble factors. Gravity is important for BMSCs activity for several reasons (Merzlikina et al. 2004). First, simulated microgravity generated by the clinostat decreased rBMSC proliferation as demonstrated by the methylene blue assay; similar results have been previously reported (Merzlikina et al. 2004; Chen et al. 2006). Kostenuik demonstrated that BMSCs in a 5‐day hindlimb investigation unload, had significantly decreased proliferation potential when cultured in vitro (Kostenuik et al. 1997). Second, under normal gravity, almost 85% of rBMSCs stayed in the G0/G1 phase of cell cycle, while more than 90% of them stayed in the G0/G1 phase under simulated microgravity, with the percentage being positively related to the length of exposure to simulated microgravity. These results indicate that simulated microgravity hindered rBMSC division and thus, decreased their proliferation. It has been reported that microgravity changes the distribution of the cell cycle phase in mammalian stem cells, such as haematopoietic stem cells (Colvin et al. 2002; Plett et al. 2004). Third, progression through the cell cycle depends on cytoskeletal architecture, which is sensitive to microgravity. Changes in cytoskeletal F‐actin, which collapsed in simulated microgravity, can block cell numbers in the G0/G1 phase (Hughes‐Fulford 2003). Fourth, phosphorylation of two important proliferation regulating factors, Akt and Erk1/2, was decreased under simulated microgravity. Fifth, microarray and GO analysis indicated that expression of growth regulation genes was changed and decreased BMSC expansion under simulated microgravity. These data indicate that following exposure to simulated microgravity, there is down‐regulation of BMSCs replication. Sixth, growth factors, important for BMSC differentiation and proliferation, including IGF‐I, EGF and bFGF (Pitaru et al. 1993; Koch et al. 2005), markedly stimulated BMSC proliferation under normal gravity. However, under simulated microgravity, while there was a detectable increase in BMSC proliferation in response to the growth factors, it was significantly less for all three growth factors; this suggests that simulated microgravity decreases the response of rBMSCs to growth factors. Taken together, all of these results suggest that simulated microgravity inhibits the proliferation of rBMSCs, which is similar to its effects on other proliferative cells (Basso et al. 2005).
As also reported by Zayzafoon, we found that simulated microgravity inhibited BMSCs osteogenesis. The GO analysis indicated that all the changed genes in the term related to osteoblast differentiation were down‐regulated. Furthermore, after three days of clinorotation, there was a significant decrease in the expression of Cbfa1 in BMSCs cultured in osteogenic medium. As described above, BMSCs also had a decreased responsiveness to osteoblast‐related growth factors, including IGF‐I and bFGF, which are synthesized by osteoblasts and released by the bone resorption. These growth factors have been shown to directly or indirectly affect the recruitment, proliferation, differentiation and survival of osteoblasts (Baker et al. 1993). Skeletal unloading has been shown to decrease proliferation of putative osteoblast precursor cells, present along the endosteal bone surface and in the marrow stroma (Machwate et al. 1993; Weinreb 1994; Zhang et al. 1995) and causes osteoprogenitor cells to be resistant to parathyroid hormone and IGF‐I (Kostenuik et al. 1999). Thus, it is likely that inhibition of proliferation and decrease in cell responsiveness to local growth factors may contribute to bone formation abnormalities (Marie 1997).
In general, microgravity inhibits BMSC proliferation and their differentiation towards osteoblasts; this may be responsible for some of the physiological changes, such as bone loss and anaemia, that occur during spaceflight.
REFERENCES
- Baker J, Liu JP, Robertson EJ, Efstratiadis A (1993) Role of insulin‐like growth factors in embryonic and postnatal growth. Cell 75, 73–82. [PubMed] [Google Scholar]
- Basso N, Bellows CG, Heersche JN (2005) Effect of simulated weightlessness on osteoprogenitor cell number and proliferation in young and adult rats. Bone 36, 173–183. [DOI] [PubMed] [Google Scholar]
- Carmeliet G, Nys G, Bouillon R (1997) Microgravity reduces the differentiation of human osteoblastic MG‐63 cells. J. Bone Miner. Res. 12, 786–794. [DOI] [PubMed] [Google Scholar]
- Chen X, Xu H, Wan C, McCaigue M, Li G (2006) Bioreactor expansion of human adult bone marrow‐mesenchymal stem cells. Stem Cells 24, 2052–2059. [DOI] [PubMed] [Google Scholar]
- Colvin GA, Lambert JF, Carlson JE, McAuliffe CI, Abedi M, Quesenberry PJ (2002) Rhythmicity of engraftment and altered cell cycle kinetics of cytokine‐cultured murine marrow in simulated microgravity compared with static cultures. In Vitro Cell. Dev. Biol. Anim. 38, 343–351. [DOI] [PubMed] [Google Scholar]
- Crawford‐Young SJ (2006) Effects of microgravity on cell cytoskeleton and embryogenesis. Int. J. Dev. Biol. 50, 183–191. [DOI] [PubMed] [Google Scholar]
- Currie GA (1981) Platelet‐derived growth factor requirements for in vitro proliferation of normal and malignant cells. Br. J. Cancer 43, 335–343. [DOI] [PMC free article] [PubMed] [Google Scholar]
- Dai Z‐Q, Li Y‐H, Ding B , Zhang X‐Y, Tan Y‐J, Wan Y‐M (2006) Actin microfilaments participate in the regulation of the COL1A1 promoter activity in ROS17/2.8 cells under simulated microgravity. Adv. Space Res. 38, 1159–1167. [Google Scholar]
- Davis TA, Wiesmann W, Kidwell W, Cannon T, Kerns L, Serke C, Delaplaine T, Pranger A, Lee KP (1996) Effect of spaceflight on human stem cell hematopoiesis: suppression of erythropoiesis and myelopoiesis. J. Leukoc. Biol. 60, 69–76. [DOI] [PubMed] [Google Scholar]
- Domaratskaya EI, Michurina TV, Bueverova EI, Bragina EV, Nikonova TA, Starostin VI, Khrushchov NG (2002) Studies on clonogenic hemopoietic cells of vertebrate in space: problems and perspectives. Adv. Space Res. 30, 771–776. [DOI] [PubMed] [Google Scholar]
- Ducy P, Zhang R, Geoffroy V, Ridall AL, Karsenty G (1997) Osf2/Cbfa1: a transcriptional activator of osteoblast differentiation. Cell 89, 747–754. [DOI] [PubMed] [Google Scholar]
- Friedensein AJ, Latzinik NV, Gorskaya YF, Luria EA, Moskvina IL (1992) bone marrow stromal colony formation requires stimulation by haemopoietic cells. Bone Miner. 18, 199–213. [DOI] [PubMed] [Google Scholar]
- Guo Z, Yang J, Liu X, Li X, Hou C, Tang PH, Mao N (2001) Biological features of mesenchymal stem cells from human bone marrow. Chin. Med. J. (Engl) 114, 950–953. [PubMed] [Google Scholar]
- Hughes‐Fulford M (2003) Function of the cytoskeleton in gravisensing during spaceflight. Adv. Space Res. 32, 1585–1593. [DOI] [PubMed] [Google Scholar]
- Hung SC, Chen NJ, Hsieh SL, Li H, Ma HL, Lo WH (2002) Isolation and characterization of size‐sieved stem cells from human bone marrow. Stem Cells 20, 249–258. [DOI] [PubMed] [Google Scholar]
- Ichiki AT, Gibson LA, Jago TL, Strickland KM, Johnson DL, Lange RD, Allebban Z (1996) Effects of spaceflight on rat peripheral blood leukocytes and bone marrow progenitor cells. J. Leukoc. Biol. 60, 37–43. [DOI] [PubMed] [Google Scholar]
- Koc ON, Gerson SL, Cooper BW, Dyhouse SM, Haynesworth SE, Caplan AI, Lazarus HM (2000) Rapid hematopoietic recovery after coinfusion of autologous‐blood stem cells and culture‐expanded marrow mesenchymal stem cells in advanced breast cancer patients receiving high‐dose chemotherapy. J. Clin. Oncol. 18, 307–316. [DOI] [PubMed] [Google Scholar]
- Koch H, Jadlowiec JA, Campbell PG (2005) Insulin‐like growth factor‐I induces early osteoblast gene expression in human mesenchymal stem cells. Stem Cells 14, 621–631. [DOI] [PubMed] [Google Scholar]
- Kostenuik PJ, Halloran BP, Morey‐Holton ER, Bikle DD (1997) Skeletal unloading inhibits the in vitro proliferation and differentiation of rat osteoprogenitor cells. Am. J. Physiol. 273, E1133–E1139. [DOI] [PubMed] [Google Scholar]
- Kostenuik PJ, Harris J, Halloran BP, Turner RT, Morey‐Holton ER, Bikle DD (1999) Skeletal unloading causes resistance of osteoprogenitor cells to parathyroid hormone and to insulin‐like growth factor‐I. J. Bone Miner. Res. 14, 21–31. [DOI] [PubMed] [Google Scholar]
- Machwate M, Zérath E, Holy X, Hott M, Godet D, Lomri A, Marie PJ (1993) Skeletal unloading in rat decreases proliferation of rat bone and marrow‐derived osteoblastic cells. Am. J. Physiol. Endocrinol. Metab. 264, E790–E799. [DOI] [PubMed] [Google Scholar]
- Marie P (1997) Growth factors and bone formation in osteoporosis: roles for IGF‐I and TGF‐beta. Rev. Rhum. Engl. Ed. 64, 44–53. [PubMed] [Google Scholar]
- Merzlikina NV, Buravkova LB, Romanov YA (2004) The primary effects of clinorotation on cultured human mesenchymal stem cells. J. Gravit. Physiol. 11, P193–P194. [PubMed] [Google Scholar]
- Meyers VE, Zayzafoon M, Douglas JT, Mcdonald JM (2005) RhoA and cytoskeletal disruption mediate reduced osteoblastogenesis and enhanced adipogenesis of human mesenchymal stem cells in modeled microgravity. J. Bone Miner. Res. 20, 1858–1866. [DOI] [PMC free article] [PubMed] [Google Scholar]
- Michurina TV, Domaratskaya EI, Nikonova TM, Khrushchov NG (1996) Blood and clonogenic hemopoietic cells of newts after the space flight. Adv. Space Res. 17, 295–298. [DOI] [PubMed] [Google Scholar]
- Nishikawa M, Ohgushi H, Tamai N, Osuga K, Uemura M, Yoshikawa H, Myoui A (2005) The effect of simulated microgravity by three‐dimensional clinostat on bone tissue engineering. Cell Transplant 14, 829–835. [DOI] [PubMed] [Google Scholar]
- Osyczka AM, Leboy PS (2005) BMP regulation of early osteoblast genes in human marrow stromal cells is mediated by ERK and PI3‐K signaling. Endocrinology 146, 3428–3437. [DOI] [PMC free article] [PubMed] [Google Scholar]
- Pitaru S, Kotev‐Emeth S, Noff D, Kaffuler S, Savion N (1993) Effect of basic fibroblast growth factor on the growth and differentiation of adult stromal bone marrow cells: enhanced development of mineralized bone‐like tissue in culture. J. Bone Miner. Res. 8, 919–929. [DOI] [PubMed] [Google Scholar]
- Pittenger MF, Mackay AM, Beck SC, Jaiswal RK, Douglas R, Mosca JD, Moorman MA, Simonetti DW, Craig S, Marshak DR (1999) Multilineage potential of adult human mesenchymal stem cells. Science 284, 143–147. [DOI] [PubMed] [Google Scholar]
- Plett PA, Abonour R, Frankovitz SM, Orschell CM (2004) Impact of modeled microgravity on migration, differentiation, and cell cycle control of primitive human hematopoietic progenitor cells. Exp. Hematol. 32, 773–781. [DOI] [PubMed] [Google Scholar]
- Sonnenfeld G (1999) Space flight, microgravity, stress and immune responses. Adv. Space Res. 23, 1945–1953. [DOI] [PubMed] [Google Scholar]
- Turner RT (2000) Physiology of a microgravity environment invited review: what do we know about the effects of spaceflight on bone? J. Appl. Physiol. 89, 840–847. [DOI] [PubMed] [Google Scholar]
- Weinreb M (1994) Bone marrow from mechanically unloaded rat bones expresses reduced osteogenic capacity in vitro . J. Bone Miner. Res. 9, 321–327. [DOI] [PubMed] [Google Scholar]
- West JB (2000) Physiology of a microgravity environment historical perspectives: physiology in microgravity. J. Appl. Physiol. 89, 179–384. [Google Scholar]
- Woods CC, Banks KE, Gruener R, Deluca D (2003) Loss of T cell precursors after spaceflight and exposure to vector‐averaged gravity. FASEB J. 17, 1526–1528. [DOI] [PubMed] [Google Scholar]
- Zayzafoon M, Gathings WE, McDonald JM (2004) Modeled microgravity inhibits osteogenic differentiation of human mesenchymal stem cells and increases adipogenesis. Endocrinology 145, 2421–2432. [DOI] [PubMed] [Google Scholar]
- Zhang R, Supowit SC, Klein GL, Lu Z, Christensen MD, Lozano R, Simmons DJ (1995) Rat tail suspension reduces messenger RNA level for growth factors and osteopontin and decreases the osteoblastic differentiation of bone marrow stromal cells. J. Bone Miner. Res. 10, 415–423. [DOI] [PubMed] [Google Scholar]
- Zohar R, Sodek J, McCulloch CA (1997) Characterization of stromal progenitor cells enriched by flow cytometry. Blood 90, 3471–3481. [PubMed] [Google Scholar]