Abstract
Structural studies have shown that the heads of the myosin motor molecule bind preferentially to “target zones” of favorably oriented sites on the helices of the actin filament. We present direct evidence for target zones from the interactions of a single myosin head with an actin filament held between two optically trapped beads. With compliant traps, thermal motions of the filament allow the fixed myosin-S1 to interact with at least two zones, observed as a bi-modal distribution of filament displacements due to myosin binding, whose spacing is near the 36-nm helix repeat distance. The number of binding events and the “apparent working stroke” (mean displacement with myosin bound), vary periodically as the filament is moved past the fixed myosin by displacing the traps; observed periods are close to 36 nm and the apparent stroke varies from 0–10 nm. We also observe a strong modulation at the 5.5-nm actin monomer repeat confirming that myosin interacts with a single strand and that the actin is not free to rotate. Each interaction can be assigned to an actin monomer and each active zone on the helix is made up of three actin monomers.
The motor protein myosin interacts with the filamentous protein actin in a cyclical manner driven by the hydrolysis of ATP. Actin consists of a series of monomers that can be described in terms of a double helix with a half periodicity of 36 nm (Fig. 1); the ability of a fixed myosin molecule to interact stereospecifically with actin should depend on the aspect presented by the actin helix. In a muscle, myosin is also assembled in the form of filaments and in the special case of insect flight muscle the myosin periodicity is the same as that of actin (1). Electron micrographs of this muscle have provided unequivocal evidence for myosin heads binding preferentially to “target zones” on the actin filament (2). In less specialized forms of striated muscle, target zones do not manifest themselves so clearly.
Figure 1.
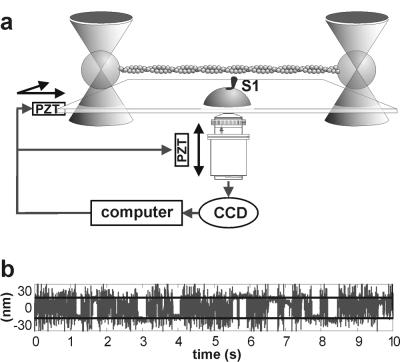
(a) Schematic of the optical trap system. (b) The first 10 s of the position record of the left bead of the dumbbell while interacting with a myosin head, using traps with a combined stiffness of 0.04 pN/nm. A total of 28 binding/detachment events were detected (8), of which 12 are readily visible. A similar fraction of total to visible event counts applies to the whole 100-s record.
We report the observation of target zones in single-molecule experiments. An actin filament is suspended between two optically trapped polystyrene beads and stretched taut, forming a “dumbbell.” The dumbbell is then positioned so that the central region of the filament is close to a fixed bead carrying on average less than one active myosin (Fig. 1a); in the presence of MgATP short-lived interactions take place (Fig. 1b), signaled by a reduction in noise. Myosin binding is governed by two aspects of the structure of the actin filament: the 5.5-nm monomer–monomer repeat distance and the 36-nm half-repeat of the actin double helix. Evidence for either of these in single molecule experiments is limited to one observation of 36-nm periodicity with position-modulated traps (3).
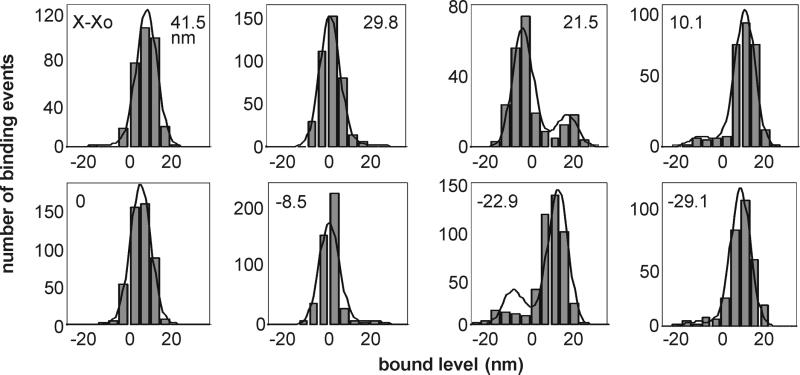
Three main factors may account for this. First, if the dumbbell is free to rotate about the filament axis, the effect of the 36-nm periodicity would decay with a time constant of about 1 s, corresponding to unhindered Einstein–Stokes rotational diffusion of the trapped beads (4). Second, a data collection time of ≈100 s is needed to obtain an adequate number of interactions, and drift as low as 1 nm in 10 s in the position of the fixed bead would obscure the 5.5-nm repeat. Third, the use of pooled data from different experiments in which the myosin position is randomized would obscure any position-dependent modulation. Molloy's definition (5) of the working stroke of the myosin head as the difference in the mean positions of the actin when free and when bound to myosin requires data to be collected in a manner that removes the modulating effect of the actin helix.
To investigate this last point it was necessary to eliminate the drift between the positions of the myosin molecule and the dumbbell, and for this reason the position of the fixed bead was servo-controlled, resulting in stability to ±0.7 nm (SD filtered at 5 KHz) along the x and y axes and ±5 nm (SD) along the z axis (optic axis). Because we now observe large modulations at ≈5.5 nm and 36–40 nm in the majority of our experiments, for most of our dumbbells the mean rotational position about the filament axis must be constrained and variation must be limited to that due to thermal fluctuation.
Materials and Methods
Optical Tweezers.
The set-up was based on a Zeiss Axiovert microscope (6). Polarizing beam splitters were used to generate two independent traps. Actin was stretched between two 1-μm polystyrene beads (7) and presented to a myosin molecule bound to a 1.5-μm glass bead attached to a microscope coverslip. The positions of the two traps were controlled by acousto-optic modulators (AOMs), which were used to move the actin filament relative to the myosin molecule. Images of the trapped beads were projected onto quadrant detector photodiodes and the image of the fixed bead onto a charge-coupled device (CCD) camera. The ×63 objective was used both to trap and to image the dumbbell. The main source of drift of the myosin molecule with respect to the actin filament comes from movement of the microscope stage with respect to the objective. In the x,y plane this was minimized by feeding back the position of the centroid of the fixed bead to a piezo controlled stage (P-723.10, Physik Instrumente, Waldbronn, Germany). For the z direction a measure of the focus, derived from the relative intensities of an inner circle of the fixed bead image and the outer annulus, was fed back to the piezo objective mover (P-731.8C, Physik Instrumente). The frequency response of these feedback systems was limited to 1 Hz to avoid the possibility of introducing high-frequency noise. Actomyosin binding events were detected by using the variance-Hidden Markov procedure (8), which also gave estimates of the stiffness of each actin-bead linkage and the myosin head. The stiffness of the links was very nonlinear and a minimum tension, typically 10 pN, was required for decisive noise reduction during myosin binding. The slope of the force-extension curve of a trap is reasonably constant for a distance of about half a bead diameter and this limits the maximum operating force. To allow relatively high tensions to be used at low trap stiffness, we used positive feedback from the quadrant detector to the acousto-optic modulator controlling the trap position, X, moving it by a fraction F of the observed bead position Xb (X = FXb). This procedure weakens the trap in the x direction by a factor 1 − F while proportionally extending the range of constant slope, and has the beneficial effect of conserving trap stiffness in the y and z directions. A stable trap is achieved when F < 1. One of the acousto-optic modulators was entirely analogue and one was digital, the latter producing a trap movement of 2.5 nm per bit and a dumbbell movement of 1.25 nm per bit. Such bit noise is obscured in thermal noise (SD 8 nm in free periods). Trapped bead positions were calibrated by using piezoelectric actuators to move the quadrant detectors in a 100-μm square wave at a frequency of 2 Hz. The resulting detector signal, together with the image magnification (×550), was used to calibrate bead movement in V/nm. The stiffness of the traps was determined from the relaxation time of bead position during application of square waves to the traps by using the AOMs. Trap stiffness was also measured from the Brownian noise of the experimental traces when the actin was not bound to myosin. The bandwidth of the four-quadrant photodetectors was 13 kHz. Signals were filtered at 5 kHz and sampled at 10 kHz, 1 bit being equivalent to about 0.2 nm.
Dumbbell Assay.
Glass microspheres (1.5 μm) suspended in 0.075% nitrocellulose in amyl acetate were applied to 18 × 18 mm coverslips. These were attached to slides with lines of petroleum jelly (spacing ≈5 mm) and then glued with cyanoacrylate along the edges of the cover slips. Such flow cells were incubated for 1 min with 10–20 μg/ml Sl, followed by 1 mg/ml BSA for 1 min and then by a mixture of 1-μm neutravidin-coated beads and 1–2 nM biotinylated actin (9). Biotinylated actin with bound rhodamine phalloidin (50 μl) was spun through 200 μl of 10% sucrose (70,000 × g, 30 min) to remove monomeric actin, and resuspended with 0.1 M rhodamine phalloidin per mole of actin. Reaction conditions were 5 μM ATP, 4 mM MgCl2, 25 mM KCl, 25 mM Hepes (pH 7.6), and deoxygenating system. Dumbbells were selected for low-compliance links between the beads and the filament such that the ratio of the position variance during free and bound periods was above 10 (8).
A Model for S1 Binding to Target Zones.
The rate of myosin binding depends on the chosen actin monomer, as reflected by the following “bound level” U, the filament displacement averaged over the bound period. Because U is measured from the resting position of the filament without bound myosin, binding frequencies also depend on the x positioning of the traps, as specified by distance X from an arbitrary origin. Although actin sites are discrete, it is convenient to proceed as if U is continuously distributed. The binding frequency is assumed to be a product of two factors, a biased Gaussian distribution describing thermally driven longitudinal fluctuations in filament position (5) and a target function for the relative frequencies to sites of different orientation. Thus
 |
1 |
where h is the myosin working stroke and
S2 ≈
kBT/κt
(where κt is the stiffness of both traps). With
a freely rotating actin filament, A(U) ≡
1. With rotation limited to local torsional fluctuations,
A(U) is a periodic function with period
b = 36 nm, the half-pitch of the actin double-helix,
because binding sites of different orientation are longitudinally
distributed along the helix and give rise to different mean filament
displacements U with myosin bound. For convenience,
compliance corrections are not included. Over all binding sites, the
mean bound displacement  or apparent working
stroke and number of binding events
Jtot are the averages
 |
2 |
which both oscillate in X with period b.
Both integrals must be calculated numerically. The mean of
 (X) over any period in X
is equal to the true working stroke h.
What form of target function is appropriate? As shown in Fig. 2, the actin filament can reach the docking position P by a combination of thermally induced movements in the y and z directions and rotation through angle φ, which is the mean angle of the site in question on the free filament. The y and z requirements are independent of torsional fluctuations of the filament and will be considered after deriving the binding rate as a function of φ. Let κactin be the torsional elastic constant for rotations of the mid-point of the filament tethered at both ends, so that the work done in twisting the midpoint from its mean orientation by angle φ is ½κactinφ2. Then the target function describing the probability of binding to one strand is proportional to the Boltzmann factor exp(−κactinφ2/2kBT) for a thermally activated twist to the required orientation. This angular dependence may be weakened by rotations of the myosin motor domain about the x axis, controlled by a torsional stiffness κmyosin as in Fig. 2, and by rotational fluctuations of the beads about the actin axis, controlled by κbeads. It can be shown that the target function to one strand of the double-helix is then proportional to exp(−κφ2/2kBT), where κ is the torsional stiffness of these elastic elements in series, so
 |
3 |
Finally, Boltzmann factors for each helical strand should be added to allow myosin to bind to either strand. As a function of U, our proposed target function has the form
 |
4 |
where α ≡
κ/kBT,
φ(U) = πU/b modulo 2π,
b is the actin half-repeat distance,
φ̃(U) = φ(U) − π modulo
2π and both angles lie within (−π,π). This function has period
b, and has been normalized to a maximum value of unity when
U = 0, which defines the origin of the X
coordinate for measuring trap positions. Each peak in
A(U) defines a target zone, with an angular
half-width of α−1/2 in radians. The amplitude
of oscillation in  (X) increases with
α and shows a maximum as a function of trap stiffness.
Figure 2.
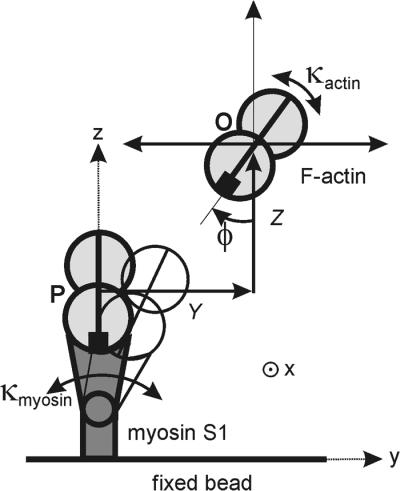
Schematic of the lateral and angular repositioning of the actin filament required to bind to myosin, as seen down the x axis: O = resting position of the filament with binding site at angle φ, P = position when docked with myosin. Only one binding site on actin is shown.
The overall frequency of myosin binding is a function of the y and z position of the actin at the midpoint of the dumbbell and is proportional to the Boltzmann factor exp(−kapp(Y2 + Z2)/2kBT), where kapp ≈ 4F/L is the apparent bending stiffness for a dumbbell of length L with lateral force F at the midpoint (10). The tolerable variations in y and z positions are defined by the root-mean-square (rms) value, which is 40 nm for F = 5 pN and L = 6 μm; a 40-nm movement of the dumbbell away from the fixed bead is observed to remove myosin interactions. If the dumbbell is misaligned in the y direction and myosin is torsionally compliant, the angle of most frequent attachment is shifted by Δφ = kapprY/κmyosin, where r is the radius of rotation of point P in Fig. 2. Numerical estimates suggest that this effect is very small unless Y ≫ 40 nm, when attachments will probably not be observed.
Results and Discussion
Target Zones.
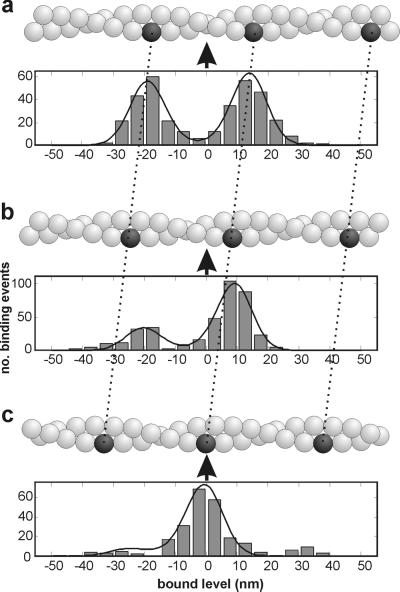
The most striking evidence that myosin binding is affected by the helical structure of actin comes from experiments using weak traps. At a combined trap stiffness of 0.04 pN/nm, the rms variation in position is 10 nm and interactions are observed over a range of at least 60 nm (Fig. 3a), which allows myosin to interact with two or more target zones; 10 s of such a record is shown in Fig. 1b. Most of the interactions, seen as periods of reduced Brownian noise, appear to be grouped around positions about 30 nm apart. This impression is confirmed by the histogram in Fig. 3a, which shows the bound levels present over a 100-s period. The data set chosen for Fig. 3a corresponds to the unbound myosin being halfway between two target zones, because there is an almost symmetrical bimodal distribution, the two peaks being separated by 30–32 nm. In Fig. 3c the unbound myosin is directly opposite a target zone, because most of the population occurs in a single mode but with minor satellite modes on either side; binding to the central zone requires no prior displacement of the filament, so the subsequent displacement is the myosin working stroke. Fig. 3b shows the intermediate situation.
Figure 3.
Histograms of the distributions of bound levels, as the dumbbell is sighted in three different x positions of the traps (a–c), display target zones for myosin binding. The two traps were moved to positions which gave an asymmetric (b) and symmetric (c) distribution. The movement required was measured from the average free level in each record after event detection (8) and was 10 nm from (a–b) and 9.6 nm (b–c). In the actin helix depicted above each histogram, the black bead represents the center of the target zone and the arrow represents the unbound myosin. Positive feedback (F = 0.5) was used in this experiment and the resulting trap stiffness was 0.04 pN/nm. The apparent working stroke in each of the three runs is close to zero.
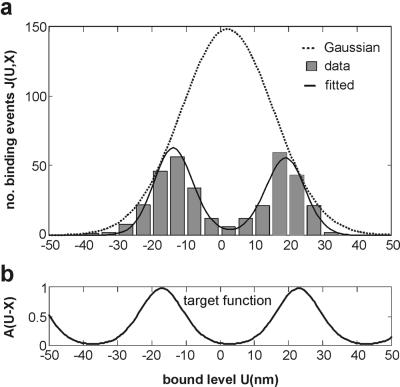
This behavior can be modeled by expressing the distribution of binding rate as the product of the distribution of free bead positions with the actin target zone described above (Fig. 4a). The fitted target function is shown in Fig. 4b and corresponds to the function in Eq. 4 with a period close to 36 nm and α = 3.7. The curves in Fig. 3 are the predictions based on this function.
Figure 4.
The decomposition of a bimodal distribution of bound displacement levels into a free Gaussian and a target function. (a) The histogram of Fig. 3a, shown with a Gaussian distribution of free displacements (Eq. 3) and the fitted distribution based on the target function A(U − X) (Eq. 4), shown separately in b. The fitted curve has α = 3.7, period b = 40 nm, offset X = 17.2 nm, and a Gaussian with mean h = 2.5 nm and standard deviation S = 13.5 nm (χ2/n = 0.23, Levenberg–Marquadt method). For this distribution, the mean value is not well conditioned. For 0.04 pN/nm traps, the expected value of S is 10 nm; the excess width arises from residual drift and undetected events.
Position-Dependent Working Strokes.
The difference of the mean bound and free positions of the dumbbell is expected to vary with the relative position of myosin and the target zones (11), and is called the “apparent working stroke.” For example, for symmetric distributions of bound levels (realized in Fig. 3 a and c) the apparent working stroke should be equal to the true working stroke h, whereas in Fig. 3b the apparent stroke should be greater than h. However, h cannot be estimated accurately from a distribution showing multiple target zones. To get a reliable estimate of h, it is desirable to use stiffer traps that constrain the free dumbbell to access little more than one target zone, and then moving the traps through an integral number of helix-repeats to fulfill the requirement for unmodulated data (8). The data sets in this figure were gathered by repeatedly sampling for 100 s, analyzing the data, and then moving the traps to improve the desired symmetry for a and c.
Experiments in which the x positions of the traps were moved
systematically with respect to the myosin were performed with somewhat
stronger traps (combined stiffness 0.08 pN/nm), to allow restricted
access to a second target zone: as will become apparent, this maximizes
the variation of the working stroke with dumbbell offset. Data sets
were collected at a series of dumbbell positions X, spaced
by about 10 nm, and determined after event detection as the mean bead
position in detached periods. The apparent working stroke
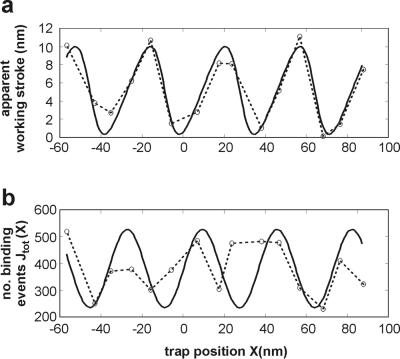
 is plotted in Fig.
5a as a function of
X. For these data a value for α of 3.1 gave the best fit.
The true working stroke is the mean value of the fitted function
 (X), here estimated as 5.2 nm. The
total number of interactions at each 10-nm offset also shows a similar
periodic dependence on position (Fig. 5b) but is
significantly more noisy, because the rate of binding is sensitive to
the z position of the dumbbell and feedback control in the
z direction is relatively poor. The predicted smooth curve
shows maxima when a target zone is centered over the myosin, at which
point the apparent working stroke is equal to its true value and the
apparent working stroke and the interaction rate are 90° out of
phase.
Figure 5.
Position-dependent event amplitudes and frequencies. The apparent
working stroke or mean bound level (a) and event
frequency (b) as a function of trap position
X (experimental points linked by dashed curve) for 15
100-s records at a combined trap stiffness of 0.08 pN/nm (no positive
feedback), together with the fitted curve
 (X) predicted by the target
function A(U − X +
Xo) (Eqs. 2 and 4).
The abscissa X is determined as the mean displacement of
free periods after event detection in the chosen channel. The smooth
curve in a was obtained by least-squares fitting
(χ2/n = 0.9), giving
S = 8.2 nm, working stroke h = 5.2 nm,
α = 3.05, b = 36.5 nm, and
Xo = 4.4 nm, which sets the phase of
the target function in Eq. 4. The theoretical curve in
b is derived from the fit to the data of a.
For the trap stiffness used, the apparent working stroke varies over a range of 0–10 nm, but the range would be smaller at either very low or very high trap stiffness. In the former case the myosin molecule would be able to interact with several target zones with almost equal facility, and in the latter case the limited ability to access a single target zone restricts the dependence of the apparent working stroke on trap position, although the variation of the interaction rate would become large. With a higher combined trap stiffness of 0.18 pN/nm, we observed a ±4 nm modulation of the apparent working stroke about a mean value of 5.5 nm (the true working stroke). All apparent strokes have been corrected upwards (typically by 10%) for compliance in myosin and actin-bead linkages as described (8). With weak traps, a bimodal distribution and some modulation of the apparent working stroke could be observed in most experiments; a peak-to-peak modulation of 10 nm was observed in about 30% of our data.
We tested our interpretation of the data by using the fitting parameters from Fig. 5a to predict the distribution of bound levels for each of the fifteen positions of the traps. All these distributions were assumed to derive from a common Gaussian distribution with h = 5.2 nm and S = 8.2 nm, and target functions of the same strength (α = 3.05), as derived from the fit in Fig. 5a. The fitted distributions shown in Fig. 6 are generated by allowing only the phase of the target function to vary, as prescribed from the mean free bead position in each record. The fits can be improved by removing the constraint of four common parameters (in particular, some values for apparent working stroke are not well fitted in Fig. 5a), but at the expense of not testing the hypothesis. However, the general trend of these modulations of the underlying Gaussian is faithfully produced by our predictions in terms of kinetically selected target zones.
Figure 6.
Distributions of bound levels as modulated by trap position X for the data whose mean bound levels are shown in Fig. 5a. The fitted curves are derived from common parameters described in the main text, with target functions of different phase X − Xo as shown. As these phases were determined by fitting the data in Fig. 5a; the fits shown here involve no free parameters whatsoever.
The Monomer Periodicity.
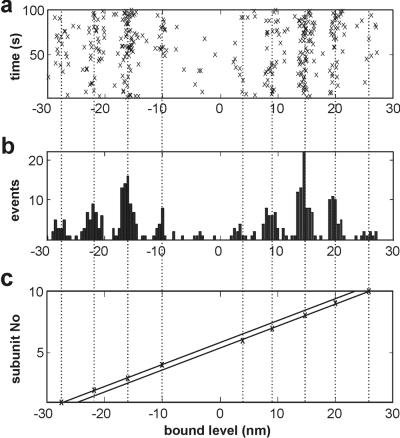
The second periodicity of interest is the 5.5-nm monomer repeat, which should produce quantized bound displacement levels at this spacing if the dumbbell is not rotating freely. If the individual bound levels are plotted as time versus bead position (Fig. 7a), the points are readily seen to fall into columns and this plot serves as a useful indicator of stage drift during the experiment. The predicted effect can be seen if the data of Fig. 3a are binned at an appropriately small interval (0.5–1 nm), as in Fig. 7b. The half-width of the peaks at 5.5-nm intervals in Fig. 7b is close to 0.5 nm, whereas the standard sampling error in the apparent working stroke is 1.1 nm. Hence all sources of drift must have been of the order of 1 nm or less throughout each record. The same effect is present throughout 11 consecutive records with different trap positions.
Figure 7.
The extent of quantization produced by the actin monomer spacing, as shown by (a) the bound displacement levels from the data of Fig. 3a, plotted against time, indicating the stability of the system over the 100-s data collection period, (b) the same data presented as a histogram of the bound displacement levels binned at 0.5 nm, and (c) the positions of the means of levels belonging to each peak of the histogram plotted against actin monomer number. The assignation of levels to actin monomer was done manually with cursors, but in this good data set there was very little ambiguity. The two lines through the sets of points have been constrained to have the same slope (5.67 ± 0.03 nm per monomer), determined by simultaneous least-squares fitting (χ2/n = 0.23). The stagger between them is equal to 2.5 nm.
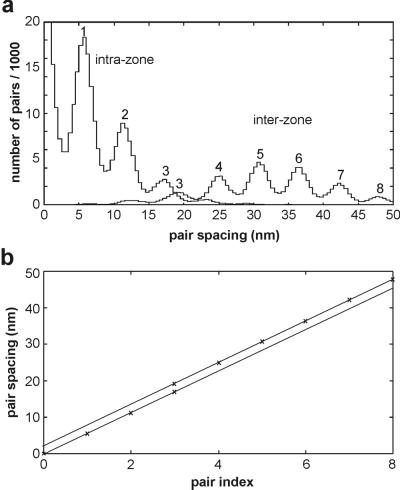
Because the observed target zones are spaced by about 36 nm rather than the 72-nm repeat of the actin helix, adjacent target zones must derive from alternate strands of the actin helix. The genetic helix of actin has a 2.75-nm repeat, so there must be a stagger of this size between successive target zones on transferring from one strand to the other. Evidence for this comes from a plot of the mean positions of interactions with individual actin monomers (Fig. 7c). Straight lines with the same gradient have been fitted to the two groups of monomers corresponding to target zones. The slope and stagger are close to the expected values. The data can also be analyzed by using histograms of the difference in displacements between all pairs of interactions, separating the pairs into those within one target zone and to those between target zones; this method allows data from different records to be combined (Fig. 8). The slope derived from eight records in this experiment was 5.68 ± 0.02 nm (SE) per subunit and the offset was 2.4 ± 0.02 nm (SE).
Figure 8.
The extent of quantization of bound levels as shown by a pair histogram. (a) The number of all pairs of bound levels within a 100-s record, separated into intrazone and interzone contributions (as seen to the right and left of zero level in Fig. 7b) and summed over eight consecutive records. (b) The positions of the peaks were determined by using standard peak fitting methods, and the most probable spacings were plotted against peak number. Straight-line fits with a common slope (see main text) confirm that the results obtained in Fig. 5 are essentially correct and reproducible over many records.
The 5.5-nm modulation is seen in pair histograms from virtually all of our data, whether or not feedback stabilization was used, provided pairings were considered only within a narrow time window (≈1 s). In none of our data do we see evidence for a 2.75-nm modulation, which might occur if the actin filament rotated freely so that sites on both strands of the actin helix were accessible to the myosin head. Modulation at 3 nm has been reported by Patlak and Warshaw,† but is not apparent in our results.
Discussion.
Our data provide direct evidence that myosin preferentially binds to target zones consisting of three actin monomers. There are seven monomers per half repeat and thus the angular spacing is 180/7 = 26°. A target function with α = 3.4 implies an angular half-width α−1/2 of 31°, which accommodates three monomers. Values for α in this range can be estimated from published stiffness data. For a 6-μm filament tethered at both ends, κactin ≈ 2–6 × 10⁻²⁰ N⋅m (10), giving α = 5–15 from this source only. By relating myosin torsion to bending of the neck that controls its longitudinal stiffness [1–2 pN/nm (8)], its torsional constant kmyosin is crudely estimated at 4 × 10⁻²⁰ N⋅m. On this basis, and neglecting link compliance, α = 3.3–6.0. The lower estimate, appropriate for our data, could arise either from the lower value of κactin or from torsional compliance in the actin-bead links.
What is the relevance of our results for target zones in vivo? In the muscle sarcomere a thin filament is attached to the Z line and has no freedom for axial movement, and also much less freedom to undergo torsional motion because many myosin heads are bound. On the other hand a myosin head attached to a filament by means of an S2 region is likely to adopt a wider range of orientations. Distinct target zones are seen in the electron microscope only in insect flight muscle (2), where each zone covers three monomers. The width of these zones is essentially as defined by our fitted target function in Fig. 4b, suggesting that the differences outlined above are compensatory. The existence of target zones in vertebrate striated muscle is consistent with a variety of electron paramagnetic resonance (12) and fluorescence probe data (13), indicating that only a modest fraction (≈20%) can bind to actin in defined orientations during contraction.
In conclusion, we find that a tethered S1-myosin binds preferentially to target zones on F-actin of about three actin monomers in extent and period 36–41 nm. There is a subperiod at the 5.5-nm monomer spacing that indicates that interactions in a given target zone are confined to a single strand. Both observations show that the actin filament is not able to rotate freely. Lastly, to get a valid measure of the working stroke it is necessary to move the traps relative to the myosin molecule, either by design or by default, through an integral number of actin repeats. Published values of the working stroke should be correct if they are the result of pooled data from many runs with a drifting microscope stage, which is equivalent to averaging over the 36-nm period. In this paper, a working stroke of 5.2–5.5 nm is found by combining results with various fixed trap positions. Similar values are obtained by moving the traps at constant velocity through a distance of two actin half-repeats (8).
Our ability to assign each myosin interaction to a specific actin monomer of known position and orientation on the double helix opens the way for high-precision single-molecule experiments using the optical tweezers technique.
Footnotes
Patlak, J. & Warshaw, D. M. (2000) Biophys. J. 78, 244a (abstr.).
References
- 1.Wray J S. Nature (London) 1979;280:325–326. [Google Scholar]
- 2.Taylor K A, Schmitz H, Reedy M C, Goldman Y E, Franzini-Armstrong C, Sasaki H, Tregear R T, Poole K, Lucaveche C, Edwards R J, et al. Cell. 1999;99:421–431. doi: 10.1016/s0092-8674(00)81528-7. [DOI] [PubMed] [Google Scholar]
- 3.Molloy J E, Burns J E, Sparrow J C, Tregear R T, Kendrick-Jones J, White D C S. Biophys J. 1995;68:298S–303S. [PMC free article] [PubMed] [Google Scholar]
- 4.Einstein A. Investigations into the Theory of the Brownian Motion. New York: Dover; 1962. [Google Scholar]
- 5.Molloy J E, Burns J E, Kendrick-Jones J, Tregear R T, White D C S. Nature (London) 1995;378:209–212. doi: 10.1038/378209a0. [DOI] [PubMed] [Google Scholar]
- 6.Tskhovrebova L, Trinick J, Sleep J A, Simmons R M. Nature (London) 1997;387:308–312. doi: 10.1038/387308a0. [DOI] [PubMed] [Google Scholar]
- 7.Finer J T, Simmons R M, Spudich J A. Nature (London) 1994;368:113–119. doi: 10.1038/368113a0. [DOI] [PubMed] [Google Scholar]
- 8.Smith D A, Steffen W, Simmons R M, Sleep J A. Biophys J. 2001;81:2795–2816. doi: 10.1016/S0006-3495(01)75922-X. [DOI] [PMC free article] [PubMed] [Google Scholar]
- 9.Ishijima A, Kojima H, Funatsu T, Tokunaga M, Higuchi H, Tanaka H, Yanagida T. Cell. 1998;92:161–171. doi: 10.1016/s0092-8674(00)80911-3. [DOI] [PubMed] [Google Scholar]
- 10.Yasuda R, Miyata H, Kinosita K. J Mol Biol. 1996;263:227–236. doi: 10.1006/jmbi.1996.0571. [DOI] [PubMed] [Google Scholar]
- 11.Smith D A. Biophys J. 1998;75:2996–3007. doi: 10.1016/S0006-3495(98)77740-9. [DOI] [PMC free article] [PubMed] [Google Scholar]
- 12.Ostap E M, Barnett V A, Thomas D D. Biophys J. 1995;69:177–188. doi: 10.1016/S0006-3495(95)79888-5. [DOI] [PMC free article] [PubMed] [Google Scholar]
- 13.Corrie J E, Brandmeier B D, Ferguson R E, Trentham D R, Kendrick-Jones J, Hopkins S C, van der Heide U A, Goldman Y E, Sabido-David C, Dale R E, et al. Nature (London) 1999;400:425–430. doi: 10.1038/22704. [DOI] [PubMed] [Google Scholar]


