

Abstract
Objectives: Histone deacetylase (HDAC) is an important therapeutic target in cancer. Two of the main anticancer mechanisms of HDAC inhibitors are induction of terminal differentiation and inhibition of cell proliferation. To investigate the role of HDAC in maintenance of self‐renewal and cell proliferation, we treated mesenchymal stem cells (MSCs) that originated from adipose tissue or umbilical cord blood with valproic acid (VPA) and sodium butyrate (NaBu).
Materials and methods: Human MSCs were isolated from mammary fat tissue and cord blood. We performed MTT assay and flow cytometry‐based cell cycle analysis to assess self‐renewal of MSCs. In vitro differentiation assays into osteogenic, adipogenic, neurogenic and chondrogenic lineages were conducted to investigate MSC multipotency. Immunocytochemistry, Western blot and reverse transcription‐polymerase chain reaction were used to interrogate molecular pathways.
Results: VPA and NaBu flattened the morphology of MSCs and inhibited their growth. VPA and NaBu activated the transcription of p21CIP1/WAF1 by increasing the acetylation of histone H3 and H4 and eventually blocked the cell cycle at G2/M phase. The expression level of p16INK4A, a cdk inhibitor that is closely related to cellular senescence, was not changed by HDAC inhibitor treatment. We performed controlled differentiation into bone, fat, cartilage and nervous tissue to elucidate the role of HDAC in the pluripotency of MSC to differentiate into functional tissues. VPA and NaBu decreased the efficiency of adipogenic, chondrogenic, and neurogenic differentiation as visualized by specific staining and reverse transcription‐polymerase chain reaction. In contrast, osteogenic differentiation was elevated by HDAC inhibitor treatment.
Conclusion: HDAC activity is essential for maintaining the self‐renewal and pluripotency of MSCs.
Introduction
Mesenchymal stem cells (MSC) can be obtained from umbilical cord blood (UCB) and adipose tissue (AD), tissues that, in humans, are generally discarded and can be harvested without penetrating surgery. UCB and AD are two of the three major MSC sources, which also include bone marrow (BM). MSCs are known to have inferior plasticity to embryonic stem cells; however, recent reports indicate that they also possess pluripotent differentiation capability in vitro, not only into mesodermal lineages such as bone, cartilage and fat, but also into ectodermal neuronal cells and endodermal hepatocytes. Although the pluripotency of MSCs is still debated, they definitely have greater potential for clinical application than stem cells of other origins. Despite these advantages, MSCs have a limited lifespan and encounter replicative senescence in repeated subcultures in vitro, and these properties are the biggest drawbacks to their use.
Pluripotency is one of the two most important characteristics of stem cells that confer their plasticity; self‐renewal is the other. Self‐renewal of a stem cell can be described as asymmetrical cell division by which a stem cell gives rise to an identical stem cell plus a daughter cell with less stemness than its mother. Physiologically, asymmetrical stem cell division occurs in the stem cell niche where stem cells are maintained. In contrast, symmetrical division occurs in culture dishes where stem cell populations increase robustly. Increase in cell number by symmetrical cell division leads to loss of stemness and eventually to cell senescence, whether functional or replicative, because MSCs also undergo typical replicative cell senescence on repeated subcultures (1, 2, 3). Many studies have reported that MSCs encounter replicative senescence around passage 10 in vitro; nevertheless, differences exist related to their origin (1, 2). Replicative senescence of MSCs involves the ‘Hayflick phenomenon’, which involves cell enlargement, changes in morphology and ultimately cessation of proliferation. Shortening of telomeres during cell division is known to trigger replicative senescence of somatic cells including adult stem cells (4). p16INK4A is implicated as a major molecule that induces premature cell senescence through a telomere‐dependent or ‐independent mechanism (5, 6). Several lines of evidence show that polycomb group genes, Bmi‐1 and Suz‐12, are involved in down‐regulation of p16INK4A in somatic cells of the stem cell compartment by methylation of core histones, which induces epigenetic modification of chromatin (7). Young cells have compact chromosomes at the CDKN2 (p16INK4A–p19ARF) locus, as a result of a high level of trimethylated histone H3 on lysine 27, caused by polycomb repressor complex‐2 (PRC2) group proteins, such as Suz‐12 and EZH1, which have histone methyltransferase activity. Replicative senescence under cell stress hinders binding of PRC2 group proteins to the CDKN2 locus reducing recruitment of PRC1 maintenance complex including Bmi‐1 to the p16INK4A promoter region. Collapse of polycomb protein complex results in increase of p16INK4A expression causing senescence (7, 8).
Histone deacetylases (HDAC) act as transcription silencers by modifying chromatin folding. Transfer of acetyl groups from acetyl coenzyme A to the ε‐amino groups of lysine residues in the histone tail is catalysed by HDACs and leads to chromatin condensation, which in turn reduces accessibility of DNA‐binding transcription factors (9). Recently, there have been several report suggesting correlation between histone acetylation and other epigenetic regulation including DNA and histone methylation (10, 11, 12). Acetylation of histone by HDAC inhibitors induced methylation of Cytosine‐phosphate‐guanine (CpG) sites without treatment of demethylating agents (10). In addition, because both acetylation and methylation can occur to the same lysine residue of histones, it was suggested that histone acetylation and methylation can compete with each other (10). Based on these epigenetic regulations of histones and DNA, histone deacetylase inhibitors are able to induce differentiation, population growth arrest and apoptosis of malignant cells, such as in leukaemia (13), and in solid tumours. In stem cells, inhibition of HDACs diminishes self‐renewal by enhancing expression of differentiation markers (14) and accelerates induced differentiation into specific lineages such as cardiomyocytes (15) and osteoblasts (16). In contrast, valproic acid (VPA), an HDAC inhibitor, enhance proliferation and self‐renewal of normal haematopoietic stem cells (17).
In the present study, we have investigated the roles of histone deacetylases in proliferation and differentiation of human MSCs.
Materials and Methods
Isolation and culture of hMSCs
Human adipose tissue‐derived MSCs (hAD‐MSC) and human umbilical cord blood‐derived MSCs (hUCB‐MSC) were isolated and cultured as previously described (18, 19). In brief, hAD‐MSCs were obtained from freshly excised human mammary fat tissue following reduction mammoplasty. The mammary fat tissue was minced and digested with collagenase type I (1 mg/ml) for 2 h at 37 °C. After washing in phosphate‐buffered saline (PBS) and centrifugation for 5 min at 192g, the pellet was filtered through 100‐μm nylon mesh and then incubated overnight at 37 °C with 5% humidified CO2 in Dulbecco’s modified Eagle’s medium (DMEM) with 10% foetal bovine serum (FBS). After 24 h in culture, unattached cells were removed and the culture medium was exchanged with K‐NAC medium supplemented with 2 mm N‐acetyl‐l‐cysteine (NAC; Sigma A8199, St Louis, MO, USA) and 0.2 mm l‐ascorbic acid.
hUCB‐MSCs were obtained from UCB immediately after delivery with consent from the mother and approval of the Boramae Hospital Institutional Review Board. UCB samples were mixed with HetaSep solution (Stem Cell Technology, Vancouver, BC, Canada) in a ratio of 5 : 1 and then incubated at room temperature until depletion of red blood cells. Supernatant was collected and centrifuged with Ficoll density‐gradient at 1201g for 20 min. Mononuclear cells were harvested and seeded on fibronectin‐coated culture dishes under normal culture conditions. Growth medium was Dulbecco’s modified Eagle’s medium (DMEM) containing 10% FBS. All procedures were previously approved by the institutional review board of Seoul National University.
Measurement of proliferation potential and cell cycle distribution
Effects of VPA and sodium butyrate (NaBu) on MSC proliferation were measured using the 3‐(4,5‐dimethylthiazol‐2‐yl)‐2,5‐diphenyltetrazolium bromide (MTT) assay as described previously (20). In brief, hUCB‐MSCs and hAD‐MSCs were plated on 24‐well plates at a density of 2.5 × 10⁴/ml and cultured for 24 h. VPA and NaBu were then added to the media at the indicated concentrations and cultures were incubated for 3 days. At the end of the incubation, 50 μl of MTT stock solution (5 mg/ml; Sigma) was added, and the plates were further incubated for 4 h at 37 °C. Five hundred microlitres of dimethyl sulphoxide was then added to solubilize the formazan crystals and absorbance was measured with an EL800 microplate reader (BioTek Instruments, Winooski, VT, USA). All measurements were performed in triplicate. Flow cytometry cell cycle analysis using propidium iodide staining was also performed as previously described (21). Briefly, MSCs in exponential growth phase were treated with HDAC inhibitors for 3 days and then harvested by trypsinization. Cells were washed with ice‐cold PBS and then fixed with 70% ethanol at − 20 °C and stained with 50 μg/ml of propidium iodide in the presence of 100 μg/ml RNase A for 30 min. Cell cycle distribution was analysed using the FACSCalibur system (Becton Dickinson, Franklin Lakes, NJ, USA).
In vitro differentiation assay
In vitro differentiation into osteogenic, adipogenic and lineages was performed as described previously (18). Briefly, hUCB‐ and hAD‐MSCs were initially cultured in growth medium containing various concentrations of VPA or NaBu and then shifted to adipogenic medium (DMEM supplemented with 5% FBS, 1 μm dexamethasone, 10 μm insulin, 200 μm indomethacin and 0.5 mm isobutylmethylxanthine) or to osteogenic medium (DMEM supplemented with 5% FBS, 50 μm l‐ascorbate‐2‐phosphate, 0.1 μm dexamethasone and 10 mm glycerophosphate). Intracellular lipid accumulation as an indicator of adipogenic differentiation was visualized by oil red O staining. After being photographed, the oil red O was eluted with 100% isopropyl alcohol and quantified with an ELISA plate reader (EL800, Bio‐Tek Instruments) at OD500. Osteogenic differentiation was noted by positive staining with alizarin red, which is specific for calcium. Neural induction was performed as described by Jori et al, with modifications (22). Briefly, hUCB‐ and hAD‐MSCs were initially cultured in pre‐induction medium composed of DMEM, 5% FBS, 10 ng/ml basic fibroblast growth factor (bFGF) and HDAC inhibitors. Cells were rinsed with PBS and shifted to the neuronal induction medium consisting of 100 μm butyrated hydroxyanisole (BHA), 50 μm forskolin, 2% dimethyl sulphoxide, 25 mm KCl, 2 mm valproic acid, 1 × B27 supplement, 10 ng/ml basic fibroblast growth factor (bFGF) and 10 ng/ml platelet‐derived growth factor (PDGF) in a base of DMEM. Cells were maintained in induction medium for up to 24 h.
Immunocytochemistry
Immunocytochemical analyses of HDAC1 and cyclin B1 were performed. Cells cultured with or without 10 mm VPA or 5 mm NaBu for 3 days were fixed in 4% paraformaldehyde and permeabilized with 0.2% Triton X‐100 (Sigma Aldrich, St Louis, MO, USA). Cells were incubated with 10% normal goat serum (Zymed Laboratories Inc., San Francisco, CA, USA) and then stained with antibodies against HDAC1 (1 : 200; Upstate Biotechnology, Lake Placid, NY, USA) and cyclin B1 (1 : 200, Santa Cruz Biotechnology, Santa Cruz, CA, USA) followed by 1‐h incubation with Alexa 488‐ or Alexa 594‐labelled secondary antibody (1 : 1000; Molecular Probes, Eugene, OR, USA). Nuclei were stained with Hoechst 33258 (1 μg/ml; 10 min) dye. Images were captured using a confocal microscope (Eclipse TE200, Nikon, Tokyo, Japan).
Western blot analysis
Western blot analyses of core histones and p21CIP1/WAF1 were performed as described previously (20). MSCs cultured with or without HDAC inhibitors for 3 days were lysed with 50 mm Tris‐HCl buffer containing 0.1% Triton X100 freshly supplemented with 1 mm phenylmethylsulfonyl fluoride, 1 mm aprotinin, 1 mm leupeptin, 1 mm antipain and 0.1 mm sodium orthovanadate. Protein content was determined using the DC assay kit (Bio‐Rad, Hercules, CA, USA), and equal amounts of protein were separated by 10–12% sodium dodecyl sulphate–polyacrylamide gel electrophoresis. They were then transferred to nitrocellulose membranes at 50 V and 350 mA for 5 h. All antibodies were used according to the manufacturer’s instructions and protein bands were detected using an enhanced chemiluminescence detection kit (Amersham Pharmacia Biotech, Buckinghamshire, UK).
Reverse transcription–polymerase chain reaction (RT‐PCR)
Total cellular RNA was extracted from cells with TRIzol Reagent™ (Invitrogen, Carlsbad, CA, USA) according to the manufacturer’s instructions. cDNA was synthesized by adding purified RNA and oligo‐dT primers to Accupower RT premix (Bioneer, Daejeon, South Korea) according to the manufacturer’s instructions. PCR was conducted using Accupower PCR premix (Bioneer). Primer sets used for this study are listed in Table S1 (Supporting Information). All PCR products were analysed by gel electrophoresis on 1.5% agarose gels with ethidium bromide staining, followed by fluorescence digitization using Bio‐Rad GelDoc XR system (Bio‐Rad). Semiquantitative RT‐PCR was conducted by quantifying RT‐PCR bands using ImageJ image analysis software (National Institutes of Health, Bethesda, MD, USA). Each gene was normalized with beta‐actin as housekeeping control. At least three independent analyses were performed for each gene.
Statistical analysis
All experiments were conducted at least in triplicate (n = 3), and results were expressed as mean ± standard deviation. Statistical analysis was conducted via analysis of variance, followed by Duncan’s multiple range tests or Student’s t‐test. A value of P < 0.05 was considered significant.
Results
HDAC inhibitors induce morphological changes and decrease proliferation potential of MSCs
In order to determine non‐cytotoxic doses of VPA and NaBu, we first assessed cytotoxicity of the two HDAC inhibitors in hUCB‐MSCs and hAD‐MSCs, using the MTT assay. Neither VPA nor NaBu induced cytotoxic cell death after 24 h of treatment at doses less than 10 mm and 5 mm, respectively (data not shown). Subsequent experiments were performed with non‐cytotoxic concentrations of each HDAC inhibitor. When VPA and NaBu were added to the growth medium of hUCB‐MSC or hAD‐MSC for 3 days, cells exhibited flattened or lengthened morphology when viewed with an inverted microscope; this morphology is considered a phenotype of terminally differentiated cells (Fig. 1a). In addition, cells treated with VPA and NaBu did not become confluent and their proliferation rate was low. We also performed MTT proliferation assays to quantify the effect of HDAC inhibitors on MSC proliferation. VPA and NaBu induced significant and dose‐dependent decreases in cell proliferation of both hUCB‐MSC and hAD‐MSC. Cell proliferation was inhibited by 50% in VPA‐treated MSCs (Fig. 1b) and by 60% in NaBu‐treated MSCs (Fig. 1c). We used HDAC inhibitors to treat human bone marrow‐derived MSCs and assessed growth ratios using MTT as well as morphological changes. In contrast to hAD‐MSC and hUCB‐MSC, we observed that proliferation of human bone marrow‐derived MSC was more sensitive to VPA than to NaBu. Morphological changes were similar to those of hAD‐MSC, which had flattened cell bodies with convoluted boundaries (Fig. S1, Supporting Information). In order to verify whether phenotypic changes induced by HDAC inhibitor treatment were related to cell senescence, we assessed the senescence marker, lysosomal pH 6 β‐galactosidase (SA‐β‐gal), in MSCs. We did not detect any increase of SA‐β‐gal upon treatment with HDAC inhibitors for 3 days in either hAD‐MSCs or hUCB‐MSCs (Fig. S2, Supporting Information).
Figure 1.
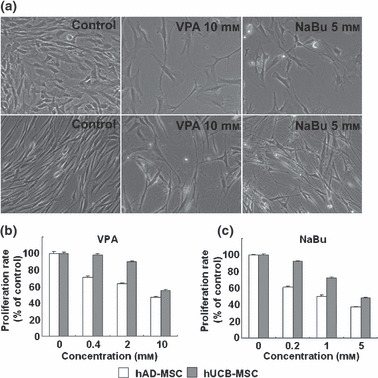
Phenotypic changes of mesenchymal stem cells (MSC) by histone deacetylase (HDAC) inhibitor. (a) Morphological changes of human umbilical cord blood‐derived MSCs (hUCB; upper panel) and human adipose tissue‐derived MSCs (hAD‐MSC; lower panel) induced by valproic acid (VPA; 10 mm) and sodium butyrate (NaBu; 5 mm). Inhibition of cell proliferation by treatment with VPA (b) and NaBu (c). Cells were treated with HDAC inhibitors in growth media for 3 days. Proliferation level was measured by MTT assay and was expressed as percentage of negative controls (0 mm). White and grey bars represent hAD‐MSC and hUCB‐MSC, respectively.
HDAC inhibitors arrest the cell cycle at the G2/M checkpoint
HDAC inhibitors are reported to induce differentiation of cells of several cancer cell lines and to arrest the cell cycle at G1 or G2/M phase. Moreover, several recent publications suggest that HDAC plays a pivotal role in controlling plasticity and self‐renewal in stem cells (14). To evaluate the role of HDACs in the proliferative potential of hUCB‐MSCs and hAD‐MSCs as a parameter of self‐renewal capability, we used propidium iodide staining and flow cytometry to analyse cell cycle distribution following VPA and NaBu treatment. As shown in Fig. 2, we observed that the proportion of cells in G2/M phase was significantly and dose‐dependently increased by treatment with VPA and NaBu. The percentage of cells in sub‐G1 phase, which represents apoptotic cell death, was not significantly increased, suggesting that cell cycle arrest induced by HDAC inhibitor treatment did not cause cell death in MSCs (Fig. 2).
Figure 2.
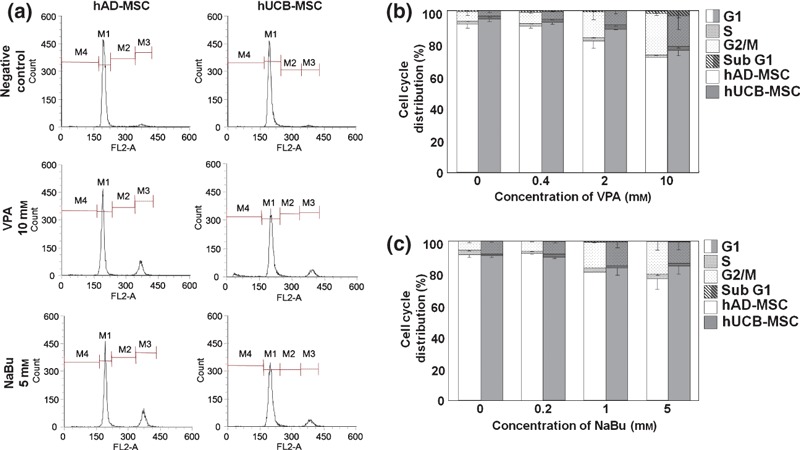
Cell cycle arrest in mesenchymal stem cells (MSC) following treatment with histone deacetylase (HDAC) inhibitors. Cell cycle distribution of human adipose tissue‐derived (hAD) and human umbilical cord blood‐derived (hUCB) MSCs was analysed by flow cytometry, as described in the Materials and methods section. (a) Representative diagrams of cell cycle distribution induced by HDAC inhibitors in hAD‐ and hUCB‐MSCs. Analyses were performed in triplicate and were expressed as bar graphs (b and c). White and grey bars represent hAD‐ and hUCB‐MSC, respectively.
Using immunocytochemical methods, we then examined localization and expression levels of HDAC1, a major HDAC in eukaryotic cells, and cyclin B1, which plays a pivotal role in G2/M transition in cell cycle progression. We observed that HDAC1, which is exclusively expressed in the nuclei of control MSCs, was expressed in the cytosol following treatment with VPA and NaBu (Fig. 3a), suggesting that HDAC1 activity was hindered by HDAC inhibitor treatment. The change in HDAC1 expression level was not significant according to ICC (Fig. 3a) and Western blot analysis (Fig. S3, Supporting Information). Treatment with HDAC inhibitors also affected localization of cyclin B1. Nuclear‐localized cyclin B1 in control MSCs was mobilized to the cytosol following HDAC inhibitor treatment (Fig. S4, Supporting Information).
Figure 3.
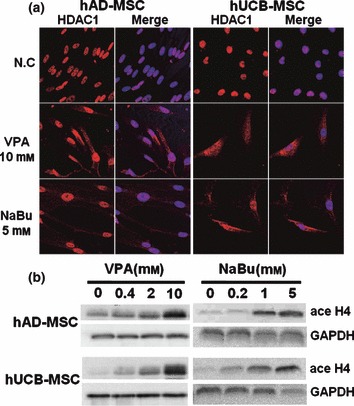
Immunocytochemical analysis of HDAC1 (a) and Western blot analyses of changes in acetylation patterns of histone H4 in mesenchymal stem cells (MSC) (b) treated with HDAC inhibitors. Cells were treated with HDAC inhibitors in growth media for 3 days. Immunocytochemistry and Western blot analyses were performed as described in the Materials and methods section.
To confirm inhibition of HDAC by VPA and NaBu, we performed Western blot analyses of core histones using specific antibodies against acetylated histones H3 and H4. As shown in Figs 3b and S3, acetylation of histones H3 and H4 increased in a dose‐dependent manner by HDAC inhibitors in hUCB‐MSC and hAD‐MSC.
HDAC inhibition induced up‐regulation of p21CIP1/WAF1
p21CIP1/WAF1 is a well‐known HDAC inhibitor‐responsive gene that is up‐regulated by hyperacetylation of histones H3 and H4. In addition, p21CIP1/WAF1 is a CDK inhibitor, responsible for cell cycle arrest induced by HDAC inhibitor treatment in many cancer cell lines (23). We conducted RT‐PCR and Western blot analyses to show that p21CIP1/WAF1 was involved in VPA‐ and NaBu‐induced cell cycle arrest in G2/M phase in hUCB‐MSCs and hAD‐MSCs. Expression levels of p21CIP1/WAF1 mRNA and protein were up‐regulated in a dose‐dependent manner by VPA and NaBu treatment in hUCB‐MSCs and hAD‐MSCs (Fig. 4a,b and S3). We also assessed mRNA expression level of p16INK4A, another CDK inhibitor responsible for G1/S transition. However, as shown in Fig. 4b, p16INK4A expression level did not change significantly upon VPA or NaBu treatment in MSCs, which, together with the results of SA‐β‐gal staining (Fig. S2), suggests that treatment with HDAC inhibitors for 3 days in culture is not sufficient to increase p16INK4A in MSCs or to induce senescence.
Figure 4.
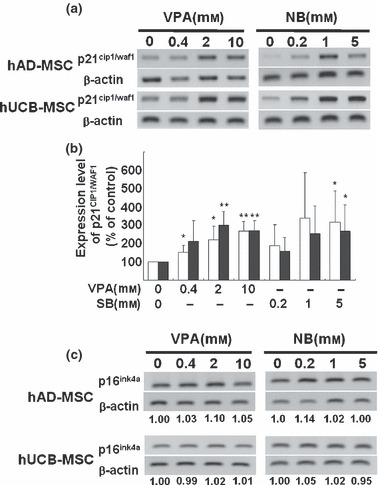
Modulation of expression levels of p21CIP1/WAF1 and p16 INK4A, cyclin‐dependent kinase inhibitors, on treatment with histone deacetylase (HDAC) inhibitors. Increment of p21CIP1/WAF1 mRNA expression detected by RT‐PCR (a) and was semiquantified by ImageJ image analysis software (n=3) (b). Expression level of p16INK4A mRNA was assessed using RT‐PCR (c).
HDAC inhibitors attenuate pluripotency of MSCs with bias towards osteogenesis
As mentioned previously, HDAC inhibitors induce not only terminal differentiation, which eventually leads to cell death in cancer cell lines, but also affect lineage‐specific differentiation of stem cells and progenitors. Since stem cells are pluripotent, which represents the ability to differentiate into multiple cell types in a lineage, we assessed whether HDAC inhibitors elevate the pluripotency of hUCB‐MSC and hAD‐MSC into bone and fat tissue. Figure 5a shows that pre‐treatment with VPA and NaBu for 1 day before osteogenic induction elevated deposition of calcium in both hUCB‐MSC and hAD‐MSC cultures, as visualized by alizarin red staining. We also observed that expression of the molecular marker for osteogenic differentiation, type 1 collagen, was elevated by pre‐treatment with HDAC inhibitors to MSCs (Fig. 5b,c). To confirm that HDAC inhibitor‐mediated elevation of differentiation was universal to tissues of multilineages, we further assessed efficiency of adipogenic, neurogenic and chondrogenic induction following treatment with HDAC inhibitors. Interestingly, we observed that pre‐treatment with VPA and NaBu for 1 day, followed by lineage‐specific induction into adipose, neural and cartilaginous tissues, as indicated in the Materials and methods, decreased efficiency for lineage‐specific differentiation (6, 7 and S5). As shown in Fig. 6, treatment with HDAC inhibitors prior to adipogenic induction decreased accumulation of lipid droplets as visualized by oil red O staining (Fig. 6a). The decrease of adipogenic induction was significant as evaluated in Fig. 6b. We confirmed that expression level of adipogenic marker, aP2, was also diminished by HDAC inhibition as shown in Fig. 6c. Figure 7 shows that pre‐treatment of HDAC inhibitors diminished efficiency of neurogenic differentiation of MSCs. One day pre‐treatment of HDAC inhibitors followed by neurogenic induction showed decreased neurite formation (Fig. 7a) and decreased expression of TUJ1 neurofilaments (Fig. 7b). Pax6 transcription factor was assessed using RT‐PCR as a marker for neurogenesis. It was observed that HDAC inhibitor pre‐treatment decreased expression of PAX6 transcription factor by neurogenic induction in a dose‐dependent fashion (Fig. 7c).
Figure 5.
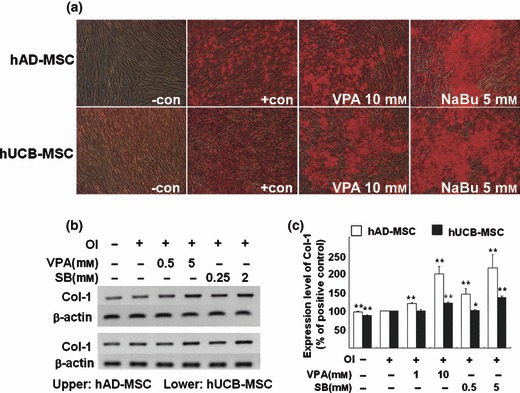
Inhibition of histone deacetylase (HDAC) enhances osteogenic differentiation of mesenchymal stem cells (MSC). Cells were pre‐treated with HDAC inhibitors for 1 day before osteogenic induction. Osteogenic induction (a) was visualized using alizarin red staining after 3‐weeks induction with osteogenic medium, in human adipose tissue‐derived (hAD; upper panel) and human umbilical cord blood‐derived (hUCB; lower panel) MSCs. RT‐PCR analysis of osteogenic marker, type 1 collagen (Col‐1), was performed (b) and semiquantification of at least three independent assays was completed using ImageJ image analysis software and was visualized (c).
Figure 6.
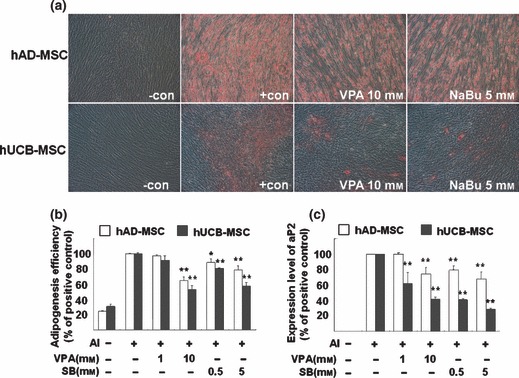
Histone deacetylase (HDAC) inhibitors reduce adipogenic potential of mesenchymal stem cells (MSC). Cells were pre‐treated with HDAC inhibitors for 1 day and were incubated in adipogenic induction medium for 1 week. Lipid droplets were visualized using oil red O staining (a). After being photographed, oil red O was eluted and absorbance was measured as described in the Materials and methods section (b). RT‐PCR analysis of the adipogenic marker, aP2, was performed and semiquantification of at least three independent assays was performed using ImageJ image analysis software and was visualized (c).
Figure 7.
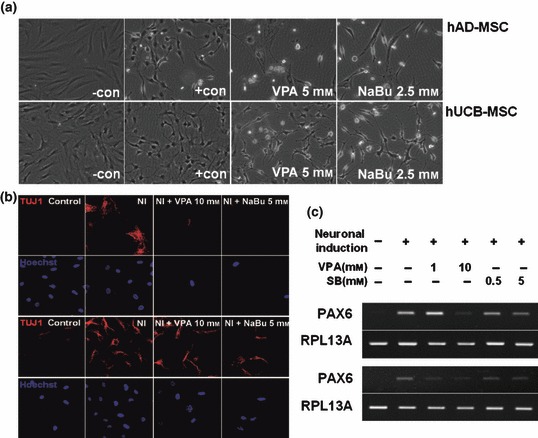
Histone deacetylase (HDAC) inhibitor delays neural differentiation of mesenchymal stem cells (MSC). Cells were pre‐treated with HDAC inhibitors in pre‐induction medium for 1 day and incubated in neural induction medium as described in the Materials and methods section. After 1 day incubation, morphological changes were observed using an inverted microscope (a), TUJ1 neurofilaments were visualized using immunocytochemistry (b), and PAX6 transcription factor, which is expressed during neurogenesis, was assessed using RT‐PCR (c).
Discussion
Stem cells are primitive cells that are capable of self‐renewal, which allows them to proliferate incessantly in vitro, and that exhibit plasticity, which refers to their ability to differentiate into tissues of multiple lineages. The recent development of regenerative medicine using stem cell technology and the application of stem cells in therapy has opened a new era in disease treatment, replacing past paradigms that focused only on pharmaceuticals and organ transplantation. Major sources of stem cells provide embryonic and adult stem cells. Pluripotent embryonic stem cells exist in the inner cell mass of a blastocyst during early development of mammals. Embryonic stem cells expand infinitely in vitro and are able to differentiate into virtually all tissue types; however, undifferentiated embryonic stem cells, when inoculated, may form teratomas. On the other hand, MSCs, a major source of adult stem cells, are less potent than embryonic stem cells but remain controversial. Nevertheless, relative safety from teratoma formation and substantial pluripotency are advantages that make MSCs the primary candidate for clinical applications (24).
Recent efforts to refine purification, selection and culturing methods have allowed access to UCB‐MSCs and AD‐MSCs of human origin. Unpublished data have shown that both these types of MSC are capable of differentiation until about the 10th passage in culture. After that, although differences exist depending on the sources and donor, they usually undergo cell senescence represented by decreased proliferation potential and other senescent phenotypes (data not shown). To better understand the roles of HDACs in proliferation and controlled differentiation of MSCs, we treated hAD‐MSCs and hUCB‐MSCs with the HDAC inhibitors, VPA and NaBu.
Our data suggest that VPA and NaBu inhibit proliferation and relatively enlarge cell shape of MSCs of both origins. These changes are essential characteristics of cell senescence, although the HDAC inhibitors herre, did not increase the senescence biomarker, SA‐β‐gal, in MSCs. We assume that inhibition of cell proliferation and changes in cell shape precede cell senescence, as 5‐day treatment with NaBu at the same concentration (5 mm) increased SA‐β‐gal in hAD‐MSC (Fig. S2).
Interestingly, HDAC inhibitors decreased proliferation potential of MSCs by arresting cell cycle at the G2/M phase. In addition, a representative target of HDAC inhibitors that affects cell cycle, p21CIP1/WAF1, was increased by HDAC inhibitor treatment. Previous reports have shown that in cancer cells, HDAC inhibitors strongly promote cell cycle arrest primarily at the G1/S checkpoint. p21CIP1/WAF1 also plays a pivotal role in G1/S arrest induced by HDAC inhibitors (25). Our data suggest that HDAC in MSC may control the same target gene as in cancer cells and may have a common regulatory mechanism; however, the role of this target gene in MSC cell cycle regulation may differ from that of cancer cells and detailed elucidation of the mechanisms underlying these actions is needed.
There are several studies that report that HDAC plays a pivotal role in osteogenesis of MSCs. Cho et al. showed that VPA treatment enhanced calcium deposition and osteogenic gene expression in adipose tissue‐ and bone marrow‐derived pluripotent stromal cells, through inhibition of HDAC (26). They also observed increase in p21CIP1/WAF1 as proof of HDAC inhibition. According to our observations, osteogenesis of hAD‐MSCs and hUCB‐MSCs occured concomitantly with overgrowth and piling‐up of thet MSCs. However, interestingly, even though p21CIP1/WAF1 expression level was elevated by pre‐treatment with HDAC inhibitors, increase in cell number in osteogenic medium was not inhibited. These results suggest that there may be a bypass mechanism that maintains proliferation of MSCs upon osteogenic induction, even if p21CIP1/WAF1 was overexpressed and blocked the cell cycle.
Reports regarding the role of HDAC in adipogenesis are inconsistent. Lagace and Nachtigal reported that HDAC inhibition by VPA and trichostatin A blocked adipogenesis of 3T3 L1 cells and human primary pre‐adipocytes, in an HDAC activity‐dependent manner (27). In contrast, Yoo et al. have suggested that a number of adipocyte markers, including proliferator‐activated receptor gamma and aP2, are regulated by HDACs. Therefore, if HDAC activity is reduced by an HDAC inhibitor or by knockdown using RNA inhibition, adipogenesis of the pre‐adipocyte increases (28). In our previous report regarding adipogenesis of hAD‐MSC, MSCs differentiated into pre‐adipocytes by adipogenic induction for 12–24 h, as evidenced by specific markers (18). Given that HDAC is important in maintaining the pre‐adipocyte stage of adipogenesis, it is reasonable that diminished HDAC activity in stem cells would block differentiation of MSCs into pre‐adipocytes and overall adipogenesis. Moreover, cell proliferation should stop before lipid accumulation begins in the cytoplasm in early stage of adipogenesis. Our recent as yet unpublished data suggest that regulation of clonal expansion is important in adipogenesis of hAD‐MSC. Briefly, CDK2, 4 and cyclin D1 down‐regulation by si‐RNA‐mediated inhibition of DNER (delta/notch‐like EGF‐related receptor) accelerate adipogenesis of hAD‐MSCs. On the contrary, mitomycin C‐induced cell cycle arrest prior to adipogenic induction decreased adipogenic efficiency (unpublished data). In the present study, expression levels of cyclins and CDKs were not changed significantly by HDAC inhibition (Fig. S3). These results, together with cell cycle arrest at the G2/M phase, suggest that there may be a difference in the adipogenic mechanism compared to that of pre‐adipocytes.
Taken together, inhibition of HDAC activity by specific pharmacological inhibitors definitely abrogated self‐renewal of MSCs and decreased their proliferation potential by cell cycle arrest at the G2/M phase. These changes were not sufficient to induce cell senescence as evidenced by SA‐β‐gal staining and p16INK4A expression levels. HDACs also played a pivotal role in multilineage differentiation capability and their inhibition accelerated lineage‐specific differentiation into bone, but reduced efficiency of adipogenic, chondrogenic and neurogenic differentiation. It remains to be determined whether inhibition of HDAC would activate differentiation genes specific to osteogenesis or makes MSCs prone to unintentional terminal differentiation. In conclusion, these results suggest that HDAC activity is essential for regulation of self‐renewal and pluripotency of MSCs.
Supporting information
Methods for supporting information.
Figure S1. Phenotypical changes of hBM‐MSCs by HDAC inhibitors. A, Morphological changes of hBM‐MSCs induced by VPA (10 mM) and NaBu (5 mM). B, Inhibition of cell proliferation by treatment with VPA (white bar) and NaBu (blac bar). Cells were treated with HDAC inhibitors in growth media for 3 d. Proliferation rate was measured by MTT assay and was expressed as percentage of negative control (‐). C, Surface marker expression of human UCB‐, AD‐, and BM‐MSCs were analyzed.
Figure S2. Cellular senescence of MSCs necessitates longer treatment of HDAC inhibitors. UCB‐ and hAD‐MSCs were treated with VPA and NaBu for 3 d or 5d and senescence associated β‐galactosidase (SA β‐gal) staining were performed to visualize senescent phenotype in MSCs.
Figure S3. Western blot analyses for HDAC1, acetylated histone H3 (Ace H3), p21CIP1/WAF1, cyclin dependent kinase (cdk) 2 and 4 and cycin B1, D1 and E after treatment of VPA in MSCs.
Figure S4. Alteration of Cyclin B1 localization by treatment of VPA was visualized by immunocytochemical analysis.
Figure S5. Effect of HDAC inhibitors on chondrogenesis of MSCs. A, Chondrogenic differentiation of hUCB‐MSC was visualized by toluidine blue staining. B, Comparison of pellet size between treatment groups.
Table S1. Sequence of primers used for RT‐PCR analyses.
Please note: Wiley‐Blackwell are not responsible for the content or functionality of any supporting materials supplied by the authors. Any queries (other than missing material) should be directed to the corresponding author for the article.
Supporting info item
Supporting info item
Supporting info item
Supporting info item
Supporting info item
Supporting info item
Supporting info item
Acknowledgements
This work was supported by grants from the Seoul R&BD program (#10548) and the Korean Science & Engineering Foundation (M10641450002‐06N4145‐00210), and by the Korea Research Foundation (KRF‐2008‐005‐J02903).
References
- 1. Kern S, Eichler H, Stoeve J, Kluter H, Bieback K (2006) Comparative analysis of mesenchymal stem cells from bone marrow, umbilical cord blood, or adipose tissue. Stem Cells 24, 1294–1301. [DOI] [PubMed] [Google Scholar]
- 2. Bonab MM, Alimoghaddam K, Talebian F, Ghaffari SH, Ghavamzadeh A, Nikbin B (2006) Aging of mesenchymal stem cell in vitro . BMC Cell Biol. 7, 14. [DOI] [PMC free article] [PubMed] [Google Scholar]
- 3. Wagner W, Horn P, Castoldi M, Diehlmann A, Bork S, Saffrich R, Benes V, Blake J, Pfister S, Eckstein V, Ho AD (2008) Replicative senescence of mesenchymal stem cells: a continuous and organized process. PLoS ONE 3, e2213. [DOI] [PMC free article] [PubMed] [Google Scholar]
- 4. Sharpless NE, DePinho RA (2004) Telomeres, stem cells, senescence, and cancer. J. Clin. Invest. 113, 160–168. [DOI] [PMC free article] [PubMed] [Google Scholar]
- 5. Alcorta DA, Xiong Y, Phelps D, Hannon G, Beach D, Barrett JC (1996) Involvement of the cyclin‐dependent kinase inhibitor p16 (INK4a) in replicative senescence of normal human fibroblasts. Proc. Natl. Acad. Sci. USA 93, 13742–13747. [DOI] [PMC free article] [PubMed] [Google Scholar]
- 6. Maurelli R, Zambruno G, Guerra L, Abbruzzese C, Dimri G, Gellini M, Bondanza S, Dellambra E (2006) Inactivation of p16INK4a (inhibitor of cyclin‐dependent kinase 4A) immortalizes primary human keratinocytes by maintaining cells in the stem cell compartment. FASEB J. 20, 1516–1518. [DOI] [PubMed] [Google Scholar]
- 7. Bracken AP, Kleine‐Kohlbrecher D, Dietrich N, Pasini D, Gargiulo G, Beekman C, Theilgaard‐Monch K, Minucci S, Porse BT, Marine JC, Hansen KH, Helin K (2007) The Polycomb group proteins bind throughout the INK4A‐ARF locus and are disassociated in senescent cells. Genes Dev. 21, 525–530. [DOI] [PMC free article] [PubMed] [Google Scholar]
- 8. Sparmann A, Van Lohuizen M (2006) Polycomb silencers control cell fate, development and cancer. Nat. Rev. Cancer 6, 846–856. [DOI] [PubMed] [Google Scholar]
- 9. Sengupta N, Seto E (2004) Regulation of histone deacetylase activities. J. Cell. Biochem. 93, 57–67. [DOI] [PubMed] [Google Scholar]
- 10. Aoyama T, Okamoto T, Kohno Y, Fukiage K, Otsuka S, Furu M, Ito K, Jin Y, Nagayama S, Nakayama T, Nakamura T, Toguchida J (2008) Cell‐specific epigenetic regulation of ChM‐I gene expression: crosstalk between DNA methylation and histone acetylation. Biochem. Biophys. Res. Commun. 365, 124–130. [DOI] [PubMed] [Google Scholar]
- 11. Cervoni N, Szyf M (2001) Demethylase activity is directed by histone acetylation. J. Biol. Chem. 276, 40778–40787. [DOI] [PubMed] [Google Scholar]
- 12. Ou JN, Torrisani J, Unterberger A, Provencal N, Shikimi K, Karimi M, Ekstrom TJ, Szyf M (2007) Histone deacetylase inhibitor Trichostatin A induces global and gene‐specific DNA demethylation in human cancer cell lines. Biochem. Pharmacol. 73, 1297–1307. [DOI] [PubMed] [Google Scholar]
- 13. Kuendgen A, Gattermann N (2007) Valproic acid for the treatment of myeloid malignancies. Cancer 110, 943–954. [DOI] [PubMed] [Google Scholar]
- 14. Karantzal E, Schulz H, Hummel O, Hubner N, Hatzopoulos A, Kretsovali A (2008) Histone deacetylase inhibition accelerates the early events of stem cell differentiation: transcriptomic and epigenetic analysis. Genome Biol. 9, R65. [DOI] [PMC free article] [PubMed] [Google Scholar]
- 15. Hosseinkhani M, Hasegawa K, Ono K, Kawamura T, Takaya T, Morimoto T, Wada H, Shimatsu A, Prat SG, Suemori H, Nakatsuji N, Kita T (2007) Trichostatin A induces myocardial differentiation of monkey ES cells. Biochem. Biophys. Res. Commun. 356, 386–391. [DOI] [PubMed] [Google Scholar]
- 16. Chen TH, Chen WM, Hsu KH, Kuo CD, Hung SC (2007) Sodium butyrate activates ERK to regulate differentiation of mesenchymal stem cells. Biochem. Biophys. Res. Commun. 355, 913–918. [DOI] [PubMed] [Google Scholar]
- 17. Bug G, Schwarz K, Schoch C, Kampfmann M, Henschler R, Hoelzer D, Ottmann OG, Ruthardt M (2007) Effect of histone deacetylase inhibitor valproic acid on progenitor cells of acute myeloid leukemia. Haematologica 92, 542–545. [DOI] [PubMed] [Google Scholar]
- 18. Park JR, Jung JW, Lee YS, Kang KS (2008) The roles of Wnt antagonists Dkk1 and sFRP4 during adipogenesis of human adipose tissue‐derived mesenchymal stem cells. Cell Prolif. 41, 859–874. [DOI] [PMC free article] [PubMed] [Google Scholar]
- 19. Sun B, Roh KH, Lee SR, Lee YS, Kang KS (2007) Induction of human umbilical cord blood‐derived stem cells with embryonic stem cell phenotypes into insulin producing islet‐like structure. Biochem. Biophys. Res. Commun. 354, 919–923. [DOI] [PubMed] [Google Scholar]
- 20. Jung JW, Cho SD, Ahn NS, Yang SR, Park JS, Jo EH, Hwang JW, Jung JY, Kim SH, Kang KS, Lee YS (2005) Ras/MAP kinase pathways are involved in Ras specific apoptosis induced by sodium butyrate. Cancer Lett. 225, 199–206. [DOI] [PubMed] [Google Scholar]
- 21. Jo EH, Kim SH, Ra JC, Kim SR, Cho SD, Jung JW, Yang SR, Park JS, Hwang JW, Aruoma OI, Kim TY, Lee YS, Kang KS (2005) Chemopreventive properties of the ethanol extract of chinese licorice (Glycyrrhiza uralensis) root: induction of apoptosis and G1 cell cycle arrest in MCF‐7 human breast cancer cells. Cancer Lett. 230, 239–247. [DOI] [PubMed] [Google Scholar]
- 22. Jori FP, Melone MA, Napolitano MA, Cipollaro M, Cascino A, Giordano A, Galderisi U (2005) RB and RB2/p130 genes demonstrate both specific and overlapping functions during the early steps of in vitro neural differentiation of marrow stromal stem cells. Cell Death Differ. 12, 65–77. [DOI] [PubMed] [Google Scholar]
- 23. Han JW, Ahn SH, Kim YK, Bae GU, Yoon JW, Hong S, Lee HY, Lee YW, Lee HW (2001) Activation of p21 (WAF1/Cip1) transcription through Sp1 sites by histone deacetylase inhibitor apicidin: involvement of protein kinase C. J. Biol. Chem. 276, 42084–42090. [DOI] [PubMed] [Google Scholar]
- 24. Wagner W, Ho AD (2007) Mesenchymal stem cell preparations – comparing apples and oranges. Stem Cell Rev. 3, 239–248. [DOI] [PubMed] [Google Scholar]
- 25. Richon VM, Sandhoff TW, Rifkind RA, Marks PA (2000) Histone deacetylase inhibitor selectively induces p21WAF1 expression and gene‐associated histone acetylation. Proc. Natl. Acad. Sci. USA 97, 10014–10019. [DOI] [PMC free article] [PubMed] [Google Scholar]
- 26. Cho HH, Park HT, Kim YJ, Bae YC, Suh KT, Jung JS (2005) Induction of osteogenic differentiation of human mesenchymal stem cells by histone deacetylase inhibitors. J. Cell. Biochem. 96, 533–542. [DOI] [PubMed] [Google Scholar]
- 27. Lagace DC, Nachtigal MW (2004) Inhibition of histone deacetylase activity by valproic acid blocks adipogenesis. J. Biol. Chem. 279, 18851–18860. [DOI] [PubMed] [Google Scholar]
- 28. Yoo EJ, Chung JJ, Choe SS, Kim KH, Kim JB (2006) Down‐regulation of histone deacetylases stimulates adipocyte differentiation. J. Biol. Chem. 281, 6608–6615. [DOI] [PubMed] [Google Scholar]
Associated Data
This section collects any data citations, data availability statements, or supplementary materials included in this article.
Supplementary Materials
Methods for supporting information.
Figure S1. Phenotypical changes of hBM‐MSCs by HDAC inhibitors. A, Morphological changes of hBM‐MSCs induced by VPA (10 mM) and NaBu (5 mM). B, Inhibition of cell proliferation by treatment with VPA (white bar) and NaBu (blac bar). Cells were treated with HDAC inhibitors in growth media for 3 d. Proliferation rate was measured by MTT assay and was expressed as percentage of negative control (‐). C, Surface marker expression of human UCB‐, AD‐, and BM‐MSCs were analyzed.
Figure S2. Cellular senescence of MSCs necessitates longer treatment of HDAC inhibitors. UCB‐ and hAD‐MSCs were treated with VPA and NaBu for 3 d or 5d and senescence associated β‐galactosidase (SA β‐gal) staining were performed to visualize senescent phenotype in MSCs.
Figure S3. Western blot analyses for HDAC1, acetylated histone H3 (Ace H3), p21CIP1/WAF1, cyclin dependent kinase (cdk) 2 and 4 and cycin B1, D1 and E after treatment of VPA in MSCs.
Figure S4. Alteration of Cyclin B1 localization by treatment of VPA was visualized by immunocytochemical analysis.
Figure S5. Effect of HDAC inhibitors on chondrogenesis of MSCs. A, Chondrogenic differentiation of hUCB‐MSC was visualized by toluidine blue staining. B, Comparison of pellet size between treatment groups.
Table S1. Sequence of primers used for RT‐PCR analyses.
Please note: Wiley‐Blackwell are not responsible for the content or functionality of any supporting materials supplied by the authors. Any queries (other than missing material) should be directed to the corresponding author for the article.
Supporting info item
Supporting info item
Supporting info item
Supporting info item
Supporting info item
Supporting info item
Supporting info item