

Abstract
Objectives
The aim of this study was to investigate differences of odonto‐differentiation between P75‐neurotrophin receptor (P75‐NTR)‐positive ectomesenchymal stem cells ( EMSCs) and P75‐NTR‐negative ectomesenchymal stem cells ( EMSCs), and their underlying mechanisms.
Materials and methods
Primary cranial neural crest‐derived cells (CNC) were isolated from the first branchial arches, and EMSCs and EMSCs were sorted by fluorescence‐activated cell sorting. Differentiation of EMSCs or EMSCs into odontoblast‐like cells was induced by dental epithelial cells in vitro or in vivo. Differential gene expression profiles between EMSCs and EMSCs were analysed by microarray assay. Smad4‐specific small interfering RNA and activator kartogenin were used to treat the cells, to evaluate effects of Smad4 in odonto‐differentiation of EMSCs or EMSCs.
Results
Under induction of dental epithelium conditioned medium, EMSCs had more mineralized node formation and higher expression of Dmp1 and Dspp compared to EMSCs. In our in vivo study, graft of EMSCs recombination with dental epithelium showed higher expression of DMP1 and DSP. Knock‐down of Smad4 in EMSCs significantly downregulated expression of DMP1 and DSP, while activation of Smad4 in EMSCs by the activator kartogenin, significantly increased DSP and DMP1 expression.
Conclusions
EMSCs showed more odonto‐differentiation potential than EMSCs both in vivo and in vitro. Smad4 played a critical role in determination of odonto‐differentiation potential of CNC‐derived EMSCs.
Introduction
Neural crest (NC) is an important transient embryonic tissue localized between the epidermis and neural tube in developing vertebrate embryo. Before neural tube closed, the neural crest cells delaminate through an epithelial–mesenchymal transition (EMT) and migrate extensively to generate a large variety of derivatives 1, 2, 3. In craniofacial development, cranial neural crest‐derived cells (CNC‐derived cells) localized in the first branchial arch form CNC‐derived ectomesenchymal stem cells (CNC‐derived EMSCs) and constitute the majority of craniofacial tissue, which present multipotent capacity of differentiation into cartilage, bone, nerve ganglia, smooth muscle, connective tissue and the majority of teeth, including pulp–dentin complex, dental pulp, dental periodontal ligament and cementum 2, 4. Till now, CNC‐derived EMSCs have been isolated from mice, rats or human and the stem cell characteristics such as multi‐differentiation potential and self‐renewal have been shown 5, 6, 7. In our previous studies 8, 9, we sorted a defined ectomesenchymal cells using the P75NTR, a potential marker for neural crest cells, from CNC‐derived EMSCs. The sorted P75NTR‐positive cells showed stable stem cell features and multi‐potential differentiation with continuous passaging 8. Therefore, we speculated that the sorted P75NTR‐positive EMSCs might play a key role in initiation, proliferation and differentiation of odontogenesis. These results presented an interesting cell source that could be used for cell and gene therapy for tooth repair and regeneration.
Tooth development provides an excellent model to study epithelial–mesenchymal interactions, which initiates organ morphogenesis and modulates signal transmission of most organs. Like other organs' initiation such as hair follicle, gland, etc, CNC‐derived EMSCs underlying ectodermal epithelium receive epithelial inductive signalling, and generate subsequently epithelial–mesenchymal interaction through complex signal cascades 10, 11, 12. However, the definitive molecule signalling mechanisms of interactions of dental epithelium with underlying CNC‐derived EMSCs have not been unrevealed in detail yet. Moreover, although numerous previous studies have demonstrated that CNC‐derived EMSCs are main progenitor cells of the dental mesenchyme, which give rise to different progeny with different phenotypes, including dental pulp, periodontal membrane cells, the non‐CNC‐derived EMSCs also participate in the development of tooth 13. Thus, the role of two different types of cells in odontogenesis potential and the mechanisms in epithelial–mesenchymal interaction need to be further studied. In present study, we sorted and identified EMSCs and EMSCs, and induced the two types of cells to differentiate odontoblast‐like cells through epithelial–mesenchymal interaction in vitro and in vivo. The results demonstrated that the EMSCs had more potentiality to differentiate to odontoblast‐like cells; and high expression level of Smad4 was responsible for the more active odontogenic differentiation ability in EMSCs.
Materials and methods
Animals and tissue preparation
All procedures used on the animals were approved by the Ethics Committee of West China College of Stomatology, Sichuan University, China. The embryonic 11.5 day (E11.5) of Sprague–Dawley (SD) rats were obtained and the first branchial arches were isolated for primary ectomesenchymal cell culture.
Primary cell isolation, culture and sorting
The ectomesenchymal cells were isolated from the first branchial arch of the E11.5 SD rat as described previously 7, 8. In brief, the first branchial arch of the E11.5 SD rat were dissected into pieces (<1 mm3). The minced pieces were digested with 2.4U collagenase I at 37° for 15 min and neutralized with Dulbecco's modified Eagle's medium/Ham's F12 (DMEM/F12; Gibco, Grand Island, NY) containing 10% foetal calf serum (FBS, Gibco). The cell suspension was filtered through 75 μm mesh (BD Biosciences, San Jose, CA, USA) and centrifuged at 800 rpm for 5 min. The cell pellet was resuspended in above medium supplemented with antibiotics (100 IU/ml penicillin and 100 μg/ml streptomycin), then cultured at 37 °C in a 5% CO2 humidified incubator.
The isolation of EMSCs and EMSCs were carried out with fluorescence‐activated cell sorting (FACS) using the third passage cells (P3) coupled with FITC‐P75NTR antibody (62122; Abcam, Cambridge, MA, USA). After cell expansion, the EMSCs cells were used to carry out the cell immunofluorescence and proliferation ratio with Cell and Counting Kit 8 (CCK‐8; Dojindo, Kumamoto Japan) according to the manufacturer's instructions.
Immunofluorescence
The EMSCs were fixed in 4% paraformaldehyde for 15 min at room temperature, permeabilized in 1% triton‐X 100 (Sigma‐Aldrich, St Louis, MO, USA), blocked with 1% BSA‐PBS for 30 min, incubated with primary antibody for 1 h at room temperature, and then, Tritc‐ or Alex‐488‐conjugated secondary antibody (Invitrogen, Carlsbad, CA, USA) was added to detect the target antigen. The cell nuclei were counterstained with DAPI and the fluorescent images were obtained by fluorescent microscope (Leica DMI 6000 B, Wetzlar, Germany,). The following primary antibodies were detected: P75NTR (AB1554; Millipore, Temecula, CA, USA), Stro‐1 (340104; BioLegend, San Diego, CA, USA), Ap2α (ab108311, Abcam), HNK‐1 (sc‐49195; Santa Cruz Biotechnology, Inc, Santa Cruz, CA, USA), vimentin (sc‐6260; Santa Cruz Biotechnology, Inc, Santa Cruz, CA, USA) and Oct‐4 (AB18976; Abcam).
Microarray assay and bioinformatic analysis
Total RNA was extracted from cells using Trizol reagent (Invitrogen) according to the manufacturer's instructions, and digested with DNase I to remove any contaminating DNA. Affymetrix GeneChip® Rat Genome 230 2.0 Array was used in microarray analysis. Three pairs of independent cell samples isolated from different dams were used for microarray analysis (n = 3). Hybridization, data capture, and analysis were performed by CapitalBio Corporation (Beijing, China). Microarray data were normalized using the robust multiarray average (RMA) method. Significance analysis of microarrays (SAM) was used to identify genes that are differentially expressed. SAM identifies genes with statistically significant changes in expression by assimilating a set of gene‐specific t‐tests, and provides an estimate of the false discovery rate (FDR) from generated data by premutation permutation process. Genes with scores higher than a threshold value or genes with FDR value lower than the threshold value were deemed significance. Furthermore, fold‐change analysis which calculates the ratios of geometric means of expression intensities was performed. To select the differentially expressed genes, we used threshold values of ≥1.5 and ≤−1.5‐fold change and a FDR significance level of <5%. Gene ontology and signalling pathway analysis of significantly different genes were analysed using the DAVID online analysis tool (http://david.abcc.ncifcrf.gov/) 14.
Smad4‐specific small interfering RNA and activator kartogenin treatment
The cells were seeded into six‐well plates and were grown until 80% confluence. The cells were transiently transfected with 150 pM of Smad4 siRNA or NC siRNA (RiboBio Guanzhou, China) using Lipofectamine ™ RNAiMAX (Invitrogen) transfection reagent according to the manufacturer's instructions. After 72 h, Smad4 mRNA and protein levels were detected by quantitative real‐time PCR and Western blotting. For Smad4 activation, cells were treated with the activator kartogenin at a concentration of 10 μm for 3 days. All experiments were performed at least three times in triplicate.
Conditioned medium of dental epithelial cells of SD rat (HAT‐CM) preparation and treatment
The HAT‐CM were prepared as described previously 15, 16. In brief, the dental epithelial cell line HAT‐7 was maintained in DMEM/F12 medium containing 10% foetal bovine serum, 100 IU/ml penicillin and 100 μg/ml streptomycin, and cultured at 37 °C in a 5% CO2 humidified incubator. The culture medium was replaced every 2 days until the cells reached 70–90% confluence. The supernatant was collected by centrifugation at 2000 rpm for 10 min to remove the dead cells, then filtrated through 0.22um strainer (Millipore). The HAT‐CM were obtained through mixed supernatant with equal volume of fresh DMEM/F12, and stored at −80 °C.
EMSCS or EMSCs were cultured with HAT‐CM and refreshed every 24 h. At different time point of 0, 4, 8, 12 days, the cells co‐cultured with HAT‐CM were observed and photographed under inverted microscope to evaluate the appearance, before collecting to perform real‐time PCR and Western blot. The mineralized matrix nodules were detected by Alizarin Red S Staining.
Real‐time reverse transcription‐polymerase chain reaction (RT‐PCR)
Total RNA was extracted by using RNAiso plus (TaKaRa Biotechnology, Dalian, China) according to the manufacturer's protocol. Reverse transcription of isolated RNA was performed by using Thermo's RevertAid First Strand cDNA Syndes' kit (Thermo, San Jose, CA, USA). Real‐time PCR was performed with SYBR Premix Ex Taq (TaKaRa Biotechnology) with ECO QPCR system (Illumine, York, PA, USA). Primer sequences for each gene were as follows: Dspp‐sense, 5′‐atgggacacagcaggataggc‐3′, antisense, 5′‐cacttccgtcacttccgttagac‐3′. Dmp1‐sense, 5′‐ccgataaggaggaggatgaaga‐3′, antisense, 5′‐actggactgtgtggtgtctgc‐3′. beta‐actin‐sense, 5′‐acggtcaggtcatcactatcg‐3′, antisense, 5′‐ggcatagaggtctttacggatg ‐3′. Smad4‐sense, 5′‐ tcgattcaaaccatccaaca‐3′, antisense, 5′‐ gccctgaagctatctgcaac‐3′. Target gene expression levels were normalized by the housekeeping gene, beta‐actin. Relative gene expression level was calculated by using the comparative Ct (2−ΔΔCt)method 17.
Western blot analysis
Western blot was conducted as described previously 18. The primary antibodies were anti‐DSP (1:1000; Santa Cruz), anti‐DMP1(1:1000; Biovision, Mountain View, CA, USA), anti‐ALP (1:1000; Abcam) and anti‐SMAD4(1:1,000; Abcam). Anti‐β‐ACTIN (1:1,000; Abcam) was used as an internal standard. Protein bands were visualized with Amersham ECL Select Western blotting detection reagent (GE) in accordance with the manufacturer's protocol.
Tissue recombination and kidney capsule transplantation
To further investigate the difference of differentiation into odontoblast‐like cells between EMSCs and EMSCs, tissue recombination detection was used. In brief, dental epithelium was dissected from the lower incisors of postnatal 5‐day SD rat. The apical ends of lower incisor were removed and incubated for 15 min in solution of 1% dispase II (Roche, Switzerland) in DMEM/F12 medium at 37 °C. After incubation, the dental epithelium was mechanically separated by using fine microforceps and incubated for 30 min in solution of 2.4U collagenase I (Invitrogen) in DMEM/F12 and neutralized (Fig. 5a) at 37 °C. The cells were cultured with epithelial cell medium (EpiCM, ScienCell, San Diego, CA, USA) according to the manufacturer's guide. Passage 3 cells were collected for use.
Figure 5.
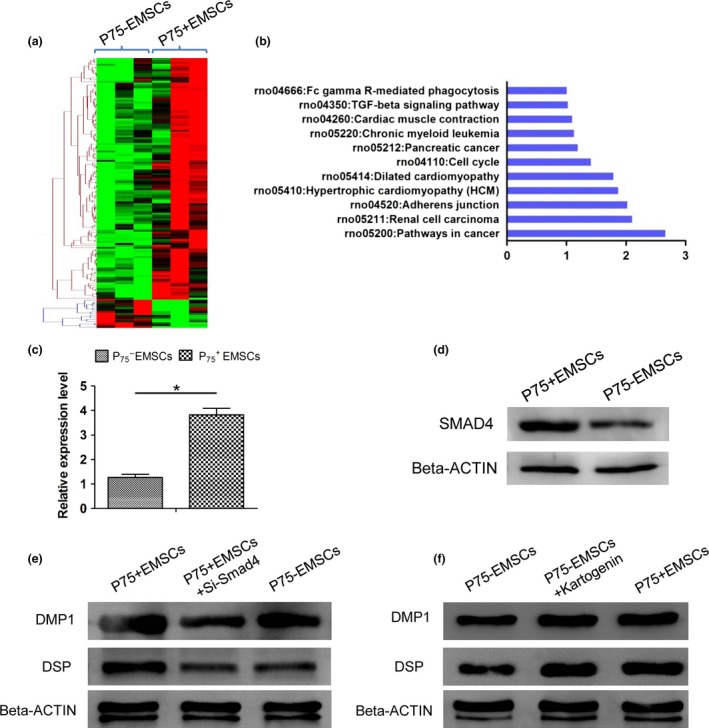
Differential expression genes between EMSC s and EMSC s. (a) Heatmap of differential genes between EMSCs and EMSCs; (b) Pathway mapping of differential expression genes between EMSCs and EMSCs; C and D: Real‐time PCR (c) and Western blot (d) confirmed that Smad4 was higher expressed in EMSCs than EMSCs; *P < 0.05; (e and f) Under induction with HAT‐CM for 3 days, Western blot showed that EMSCs expressed higher level of DSP and DMP1 than EMSCs and knock‐down of SMAD4 in EMSCs resulted in a significantly decreased DSP and DMP1 expression (e); in EMSCs, activated SMAD4 by treatment with kartogenin significantly increased DSP and DMP1 expression (f).
Before recombination, the dental epithelium was detached for 20 min at 37 °C by using 1:1 mix solution of 1% dispase II and 2.4 U collagenase I in DMEM/F12 medium, and the P3‐sorted EMSCs were detached by using 0.25% trypsin/EDTA, and then centrifuged by 600 g respectively. The cell pellets were successively seeded into a drop of 50 μl of collagen gel of Cellmatrix Type I‐A (Nitta Gelatin, Osaka, Japan) with 3:2 ratio of EMSCs (0.6 μl) and epithelium (0.4 μl) 19, 20. After cells auto‐aggregated in transwell chamber in vitro for 24 h 20, the recombinant was transplanted into renal capsule of adult SD rat. Samples were harvested 4 weeks after subrenal capsule culture, then processed for histological analysis and immunohistochemical staining.
Histology and immunohistochemistry
For histological staining, samples were fixed in 4% buffered paraformaldehyde, decalcified in 10% ethylenediaminetetraacetic acid (EDTA) and 6 μm sections were made for haematoxylin/eosin staining. Immunohistochemistry staining was performed with the ChemMate™ EnVision™ Detection Kit (Gene Tech, Shanghai, China) according to the manufacturer's protocol. The primary antibodies against Cytokeratin 14(SC‐53253; Santa Cruz), P75NTR (AB15566F; Millipore), DSP (sc‐33587; Santa cruz) and DMP1(MABD19; Millipore) were used.
Statistical analysis
All data were expressed as mean ± standard deviation (SD). Statistical significance was assessed by using the Student's t‐test for two groups or analysis of variance (Tukey's test) for multiple groups. P < 0.05 was considered as statistically significant.
Results
The EMSCS exhibited characteristic of undifferentiated mesenchymal and neural crest‐derived stem cells
As expected from our prior studies 8, the sorted EMSCs showed a high percentage (24.5%) (Fig. 1c) in mesenchymal cells (Fig. 1b) isolated from the first branchial arch of embryo of E11.5 SD rat (Fig. 1a) and exhibited more uniformed shape than those of pre‐sorting, atypical spindle‐shaped fibroblast morphology (Fig. 1d). We used immunofluorescence to assess the specific maker of mesenchymal and CNC cells. The sorted EMSCs positively expressed the mesenchymal stem cell marker Stro‐1 (Fig. 2B) and vimentin (Fig. 2E), and the lineage‐specific markers of CNC cells P75NTR (Fig. 2A), Ap2α (Fig. 2C) and HNK‐1 (Fig. 2D). We also found that the cells expressed Oct‐4 (Fig. 2F), suggesting that the sorted EMSCs have some certain features of early embryonic stemness. Furthermore, we examined the cell proliferation ability between the EMSCs and EMSCs, showing a stronger cell proliferation ability in the sorted EMSCs compared to that of EMSCs (Fig. 1F).
Figure 1.
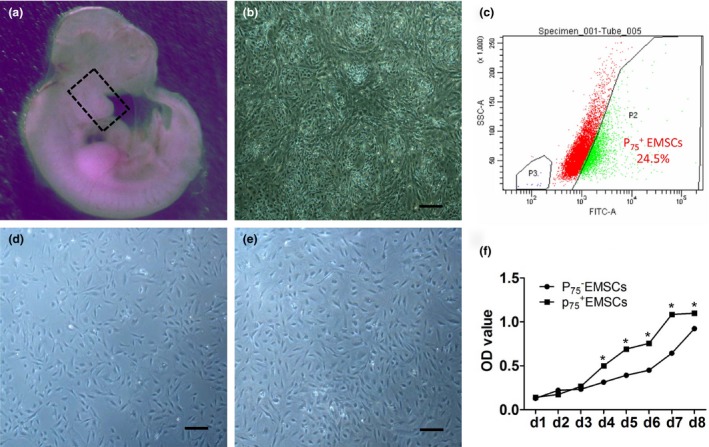
Sorting of EMSC s and EMSC s from ectomesenchymal cells isolated from the first branchial arch of the E11.5 SD rat. (a) Embryo from E11.5 SD rat, the first branchial arch (square frame) were dissected and served as the source of primary ectomesenchymal cells; (b) Primary ectomesenchymal cells; (c) Cells sorting by FCM, the ratio of EMSCs was 24.5%; (d) EMSCs after sorting; (e) EMSCs after sorting; (f) Growth curve of EMSCs and EMSCs; *P < 0.05; bar:100 μm.
Figure 2.
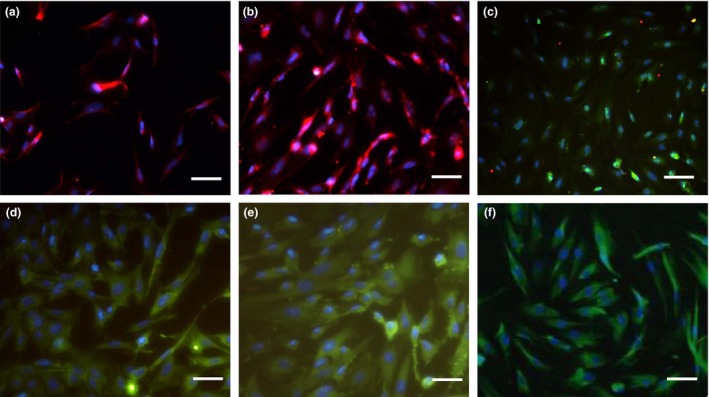
Immunofluorescence staining of EMSC s. (a) anti‐P75NTR; (b) anti‐Stro‐1; (c) anti‐Ap2α; (d) anti‐HNK‐1; (e) anti‐vimentin; (f) anti‐Oct‐4; bar:100 μm.
EMSCs showed more active odontogenic differentiation ability than EMSCs induced by conditioned medium of dental epithelial cells in vitro
In order to confirm the differences of odontogenic differentiation ability between the EMSCs and EMSCs, the cells were induced by conditioned medium of dental epithelial cells, and the expression of Dspp and Dmp1 was detected by real‐time PCR. After 4, 8 and 12 days of odontogenetic induction, the Dspp and Dmp1 of both EMSCs and EMSCs increased significantly compared to the non‐induced groups (Fig. 3a–d). However, the expression of Dspp and Dmp1 in EMSCs was higher than that of EMSCs at Days 4 and 8 (Fig. 3e,f). Moreover, there were more mineralized nodules formed in EMSCs than in EMSCs as stained with Alizarin Red S (Fig. 3g,h).
Figure 3.
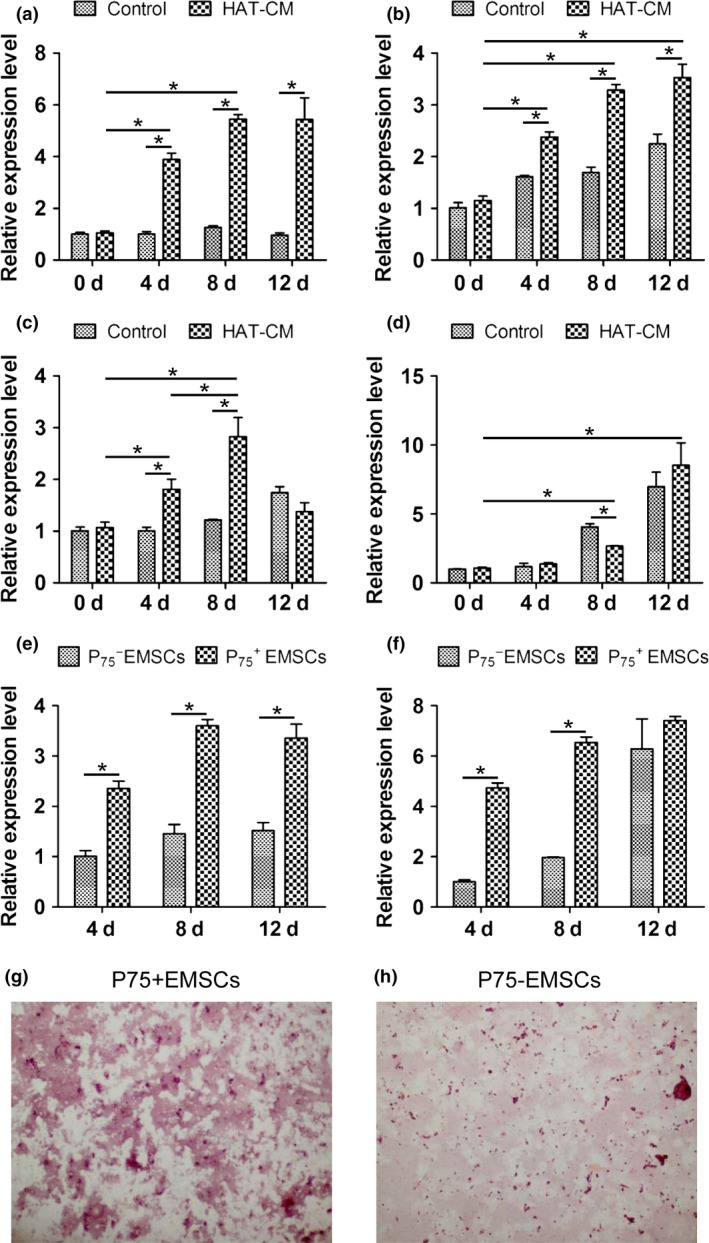
Dspp and Dmp1 expression of EMSC s and EMSC s under inductive microenvironment in vitro . Dspp (a) and Dmp1 (b) mRNA expression of EMSCs with control medium or dental epithelium conditioned medium (HAT‐CM) at different time points; Dspp (c) and Dmp1 (d) mRNA expression of EMSCs with control medium or HAT‐CM at different time points; Dspp (e) and Dmp1 (f) mRNA expression of EMSCs compared with EMSCs under HAT‐CM at different time points. *P < 0.05; Alizarin Red S staining of EMSCs (g) and EMSCs (h) with HAT‐CM for 21 days.
In vivo odontogenic differentiation of EMSCs and EMSCs
We used tissue induction mode in vivo to further evaluate the odontogenic capacity of the EMSCs and EMSCs. The cells were recombinated with dental epithelium pellets of SD rats and then transplanted into renal capsules of SD rat for further investigation. Epithelial cells isolated from 5dpn rat incisor's cervical loop. After 4 weeks of renal capsules transplantation in vivo, the dental epithelium cells in collagen gel formed island‐like structures (Fig. 4a,e). The EMSCs closely encircled with the island‐like structures of dental epithelial cells (Fig. 4b). The immunostaining of DSP proteins were only detected in EMSCs closely surrounding epithelial–mesenchymal interface (Fig. 4c). Meanwhile, DMP1 exhibited overlapping expression patterns; the DMP1 expression was comparatively weakly compared with DSP expression and detected in area where the DSP was detected (Fig. 5h). In contrast, DSP or DMP1 were not detected in EMSCs between epithelial–mesenchymal interface (Fig. 4g,h).
Figure 4.
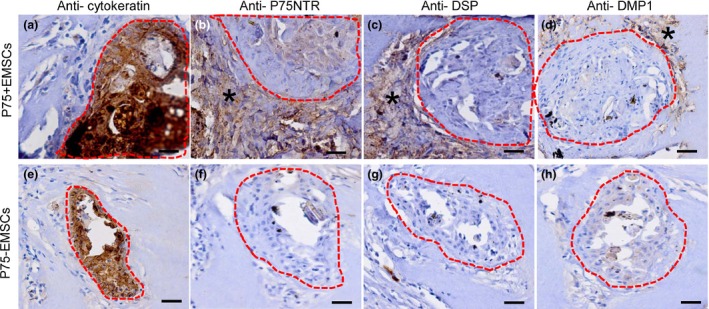
DSP and DMP 1 expression of EMSC s or EMSC s under inductive microenvironment in vivo. (a and e): the dental epithelium cells formed island‐like structure (red broken line) and were marker by immunostaining of anti‐cytokeratin; B and F: Positive immunostaining of anti‐P75 NTR was detected in graft of EMSCs groups (b, Asterisk) but not in EMSCs groups (f); (c and g): DSP was detected in EMSCs groups (c, Asterisk) but not in EMSCs groups (g); (d and h): DMP1 was detected in EMSCs groups (d, Asterisk) but not in EMSCs groups (h); bar:100 μm.
Higher level of Smad4 expression in EMSCs was responsible for the more active odotogenic differentiation ability than EMSCs
To understand the molecular mechanisms underlying the more active odotogenic differentiation ability of EMSCs, we performed genome‐wide gene expression profiling of EMSCs and EMSCs. Compared to the EMSCs, there were 128 genes upregulated and 15 genes downregulated (Fig. 5a; Table S1). KEGG pathway mapping of differentially expression genes showed that TGF‐beta signalling pathway might be involved in the difference of odotogenic differentiation ability between EMSCs and EMSCs (Fig. 5b). Specially, as a key coactivator, Smad4 was downregulated in EMSCs cells by real‐time PCR and Western blot analyses (Fig. 5c,d). Cells treated with HAT‐CM for induction of odotogenetic differentiation, EMSCs showed a higher level of DSP and DMP1 expression than EMSCs (Fig. 5e). However, inhibition of Smad4 expression by siRNA resulted in a significantly decreased DSP and DMP1 expression in EMSCs (Fig. 5e). In EMSCs cells, cells treated with SMAD4 activator, kartogenin, significantly increased DSP and DMP1 expression (Fig. 5f).
Discussion
Previous studies have confirmed that CNC‐derived EMSCs are involved in the formation of dental pulp–dentin complex, dental root, periodontal membrane and partial alveolar bone 4, 21, 22. However, the mechanisms underlying the cell differentiation have not been well investigated. Based on our previous studies 8, 9, EMSCs exhibited stable proliferation and multi‐potential differentiation in vitro. In the present study, we found that EMSCs had more active odotogenic differentiation ability than EMSCs under the induction of conditioned medium of dental epithelial cells. Moreover, we also confirmed that Smad4 expression level was responsible for the difference of odotogenic differentiation ability between EMSCs and EMSCs. Our data indicated that EMSCs might be a new and appropriate stem cell resource for odontogenesis and Smad4 expression was a key factor for regulating the cell odontoblast‐like differentiation.
During the development, the CNC cells contribute to various types of tissues of developing craniofacial organs, including the dental mesenchyme. The CNC‐derived mesenchyme differentiated into pulp–dentin complex, dental pulp, dental periodontal ligament and cementum induced by dental epithelium 23, 24. In present study, we isolated CNC‐derived EMSCs from the first branchial arch of the E11.5 embryo. Our results showed that the sorted EMSCs have the critical characteristics of neural crest cells and mesenchymal stem cells, which expressed not only the specific marker of neural crest cells such as P75NTR, Ap2α and HAK‐1 but also the marker of mesenchymal stem cells such as vimentin and Stro‐1. These results demonstrated that EMSCs had double features of the neural crest and mesenchymal stem cells 6. Furthermore, our previous studies and others' demonstrated that the sorted EMSCs have multiple lineage differentiation characteristics, including adipogenesis, osteogenesis, chondrogenesis, and have high stability during continuous passages 6, 7, 8. Investigations for dynamic distribution pattern of CNC‐derived EMSCs during tooth and mandibular morphogenesis demonstrated that the cells populate the majority of first branchial arch mesenchyme except small part of ectoderm‐ and paraxial mesoderm‐derived cells 4, 18. Our data also confirmed that there was a high percentage (24.5% on average) of EMSCs in mesenchymal cells isolated from first branchial arch. Tooth morphogenesis is characterized by reciprocal interactions between dental epithelium and mesenchymal cells derived from the cranial neural crest. In present study, odontoblast‐like differentiation of both the EMSCs and EMSCs were induced by dental epithelial cells in vivo and in vitro; however, further analysis showed that EMSCs had a more active odontogenic differentiation ability than that of EMSCs 25. All these data indicated that EMSCs might be an appropriate stem cell resource that could be used for cell and gene therapy for tooth repair and regeneration.
As mentioned above, our data showed that EMSCs had more active odontogenic differentiation ability than that of EMSCs. Here, we found that TGF‐beta signalling pathway might be closely related to the difference of odontogenesis between the EMSCs and EMSCs by gene expression profile and pathway mapping. As the centre of the canonic TGF‐beta signalling pathway, Smad4 was also identified to be a critical factor responsible the odontoblast‐like differentiation of EMSCs. During the tooth development, Smad4 was detectable in the dental epithelium and mesenchyme at all stages and also in HERS and dental pulp during tooth root development, and played important roles in regulating cell differentiation and proliferation 26. In dental epithelium, Smad4 was crucial for dental epithelium patterning and inactivation of Smad4 results in the delayed differentiation of the inner enamel epithelium. Downregulation of Msx2 and Shh, which are downstream targets of BMP signalling, is essential for the patterning of dental cusps 27, 28. In dental mesenchyme, lacking Smad4 expression in the CNC‐derived dental mesenchyme resulted in a defect in odontoblast differentiation via a mechanism that involved in upregulation of the canonical WNT signalling pathway 29. Consistent with these findings, we found that EMSCs showed a higher expression of Smad4 than that of EMSCs, and knockdown Smad4 in EMSCs resulted in significantly downregulated expression of DMP1 and DSP under the reduction of conditioned medium of dental epithelium. Moreover, activation of Smad4 in EMSCs significantly upregulated the expression of DMP1 and DSP under the induction of conditioned medium of dental epithelium. All these data indicated that Smad4 might play a central role in odontoblast‐like differentiation of CNC‐derived EMSCs. During the odontogenesis induced by interaction of epithelium–mesenchyme, the EMSCs gained more odonto‐differentiation potential than EMSCs due to Smad4 expression.
In conclusion, our data revealed that EMSCs showed more odonto‐differentiation potential than EMSCs in vivo and in vitro. Smad4 might play a critical role in determination of the odonto‐differentiation potential of CNC‐derived EMSCs. These EMSCs might act as a novel and potent stem cell resource that could be used for cell and gene therapy for tooth repair and regeneration.
Supporting information
Table S1. Microarray analysis showing the differential expression genes between EMSCs and EMSCs.
Acknowledgement
This study was supported by grants from the National Natural Science Foundation of China (30725042, 81271097, 81470032, 31070863, 81271119).
Yongjun Xing and Xin Nie have contributed equally on this study.
References
- 1. Achilleos A, Trainor PA (2012) Neural crest stem cells: discovery, properties and potential for therapy. Cell Res. 22, 288–304. [DOI] [PMC free article] [PubMed] [Google Scholar]
- 2. Zhao H, Bringas P Jr, Chai Y (2006) An in vitro model for characterizing the post‐migratory cranial neural crest cells of the first branchial arch. Dev. Dyn. 235, 1433–1440. [DOI] [PMC free article] [PubMed] [Google Scholar]
- 3. Krispin S, Nitzan E, Kassem Y, Kalcheim C (2010) Evidence for a dynamic spatiotemporal fate map and early fate restrictions of premigratory avian neural crest. Development 137, 585–595. [DOI] [PubMed] [Google Scholar]
- 4. Chai Y, Jiang X, Ito Y, Bringas P Jr, Han J, Rowitch DH et al (2000) Fate of the mammalian cranial neural crest during tooth and mandibular morphogenesis. Development 127, 1671–1679. [DOI] [PubMed] [Google Scholar]
- 5. Lin Y, Yan Z, Liu L, Qiao J, Jing W, Wu L et al (2006) Proliferation and pluripotency potential of ectomesenchymal cells derived from first branchial arch. Cell Prolif. 39, 79–92. [DOI] [PMC free article] [PubMed] [Google Scholar]
- 6. Zhang J, Duan X, Zhang H, Deng Z, Zhou Z, Wen N et al (2006) Isolation of neural crest‐derived stem cells from rat embryonic mandibular processes. Biol. Cell 98, 567–575. [DOI] [PubMed] [Google Scholar]
- 7. Deng MJ, Jin Y, Shi JN, Lu HB, Liu Y, He DW et al (2004) Multilineage differentiation of ectomesenchymal cells isolated from the first branchial arch. Tissue Eng. 10, 1597–1606. [DOI] [PubMed] [Google Scholar]
- 8. Wen X, Liu L, Deng M, Zhang L, Liu R, Xing Y et al (2012) Characterization of p75(+) ectomesenchymal stem cells from rat embryonic facial process tissue. Biochem. Biophys. Res. Commun. 427, 5–10. [DOI] [PubMed] [Google Scholar]
- 9. Wen X, Liu L, Deng M, Liu R, Zhang L, Nie X (2015) In vitro cementoblast‐like differentiation of postmigratory neural crest‐derived p75(+) stem cells with dental folliclecell conditioned medium. Exp. Cell Res. 337, 76–86. [DOI] [PubMed] [Google Scholar]
- 10. Tucker AS, Sharpe PT (1999) Molecular genetics of tooth morphogenesis and patterning: the right shape in the right place. J. Dent. Res. 78, 826–834. [DOI] [PubMed] [Google Scholar]
- 11. Kapadia H, Mues G, D'Souza R (2007) Genes affecting tooth morphogenesis. Orthod. Craniofac. Res. 10, 237–244. [DOI] [PubMed] [Google Scholar]
- 12. Jussila M, Thesleff I (2012) Signaling networks regulating tooth organogenesis and regeneration, and the specification of dental mesenchymal and epithelial cell lineages. Cold Spring Harb. Perspect. Biol. 4, a008425. [DOI] [PMC free article] [PubMed] [Google Scholar]
- 13. Feng J, Mantesso A, De Bari C, Nishiyama A, Sharpe PT (2011) Dual origin of mesenchymal stem cells contributing to organ growth and repair. Proc. Natl Acad. Sci. USA 108, 6503–6508. [DOI] [PMC free article] [PubMed] [Google Scholar]
- 14. da Huang W, Sherman BT, Lempicki RA (2009) Systematic and integrative analysis of large gene lists using DAVID bioinformatics resources. Nat. Protoc. 4, 44–57. [DOI] [PubMed] [Google Scholar]
- 15. Kawano S, Morotomi T, Toyono T, Nakamura N, Uchida T, Ohishi M et al (2002) Establishment of dental epithelial cell line (HAT‐7) and the cell differentiation dependent on Notch signaling pathway. Connect. Tissue Res. 43, 409–412. [DOI] [PubMed] [Google Scholar]
- 16. Otsu K, Kishigami R, Oikawa‐Sasaki A, Fukumoto S, Yamada A, Fujiwara N et al (2012) Differentiation of induced pluripotent stem cells into dental mesenchymal cells. Stem Cells Dev. 21, 1156–1164. [DOI] [PubMed] [Google Scholar]
- 17. Livak KJ, Schmittgen TD (2010) Analysis of relative gene expression data using real‐time quantitative PCR and the 2(‐Delta Delta C(T)) Method. Methods 25, 402–408. [DOI] [PubMed] [Google Scholar]
- 18. Imai H, Osumi‐Yamashita N, Ninomiya Y, Eto K (1996) Contribution of early‐emigrating midbrain crest cells to the dental mesenchyme of mandibular molar teeth in rat embryos. Dev. Biol. 176, 151–165. [DOI] [PubMed] [Google Scholar]
- 19. Ikeda E, Morita R, Nakao K, Ishida K, Nakamura T, Takano‐Yamamoto T et al (2009) Fully functional bioengineered tooth replacement as an organ replacement therapy. Proc. Natl Acad. Sci. USA 106, 13475–13480. [DOI] [PMC free article] [PubMed] [Google Scholar]
- 20. Nakao K, Morita R, Saji Y, Ishida K, Tomita Y, Ogawa M et al (2007) The development of a bioengineered organ germ method. Nat. Methods 4, 227–230. [DOI] [PubMed] [Google Scholar]
- 21. Cho SW, Hwang HJ, Kim JY, Song WC, Song SJ, Yamamoto H, Jung HS. (2003) Lineage of non‐cranial neural crest cell in the dental mesenchyme: using a lacZ reporter gene during early tooth development. J. Electron. Microsc. (Tokyo) 52, 567–571. [DOI] [PubMed] [Google Scholar]
- 22. Abe S, Hamada K, Miura M, Yamaguchi S (2012) Neural crest stem cell property of apical pulp cells derived from human developing tooth. Cell Biol. Int. 36, 927–36. [DOI] [PubMed] [Google Scholar]
- 23. Jheon AH, Schneider RA (2009) The cells that fill the bill: neural crest and the evolution of craniofacial development. J. Dent. Res. 88, 12–21. [DOI] [PMC free article] [PubMed] [Google Scholar]
- 24. Zhao H, Chai Y (2015) Stem cells in teeth and craniofacial bones. J. Dent. Res. 94, 1495–501. [DOI] [PMC free article] [PubMed] [Google Scholar]
- 25. Yamazaki H, Tsuneto M, Yoshino M, Yamamura K, Hayashi S (2007) Potential of dental mesenchymal cells in developing teeth. Stem Cells 25, 78–87. [DOI] [PubMed] [Google Scholar]
- 26. Huang X, Xu X, Bringas P Jr, Hung YP, Chai Y (2010) Smad4‐Shh‐Nfic signaling cascade‐mediated epithelial‐mesenchymal interaction is crucial in regulating tooth root development. J. Bone Miner. Res. 25, 1167–1178. [DOI] [PMC free article] [PubMed] [Google Scholar]
- 27. Bei M, Kratochwil K, Maas RL (2000) BMP4 rescues a non‐cell‐autonomous function of Msx1 in tooth development. Development 127, 4711–4718. [DOI] [PubMed] [Google Scholar]
- 28. Dassule HR, Lewis P, Bei M, Maas R, McMahon AP (2000) Sonic hedgehog regulates growth and morphogenesis of the tooth. Development 127, 4775–4785. [DOI] [PubMed] [Google Scholar]
- 29. Li J, Huang X, Xu X, Mayo J, Bringas P Jr, Jiang R et al (2011) SMAD4‐mediated WNT signaling controls the fate of cranial neural crest cells during tooth morphogenesis. Development 138, 1977–1989. [DOI] [PMC free article] [PubMed] [Google Scholar]
Associated Data
This section collects any data citations, data availability statements, or supplementary materials included in this article.
Supplementary Materials
Table S1. Microarray analysis showing the differential expression genes between EMSCs and EMSCs.