Abstract
Abstract. Objectives: Thyroid hormones mediate many physiological and developmental functions in humans. The role of the 3,3′,5‐triiodo‐l‐thyronine (T3) in normal human haematopoiesis at the cellular and molecular levels has not been determined. In this study, it was revealed that the human haematopoietic system might be directly depended on T3 influence. Materials and methods: We detected the TRα1 and TRβ1 gene expression at the mRNA level in human cord blood, peripheral blood and bone marrow CD34+‐enriched progenitor cells, using the RT‐PCR method. Furthermore, we performed Western blotting to prove TRα1 and TRβ1 expression occurs at the protein level in human cord blood, peripheral blood and bone marrow CD34+ cells. In addition, the examined populations of cells were exposed in serum‐free conditions to increasing doses of T3 and were subsequently investigated for clonogenic growth of granulocyte‐macrophage colony‐forming unit and erythrocyte burst‐forming unit in methylcellulose cultures, and for the level of apoptosis, by employing annexin V staining and the terminal deoxynucleotidyltransferase‐mediated dUTP nick‐end labelling method. We investigated expression levels of apoptosis‐related Bax and antiapoptotic Bcl‐2 and Bcl‐x L genes in the examined cells. Results: We found that exposure to higher and lower than normal concentration of thyroid hormone significantly influenced clonogenecity and induced apoptosis in human haematopoietic progenitor cells. Conclusions: This study expands the understanding of the role of thyroid disorders in normal human haematopoiesis and indicates a direct influence of T3 on this process.
INTRODUCTION
Thyroid hormones (THs) are produced in the thyroid gland and play critical roles in differentiation, growth and metabolism. The biologically active form of thyroid hormones is 3,3′,5‐triiodo‐l‐thyronine (T3). T4 has been determined to be the pro‐hormone of T3 (Oppenheimer 1999). The multiple functions of THs are mediated by binding of T3 to specific nuclear receptors (TRs), encoded on separated genes, TRα and TRβ. Each of them has two isoforms 1 and 2 (Yen 2001). TH receptor is a multi‐functional protein: it is a transcriptional repressor in the absence of ligand and a transcriptional activator in the presence of T3 (Wu & Koenig 2000).
Thyroid hormones regulate the cell cycle, proliferation and apoptosis of different types of human cells (Lin et al. 1999; Hara et al. 2000), and they play an important role in development. THs have been known to be important regulators of bone development and metabolism (Allain & McGregor 1993; Varga et al. 1997). Previous reports have shown that THs have critical functions on the developing brain in utero as well as during the neonatal period (Oppenheimer & Schwartz 1997) and influence oligodendrocyte progenitor cells in a direct manner (Baas et al. 1997). Until recently, it was known whether THs influenced proliferation and differentiation of human haematopoietic stem/progenitor cells (HSPC). Thus, first in the present work, we have aimed to verify whether TH receptors are expressed on HSPCs or not.
Evidence for a role of THs/TRs in haematopoiesis has been unclear so far and mostly indirect. Disturbed thyroid function can cause haematologic disorders. Importantly, hypothyroidism is frequently associated with certain forms of anaemia or hyper‐proliferation of immature erythroid progenitors. Typically, it is macrocytic hypochromic anaemia of moderate severity (Horton et al. 1976). On the contrary, anaemia is not a frequent finding in the course of hyperthyroidism, while erythrocytosis is fairly common (Fein & Rivlin 1975; Corrocher et al. 1981). All parameters involved in erythropoiesis return to normal when a euthyroid state is produced (Perlman & Sternthal 1983). With regard to leucocytes, elevated, normal or slighty depressed total leucocyte counts have been observed in hyperthyroid patients with only relative decrease in the number of neutrophils and relative increase in the number of eosinophils and mononuclear cells. Nevertheless, the hyperplasia of all myeloid systems in cases of hyperthyroidism and hypoplasia of all myeloid systems has been reported (Axelrod & Bergman 1951). Recently, it has been shown that T3 is required for normal B cell production in the bone marrow through regulation of pro‐B cell proliferation (Foster et al. 1999; Arpin et al. 2000).
Moreover, treatment with neuroendocrine hormones has been suggested to improve reconstitution of the immune system after haematopoietic stem cell transplantation, whereas the mechanisms involved in THs action in haematopoiesis still remain unclear (Omazic et al. 2001).
Based on this, we have studied the role of THs and TH receptors in human haematopoiesis in vitro. Using human cord blood (CB), peripheral blood (PB) and bone marrow (BM) CD34+‐enriched cells, here, we provide evidence of presence of TRs on HPSC. In addition, we have found that exposure to increasing doses of T3 influences clonogenicity and levels of apoptosis in human haematopoietic progenitor cells in vitro. These observations raise the possibility that T3 influences a function of human haematopoietic progenitor cells in a direct manner.
MATERIALS AND METHODS
Cells
CD34+‐enriched progenitor cells obtained from human CB, PB and BM were used in our experiments. CB was obtained during delivery, from five consenting healthy women, at the Clinic of Obstetrics Pomeranian Medical University in Szczecin, Poland. PB was obtained from five healthy (TSH 4 ± 2 pmol/L; fT3 1.8–4.2 pg/mL; fT4 0.7–1.9 ng/mL) volunteers after informed consent was given: BM was obtained from five heparinized cadaveric organ donors (HCOD). Approximately 15 mL of PB and 40 mL of CB and BM was collected in sodium heparin. The procedure was approved by the local ethical committee and is in accordance with the Helsinki Declaration of 1975. Moreover, in every case of blood sampling, the donor provided special permission.
The normal light‐density mononuclear cell (MNC) fraction was depleted of adherent cells and T lymphocytes (A‐T‐MNC) as previously described (Machalinski et al. 1999). The obtained fraction was enriched for CD34+ cells with CD34+ isolation MiniMACS kit (Miltenyi Biotec, Sunnyvale, CA, USA) according to the manufacturer's protocol. Cells were counted using a haemocytometer, and the viability of cells was assayed by the trypan blue exclusion test as previously described (Ratajczak et al. 1992).
Thyroid hormone
CD34+ progenitor cells were incubated with increasing concentrations of T3 or without the hormone for 24 and 72 h, at 37 °C, 95% humidity and 5% CO2, at serum free conditions. The following concentrations of T3 were used: a half of physiological (0.5×N), physiological (N), 5, 10 and 50 times higher then physiological (5, 10 and 50×N). The physiological concentration (N) at T3 was referred as: 0.3 ng/100 mL.
TR expression at mRNA level
Total RNA was isolated from 1 × 10⁶ MNC using an RNeasy Mini Kit (Qiagen Inc., Valencia, CA, USA) according to the manufacturer's protocol. TR genes were assessed by a semi‐quantitative PCR as described (Omazic et al. 2001). β‐Actin level was used as an internal control. One microgram of total RNA was reverse‐transcribed to cDNA with M‐MLV reverse transcriptase (Promega, USA). Using TR primers: TRα1 upstream 5′‐TTG CGA AGA CCA GAT CAT CCT‐3′, downstream 5′‐GTG GGG CAC TCG ACT TTC AT‐3′; and TRβ1 upstream 5′‐GTC GTC GCC ACA TCT CAT C‐3′, downstream 5′‐CCA TTT CCC CAT TCA AGG TTA‐3′ (Iskaros et al. 2000), cDNA was amplified. Amplification was performed for 25 cycles with an initial hot start at 92 °C for 2 min, followed by 45 s denaturation at 94 °C, 45 s of annealing at 55 °C, 1 min of extension at 72 °C, and a final extension period of 5 min. 15 µL aliquots were run a 1.5% agarose gel.
TR expression at protein level
Western blots were performed using extracts prepared from 1 × 10⁶ CB, PB and BM MNC. Cells were lysed for 10 min on ice in M‐pre lysing buffer (Pierce, Rockford, IL, USA) containing protease inhibitors (Sigma, St. Louis, MO, USA). Subsequently, extracted proteins were separated by 10% sodium dodecyl sulfate polyacrylamide gel electrophoresis and fractioned proteins were transferred to a nitrocellulose membrane (Schleicher & Schuell, Keene, NH, USA). The TRα1 protein was detected using rabbit polyclonal immunoglobulin G (IgG) as the primary antibody and bovine antirabbit IgG conjugated with horseradish peroxidase as secondary antibody (Santa Cruz Biotech, Santa Cruz, CA, USA). The TRβ1 protein was detected using mouse monoclonal IgG1 as primary antibody and goat antimouse IgG1 conjugated with horseradish peroxidase as secondary antibody (Santa Cruz Biotech, Santa Cruz, CA, USA). The membranes were developed with an enhanced chemiluminescence reagent (Amersham Life Sciences, Buckinghamshire, UK) and subsequently were dried and exposed to film (HyperFilm, Amersham Life Sciences). β‐actin levels were used as the internal control (monoclonal antiβ‐actin antibody, AC74, Sigma). This procedure was performed three times.
Cell cultures
After 24 and 72 h incubation with T3, CD34+ cells (2 × 10⁴) were re‐suspended in 0.4 mL Iscove modified Dulbecco's medium and were mixed with 1.8 mL methylcellulose medium MethoCult HCC‐4230 (StemCell Technologies Inc., Vancouver, Canada) supplemented with l‐glutamine and antibiotics. Respective recombinant human growth factors were added to the mixture (Migliaccio et al. 1988). In the case of granulocyte‐macrophage colony‐forming units (CFU‐GM) IL‐3 20 U/mL, stem cell factor (SCF) (10 ng/mL) and granulocyte‐macrophage colony‐stimulating factor (GM‐CSF) (5 ng/mL) (R&D Systems, Minneapolis, MN, USA) were employed and Epo (5 U/mL), SCF (10 ng/mL) and IL‐3 (20 U/mL) (R&D Systems) were used for erythrocyte burst‐forming units (BFU‐E). Colonies were counted using an inverted microscope on day 11 in case of BFU‐E and on day 14 in the case of CFU‐GM. Cultures were performed in quadruplicate. Results were expressed as percentage of the control value taken as 100% (Machalinski et al. 1999).
Apoptosis assays
The process of apoptosis was estimated by two different flow cytometric methods. Combined Annexin V and propidium iodide [Becton Dickinson (BD) Biosciences, San Diego, CA, USA] was used to assess the level of apoptosis in living cultures. Binding of fluorescein‐conjugated Annexin V and propidium iodide was analyzed by flow cytometry (FACScan, BD Bioscences). To verify obtained results the terminal deoxynucleotidyltransferase‐mediated dUTP nick‐end labelling (TUNEL) assay (APO‐DIRECT, BD Biosciences) was used. DNA breaks were labelled and visualized with FITC‐dUTP for assessment on a FACScan flow cytometer (BD Bioscences) (Baskiewicz‐Masiuk et al. 2003). We also detected expression levels of pro‐apoptotic Bax and antiapoptotic Bcl‐x L, and Bcl‐2 genes in the subject cells. After 24 and 72 h incubation without T3 and with N and 50×N of T3, total RNA was isolated as described above. Bcl‐2, Bcl‐xL and Bax levels were assessed by a semi‐quantitative PCR as previously described (Majka et al. 2000).
Statistical analysis
The arithmetic means and standard deviations were calculated by IBM computer using Statistica versus 5.0. Data were analyzed using Student's t‐test for unpaired samples. Statistical significance was defined as P < 0.05.
RESULTS
Analysis of TR expression at mRNA level in human CD34+‐enriched progenitor cells
TRα1 and TRβ1 gene expressions were detected at the mRNA level using RT‐PCR. Transcripts were found for TRα1 and TRβ1 in CB, PB and BM CD34+‐enriched progenitor cells. Figure 1 shows detection of TRα1 and TRβ1 gene expression in cells obtained from human CB, PB and BM.
Figure 1.
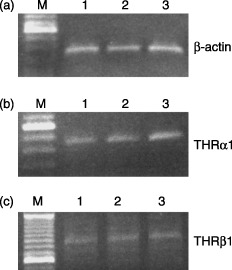
Gel‐separated RT‐PCR products. TRα1 and TRβ1 mRNA expression in CD34+ cells obtained from CB, PB and BM. RT‐PCR products separated on a gel; (a) β‐actin; (b) TRα1; (c) TRβ1; lane M: molecular weight DNA marker; lane 1: CB; lane 2: PB; lane 3; BM.
Analysis of TR expression at protein level in human CD34+‐enriched progenitor cells
Sequence‐specific sensitivity to the TRα1 and TRβ1 products has been proven by Western blot analysis. Figure 2(a) shows the representative example of TRα1 expression at protein level in cells obtained from CB, PB and BM. In case of TRα1, 8 µg per well of total protein was loaded. TRβ1 was detected only in case of cells obtained from PB and BM after loaded 33 µg total protein per well (Fig. 2b). Equivalent results were obtained three times.
Figure 2.
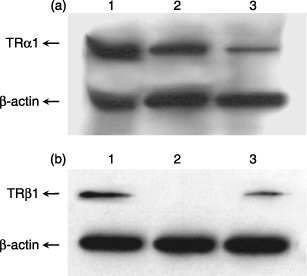
Analysis of TR expression at protein level in human CD34+‐enriched progenitor cells, by Western blot analysis. (a) TRα1 expression at protein level; (b) TRβ1 expression at protein level; line 1: human BM CD34+ cells; line 2: human CB CD34+ cells; line 3: human PB CD34+ cells.
The influence of T3 on clonogenicity of human CD34+‐enriched progenitor cells
It was observed that growth of CFU‐GM colonies generated from CB CD34+ cells decreased at higher concentration of T3 as compared to physiological concentration of the hormone after prolonged exposure (72 h) (Fig. 3). No statistically significant changes were visible after 24‐h exposure to low dose of T3. Similar results were observed in the case of BFU‐E (erythroid) colonies (data not shown).
Figure 3.
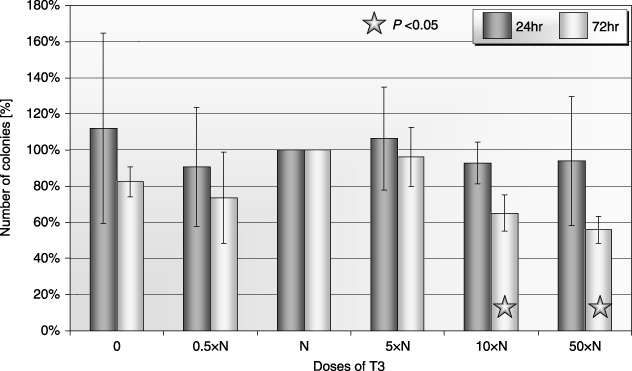
Influence of T3 on clonogenicity of human CB CFU‐GM after 24‐ and 72‐h incubation (± SD) (n = 5). Cells incubated: 0: without T3; 0.5×N: with a half of physiological dose of T3; N: with a physiological dose of T3; 5×N: with five times higher then physiological dose of T3; 10×N: with 10 times higher then physiological dose of T3; 50×N: with 50 times higher then physiological dose of T3.
In the case of PB, we found an unexpected increase in clonogenicity of CFU‐GM at higher doses of T3 (Fig. 4). Differences in growth of PB BFU‐E colonies after 24 h of exposure to low doses of T3 were not statistically significant. Growth of colonies was decreased at the highest doses of T3 after prolonged exposure (Fig. 5). Exposure to the highest concentrations of T3 significantly inhibited the growth of BM CFU‐GM (Fig. 6). Similar results were observed in erythroid colonies (data not shown).
Figure 4.
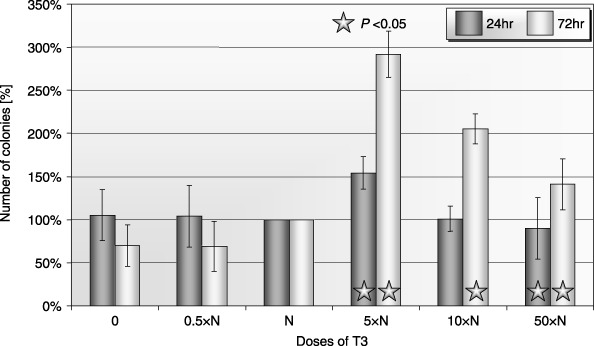
Influence of T3 on clonogenicity of human PB CFU‐GM after 24‐ and 72‐h incubation (± SD) (n = 5). Cells incubated: 0: without T3; 0.5×N: with a half of physiological dose of T3; N: with a physiological dose of T3; 5×N: with five times higher then physiological dose of T3; 10×N: with 10 times higher then physiological dose of T3; 50×N: with 50 times higher then physiological dose of T3.
Figure 5.
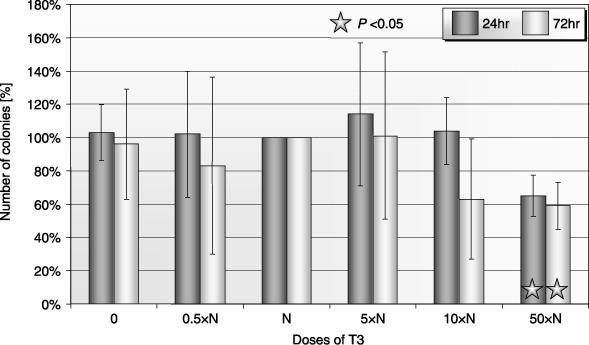
Influence of T3 on clonogenicity of human PB BFU‐E after 24‐ and 72‐h incubation (± SD) (n = 5). Cells incubated: 0: without T3; 0.5×N: with a half of physiological dose of T3; N: with a physiological dose of T3; 5×N: with five times higher then physiological dose of T3; 10×N: with 10 times higher then physiological dose of T3; 50×N: with 50 times higher then physiological dose of T3.
Figure 6.
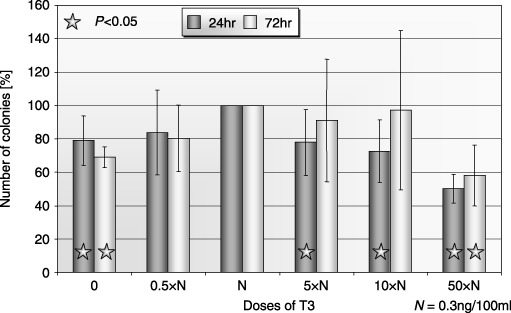
Influence of T3 on clonogenicity of human BM CFU‐GM after 24‐ and 72‐h incubation (± SD) (n = 5). Cells incubated: 0: without T3; 0.5×N: with a half of physiological dose of T3; N: with a physiological dose of T3; 5×N: with five times higher then physiological dose of T3; 10×N: with 10 times higher then physiological dose of T3; 50×N: with 50 times higher then physiological dose of T3.
The influence of T3 on the apoptosis of human CD34+‐enriched progenitor cells
Annexin staining was employed to label apoptotic cells after 24‐ and 72‐h exposure to T3. This method has provided a chance to assess apoptosis in two stages, early and late. It has been found that percentage of apoptotic cells in CB was significantly higher in samples without T3 and in these incubated with the highest dose of the 24‐h incubation cohort (Fig. 7). To confirm obtained results, the TUNEL method was used. It has been recorded that exposure to T3 for 24 h has little effect. After 72‐h incubation, the percentage of apoptotic cells was higher in non‐treated cells and in cells exposed to high doses of T3 (Fig. 8).
Figure 7.
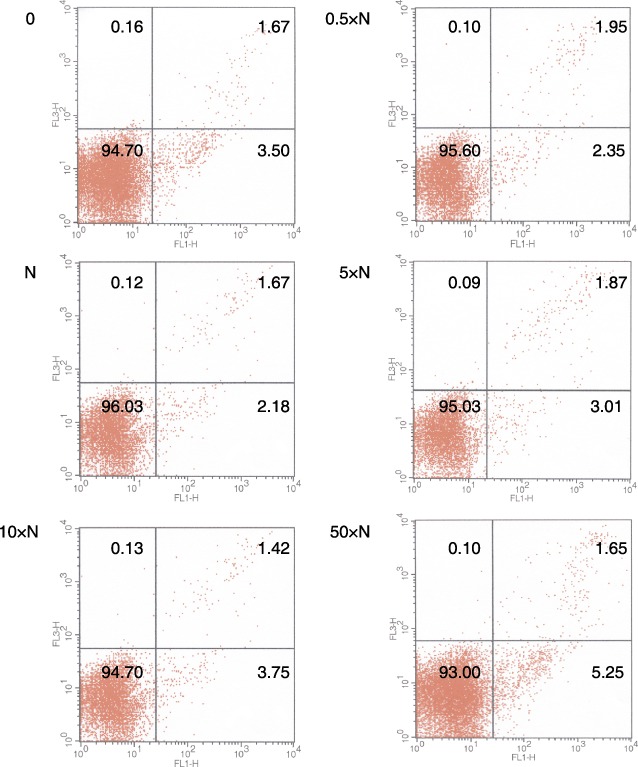
A representative study for the detection of apoptosis after 24‐h incubation of human CB CD34+ positive cells with T3. Cells incubated: 0: without T3; 0.5×N: with a half of physiological dose of T3; N: with a physiological dose of T3; 5×N: with five times higher then physiological dose of T3; 10×N: with 10 times higher then physiological dose of T3; 50×N: with 50 times higher then physiological dose of T3 [FL1‐Annexin V‐FITC, FL3‐PI].
Figure 8.
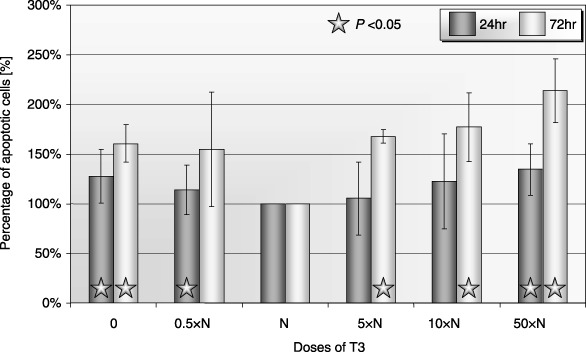
Percentage of apoptotic cells after 24‐ and 72‐h incubation of human CB CD34+ cells with T3 (apoptosis using the TUNEL method). Cells incubated: 0: without T3; 0.5×N: with a half of physiological dose of T3; N: with a physiological dose of T3; 5×N: with five times higher then physiological dose of T3; 10×N: with 10 times higher then physiological dose of T3; 50×N: with 50 times higher then physiological dose of T3.
In the PB cohort, a higher percentage of apoptotic cells was found in the samples incubated without T3 and with the highest doses of the hormone for 24 h. Similar results were obtained for this population after longer incubation (data not shown). Differences that were recorded in the case of BM were similar to those obtained for CB, but the effect was more pronounced (data not shown).
We investigated the expression level of pro‐apoptotic Bax and antiapoptotic Bcl‐x L and Bcl‐2 genes in the examined cells, after 24 and 72 h incubation with different doses of T3, using the RT‐PCR method.9, 10 illustrate the expression of Bax, Bcl‐xL and Bcl‐2 at the mRNA level. We observed higher expression of the Bax gene in these human PB cells after 24‐h incubation without T3. High expression of Bax gene at the mRNA level was also found in CB cells after 72‐h incubation with levels 50 times higher than a physiological dose of T3 (Fig. 9). Prolonged exposure (72 h) caused a decrease in expression of the Bcl‐x L gene in CB cells not exposed to T3 and in PB cells exposed to 50 times higher then physiological dose of T3 (Fig. 10). We also observed decreased expression of the Bcl‐2 gene in cases of CB cells after 24 h incubation in 50 times higher than physiological dose of T3 (data not shown).
Figure 9.
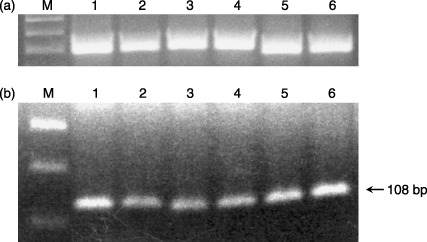
Bax mRNA expression in human CD34+ cells after 24‐ and 72‐h incubation with T3. (a) β‐actin; (b) Bax mRNA expression; line M: molecular weight DNA marker; line 1: human PB CD34+ cells after 24 h incubated without T3; line 2: human PB CD34+ cells after 24 h incubated with a physiological dose of T3; line 3: human PB CD34+ cells after 24 h incubated with 50 times higher then physiological dose of T3; line 4: human CB CD34+ cells after 72 h incubated without T3; line 5: human CB CD34+ cells after 72 h incubated with a physiological dose of T3; line 6: human CB CD34+ cells after 72 h incubated with 50 times higher then physiological dose of T3.
Figure 10.
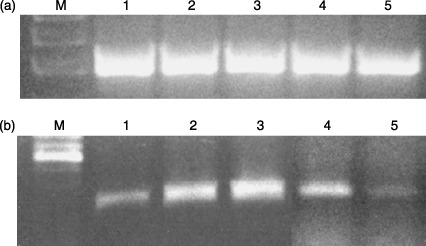
Bcl‐xL mRNA expression in human CD34+ cells after 72‐h incubation with T3. (a) β‐actin; (b) Bcl‐xL mRNA expression; line M: molecular weight DNA marker; line 1: human CB CD34+ cells after 72 h incubated without T3; line 2: human CB CD34+ cells after 72 h incubated with a physiological dose of T3; line 3: human CB CD34+ cells after 72 h incubated with 50 times higher then physiological dose of T3; line 4: human PB CD34+ cells after 72 h incubated with a physiological dose of T3; line 5: human PB CD34+ cells after 72 h incubated with 50 times higher then physiological dose of T3.
DISCUSSION
The understanding that thyroid hormones can directly influence haematopoiesis has led us to investingate presence of the T3 receptor in haematopoietic stem/progenitor cells. The presence of thyroid hormone receptors has been previously documented in cultured mouse BM, particularly in stromal BM cells, and in BM in rats (Gruber et al. 1999; Milne et al. 1999). Moreover, expression of RNA of the TRα1 receptor was recently reported in human PB mononuclear cells (Omazic et al. 2001). In the available literature, there are no data published on the presence of TRs in human‐early haematopoietic cells. Our study has revealed TRα1 and TRβ1 gene expression at the mRNA and protein levels in human haematopoietic stem/progenitor cells.
The effects of altered thyroid hormone status on blood cell indices are well known, but the mechanisms of its behaviour on BM cells are only partially understood. The role of THs on erythropoiesis has been postulated to be indirect and to involve the modulating action of other factors, for example increased production of Epo or haematopoietic factors by nonerythroid cells (Dainiak et al. 1986; Fandrey et al. 1994). However, there is an increased number of pieces of evidence that indicate a direct role of THs in normal human and animal erythroid differentiation (Malgor et al. 1975; Golde et al. 1977; Schroeder et al. 1992; Perrin et al. 1997). Studies on BM‐derived cells have indicated that TH does not displace the requirement for Epo but has a synergistic effect in increasing the number of erythroid colonies (Golde et al. 1977). Perrin et al. have observed that T3 does not alter the cloning efficiency of BFU‐E but decreases the production of colony‐forming erythroid units (CFU‐E) during the course of BFU‐E development. These results were obtained with unfractionated mouse BM cells and human CD34+ BM cells (Perrin et al. 1997). The recent study of Lebeubauer et al. demonstrated, for the erythroid compartment, that steroid hormones play a role in regulating the balance between sustained proliferation and terminal cell differentiation, and that terminal erythroid maturation is significantly improved by adding T3 (Leberbauer et al. 2005).
In our study, we have demonstrated a negative effect of lower as well as higher concentration of T3 in the growth of BFU‐E in methylcellulose cultures. This phenomenon has been observed in the case of CD34+‐enriched cells derived from CB, PB and BM. In addition, we noticed an enhanced negative effect in the case of prolonged exposure (72 h). Our results have indicated that T3 induced erythropoiesis only at physiological concentrations. These findings provide evidence of direct influence of T3 that could regulate development of normal human haematopoietic cells.
Unfortunately, our current knowledge concerning the influence of T3 on clonogenicity of CFU‐GM is very limited. In the available literature, there is only one report on the influence of physiological concentration of T3 on colony growth of human CFU‐GM cells. Notario et al. observed enhancement of colony growth from normal PB CFU‐GM in the presence of T3 or T4 (Notario et al. 1988). In a further study, normal blood concentration of CFU‐C and myeloid differentiation in liquid culture in patients with Graves’ disease were observed (Ponassi et al. 1983). Again no data on clonogenic potential of CD34+ cells in the presence of different non‐physiological concentrations of thyroid hormones were reported in either of these studies. In our experiment, we observed a negative effect of lower as well as higher concentration of T3 on the growth of CFU‐GM in the case of CB and BM, compared to physiological concentrations of the hormone. Only in one case, PB‐derived CD34+ cells, the unexpected increase in the clonogenic CFU‐GM at higher doses of T3 has been observed. Increasing concentration of T3 increases G‐CSF releasing in vitro. Thus, responsiveness of PB CD34+ cells to the G‐CSF stimulation could play an important role in this observed clonogenecity increase of GM‐CFU. One of the explanations of this phenomenon is that PB contains more primitive subpopulations of CFU‐GM (Kriegler et al. 1984) compared to BM. They also differ in cell cycle status (Chikkappa et al. 1982). It is known that granulocyte/macrophage progenitor cells from PB and BM, differ in their response to (for example) prostaglandin E1 (Richman & Johnson 1987). In CB, however, there is high concentration of growth factors and different cytokines, and therefore stem and progenitor cells present in CB are more quiescent (Mavassagh et al. 1997).
Our observations here indicate that T3 induces both myelopoiesis and erythropoiesis only in physiological concentrations. Moreover, non‐physiological concentrations of T3 negatively influence these processes in a direct manner. Our results were obtained with CB‐, PB‐ and BM‐derived CD34+‐enriched cells, suggesting that the effect of T3 was not mediated by accessory cells. It is noteworthy that the T3 action on CD34+‐enriched cells was time‐dependent. The effect was more noticeable after prolonged exposure.
It has been revealed that, among other factors, thyroid hormones are important regulators of apoptosis via receptor‐mediated processes (Thompson 1994; Kucharova & Farkas 2002). It has been shown that the percentage of apoptotic T lymphocytes from patients with Graves’ disease was significantly higher compared with those from normal donors (Mihara et al. 1999). Unfortunately, the mechanism of further transduction of this pro‐apoptotic signal is unclear (Kucharova & Farkas 2002). Moreover, it is well known that thyroid hormones enhanced the rate of apoptosis in early erythrocytic progenitor cells (Gandrillon et al. 1994) and promyeloleukaemic HL‐60 cells (Hara et al. 2000). On the other hand, it has also been recognized that a physiological level of T3 down‐regulates control of apoptosis of early placental extravillous trophoblasts through the inhibition of Fas and Fas ligand expression and caspase‐3 and poly(ADP‐ribose) polymerase (PARP) cleavage (Laoag‐Fernandez et al. 2004).
In our experiment, we have demonstrated that incubation with non‐physiological concentrations of T3 induced the apoptotic process in all cases of CB‐, PB‐ and BM‐derived CD34+‐enriched cells. Our findings suggest that T3 present in non‐physiological doses does not protect haematopoietic cells and therefore plays a significant role in induction of programmed cell death in these CD34+ rich progenitor cells. Unfortunately, the mechanism of induction of apoptosis by T3 has not been elucidated. In some cases it was suggested that during deficiency of thyroid hormone the antiapoptotic genes Bcl‐2 and Bcl‐x L were down‐regulated and the pro‐apoptotic gene Bax was expressed at higher levels compared with the euthyroid state (Mihara et al. 1999; Singh et al. 2003). In our results involved with Bax, Bcl‐2, Bcl‐x L gene expression, the differences seem to agree with previous reports concerning human lymphocytes and cerebral cells (Mihara et al. 1999; Singh et al. 2003).
In conclusion, our study demonstrates for the first time that TH receptors are present in human CB, PB and BM CD34+‐enriched cells. We have also found that exposure to high and low concentrations of thyroid hormone significantly influenced clonogenecity and induced apoptosis in those cells. In this context, further investigation is needed to better reveal molecular bases of the influence of T3 on haematopoiesis. Our studies suggest that thyroid hormone, T3, is one of the factors that may play a role in regulation of cell population growth and the process of apoptosis of human haematopoietic cells. The clarifying of the interactions between T3 and haematopoiesis may have a potential application in the clinic, for endocrinological diseases. It can be useful in compiling new, clinical therapeutic potential.
M B‐M is a scholarship holder of the Foundation for Polish Science.
REFERENCES
- Allain TJ, McGregor AM (1993) Thyroid hormones and bone. J. Endocrinol. 139, 9–18. [DOI] [PubMed] [Google Scholar]
- Arpin C, Pihlgren M, Fraichard A, Aubert D, Samarut J, Chassande O, Marvel J (2000) Effects of T3R alpha 1 and T3R alpha 2 General deletion on T and B lymphocyte development. J. Immunol. 1, 152–160. [DOI] [PubMed] [Google Scholar]
- Axelrod AR, Bergman L (1951) The bone marrow in hyperthyroidism and hypothyroidism. Blood 6, 436–453. [PubMed] [Google Scholar]
- Baas D, Bourbeau D, Sarlieve LL, Ittel ME, Dussault JH, Puymirat J (1997) Oligodendrocyte maturation and progenitor cell proliferation are independently regulated by thyroid hormone. Glia 19, 324–332. [DOI] [PubMed] [Google Scholar]
- Baskiewicz‐Masiuk M, Masiuk M, Machalinski B (2003) The influence of STAT5 antisense oligonucleotides on the proliferation and apoptosis of selected human leukaemic cell lines. Cell Prolif. 36, 265–278. [DOI] [PMC free article] [PubMed] [Google Scholar]
- Chikkappa G, Phillips PG, Brinson P (1982) Differences in the sensitivity of normal peripheral blood and bone marrow granulocytic‐macrophagic and eosinophilic colony forming cells (CFC) to a source of colony stimulating factor. Exp. Hematol. 10, 852–858. [PubMed] [Google Scholar]
- Corrocher R, Querena M, Stanzial AM, De Sandre G (1981) Microcytosis in hyperthyroidism: haematological profile in thyroid disorders. Haematologica 66, 779–786. [PubMed] [Google Scholar]
- Dainiak N, Sutter D, Kreczko S (1986) 1‐triiodothyronine augments erythropoietic growth factor release from peripheral blood and bone marrow leukocytes. Blood 68, 1289–1297. [PubMed] [Google Scholar]
- Fandrey J, Pagel H, Frede S, Wolff M, Jelkmann W (1994) Thyroid hormones enhance hypoxia‐induced erythropoietin production in vitro . Exp. Hematol. 22, 272–277. [PubMed] [Google Scholar]
- Fein HG, Rivlin RS (1975) Anemia in thyroid diseases. Med. Clin. North Am. 59, 1133–1145. [DOI] [PubMed] [Google Scholar]
- Foster MP, Montecino‐Rodriguez E, Dorshkin K (1999) Proliferation of bone marrow pro‐B cells in dependent on stimulation by pituitary/thyroid axis. J. Immunol. 11, 5883–5890. [PubMed] [Google Scholar]
- Gandrillon O, Ferrand N, Michaille JJ, Roze L, Zile MH, Samarut J (1994) c‐erbA alpha/T3R and RARs control commitment of hematopoietic self‐renewing progenitor cells to apoptosis or differentiation and are antagonized by the v‐erbA oncogene. Oncogene 9, 749–758. [PubMed] [Google Scholar]
- Golde DW, Bersch N, Chopra IJ, Cline MJ (1977) Thyroid hormones stimulate erythropoiesis in vitro . Br. J. Haematol. 37, 173–177. [DOI] [PubMed] [Google Scholar]
- Gruber R, Czerwenka K, Wolf F, Ho GM, Willheim M, Peterlik M (1999) Expresion of the vitamin D receptor, of estrogen and thyroid hormone receptor alfa‐ and beta‐isoforms, and of the androgen receptor in cultures of native mouse bone marrow and stromal/osteoblastic cells. Bone 24, 465–473. [DOI] [PubMed] [Google Scholar]
- Hara M, Suzuki S, Mori J, Yamashita K, Kumagai M, Sakuma T, Kakizawa T, Takeda T, Miyamoto T, Ichikawa K, Hashizume K (2000) Thyroid hormone regulation of apoptosis induced by retinoic acid in promyeloluekemic Hl‐60 cells: studies with retinoic acid receptor–specific and retinoid × receptor–specific ligands. Thyroid 10, 1023–1034. [DOI] [PubMed] [Google Scholar]
- Horton L, Coburn RJ, England JM, Himsworth RL (1976) The haematology of hypothyroidism. Q. J. Med. 45, 101–123. [PubMed] [Google Scholar]
- Iskaros J, Pickard M, Evans I, Sinha A, Hardiman P, Ekins R (2000) Thyroid hormone receptor gene expression in first trimester human fetal brain. J. Clin. Endocrinol. Metab. 85, 2620–2623. [DOI] [PubMed] [Google Scholar]
- Kriegler AB, Bradley TR, Hodgson GS (1984) The effect of prostaglandin E1 and E2 on macrophage progenitor cells with high proliferative potential in mouse bone marrow in vitro . Blood 63, 1348–1352. [PubMed] [Google Scholar]
- Kucharova S, Farkas R (2002) Hormone nuclear receptors and their ligands: role in programmed cell death. Endocr. Regul. 36, 37–60. [PubMed] [Google Scholar]
- Laoag‐Fernandez JB, Matsuo H, Murakoshi H, Hamada AL, Tsang BK, Maruo T (2004) 3,5,3′‐Triiodothyronine down‐regulates Fas and Fas ligand expression and suppressed caspase‐3 and poly (adenosine 5′‐diphosphate‐ribose) polymerase cleavage and apoptosis in early placental extravillous trophoblasts in vitro . J. Clin. Endocrinol. Metab. 89, 4069–4077. [DOI] [PubMed] [Google Scholar]
- Leberbauer C, Boulme F, Unfried G, Huber J, Beug H, Mullner EW (2005) Different steroids co‐regulate long‐term expansion versus terminal differentiation in primary human erythroid progenitors. Blood 105, 85–94. [DOI] [PubMed] [Google Scholar]
- Lin HY, Davis FB, Gordinier JK, Martino LJ, Davis PJ (1999) Thyroid hormone induces activation of mitogen‐activated protein kinase in cultured cells. Am. J. Physiol. 276, C1014–C1024. [DOI] [PubMed] [Google Scholar]
- Machalinski B, Szolomicka P, Kijowski J, Baskiewicz M, Karbicka A, Byra E, Majka M, Giedrys‐Kalemba S, Ratajczak MZ (1999) Short‐term storage of human haematopoietic cells. Influence of air and deoxyribonuclease. Ann. Transplant. 4, 29–36. [PubMed] [Google Scholar]
- Majka M, Ratajczak J, Machaliński B, Carter A, Pizzini DW, Wasik MA, Gewirtz AM, Ratajczak MZ (2000) Expression, regulation and function of AC133, a purtative human haematopoietic cells. Folia Histochem. Cytobiol. 38, 53. [PubMed] [Google Scholar]
- Malgor LA, Blanc CC, Klainer E, Irizar SE, Torales PR, Barrios L (1975) Direct effects of thyroid hormones on bone marrow erythroid cells of rats. Blood 45, 671–679. [PubMed] [Google Scholar]
- Mavassagh M, Cailot L, Baillou C, Guiqon M, Lemoine FM (1997) Optimization of the cycling of clonogenic and primitive cord blood progenitors by various growth factors. Stem Cells 15, 214–222. [DOI] [PubMed] [Google Scholar]
- Migliaccio G, Migliaccio AR, Adamson JW (1988) In vitro differentiation of human granulocyte/macrophage and erythroid progenitors: comparative analysis of the influence of recombinant human erythropoietin, G‐CSF, GM‐CSF, and IL‐3 in serum–supplemented and serum‐deprived cultures. Blood 72, 248–256. [PubMed] [Google Scholar]
- Mihara S, Suzuki N, Wakisaka S, Suzuki S, Sekita N, Yamamoto S, Saito N, Hashino T, Sakane T (1999) Effects of thyroid hormones on apoptotic cell death of human lymphocytes. J. Clin. Endocrinol. Metab. 84, 1378–1385. [DOI] [PubMed] [Google Scholar]
- Milne M, Kang MI, Cardona G, Quail JM, Braverman LE, Chin WW, Baran DT (1999) Expression of multiple thyroid hormone receptor isoforms in rat femoral and vertebral bone marrow and in bone marrow osteogenic cultures. J. Cell. Biochem. 74, 684–693. [DOI] [PubMed] [Google Scholar]
- Notario A, Torriani A, Bravi M, Broglia M, Borghi G, Guerra G (1988) The influence of thyroid hormones on colony growth of peripheral CFU‐GM from normal and leukemic subjects. Tumori 74, 507–512. [DOI] [PubMed] [Google Scholar]
- Omazic B, Nasman‐Bjork I, Johansson J, Hentschke P, Mattsson J, Permert J, Lundkvist I (2001) Altered expression of receptors for thyroid hormone and insulin‐like growth factor‐I during reconstitution after allogeneic hematopoietic stem cell transplantation. Bone Marrow Transplant. 27, 1163–1171. [DOI] [PubMed] [Google Scholar]
- Oppenheimer JH (1999) Evolving concepts of thyroid hormone action. Biochimie 81, 539–543. [DOI] [PubMed] [Google Scholar]
- Oppenheimer JH, Schwartz HL (1997) Molecular basis of thyroid hormone‐dependent brain development. Endocr. Rev. 18, 462–475. [DOI] [PubMed] [Google Scholar]
- Perlman JA, Sternthal PM (1983) Effect of 131I on the anemia of hyperthyroidism. J. Chronic. Dis. 36, 405–412. [DOI] [PubMed] [Google Scholar]
- Perrin MC, Blanchet JP, Mouchiroud G (1997) Modulation of human and mouse erythropoiesis by thyroid hormone and retinoic acid: evidence for specific effects at different steps of the erythroid pathway. Hematol. Cell Ther. 39, 19–26. [DOI] [PubMed] [Google Scholar]
- Ponassi A, Morra L, Caristo G, Parodi GB, Biassoni P, Sacchetti C (1983) Disorders of granulopoiesis in patients with untreated Graves’ disease. Acta Haematol. 70, 19–23. [DOI] [PubMed] [Google Scholar]
- Ratajczak MZ, Luger SM, Deriel K, Abrahm J, Calabretta B, Gewirtz AM (1992) Role of the KIT protooncogene in normal and malignant human hematopoiesis. Proc. Natl. Acad. Sci. USA 89, 1710–1714. [DOI] [PMC free article] [PubMed] [Google Scholar]
- Richman CM, Johnson GD (1987) Granulocyte/macrophage progenitor cells from peripheral blood and bone marrow differ in their response to prostaglandin E1. Blood 70, 1792–1796. [PubMed] [Google Scholar]
- Schroeder C, Gibson L, Zenke M, Beug H (1992) Modulation of normal erythroid differentiation by the endogenous thyroid hormone and retinoic acid receptors: a possible target for v‐erbA oncogene action. Oncogene 7, 217–227. [PubMed] [Google Scholar]
- Singh R, Upadhyay G, Kumar S, Kapoor A, Kumar A, Tiwari M, Godbole MM (2003) Hypothyroidism alters the expression of Bcl‐2 family genes to induce enhanced apoptosis in the developing cerebellum. J. Endocrinol. 176, 39–46. [DOI] [PubMed] [Google Scholar]
- Thompson EB (1994) Apoptosis and steroid hormones. Mol. Endocrinol. 8, 665–673. [DOI] [PubMed] [Google Scholar]
- Varga F, Rumpler M, Luegmayr E, Fratzl‐Zelman N, Glantschnig H, Klaushofer K (1997) Triiodothyronine, a regulator of osteoblastic differentiation: depression of histone H4 attenuation of c‐fos/c‐jun, and induction of osteocalcin expression. Calcif. Tissue Int. 61, 404–411. [DOI] [PubMed] [Google Scholar]
- Wu Y, Koenig RJ (2000) Gene regulation by thyroid hormone. Trends Endocrinol. Metab. 11, 207–211. [DOI] [PubMed] [Google Scholar]
- Yen PM (2001) Physiological and molecular basis of thyroid hormone action. Physiol. Rev. 81, 1097–1142. [DOI] [PubMed] [Google Scholar]


