Abstract
Objectives: The aim of this study was to investigate anti‐leukaemic potential of coronopilin, a sesquiterpene lactone from Ambrosia arborescens, and to characterize mechanism(s) underlying its activity.
Materials and methods: The study was conducted on Jurkat and U937, two leukaemia‐derived cell lines. Apoptosis and impairment of cell cycle progression were evaluated by flow cytometry and by microscopic analysis. Changes in protein expression and activation were evaluated by western blot analysis. Coronopilin‐tubulin covalent adducts were demonstrated by mass spectrometry.
Results: Coronopilin inhibited (IC50 ≤ 20 μm) leukaemia cell population growth, but displayed poor cytotoxicity to normal white blood cells. On Jurkat cells, coronopilin exerted cell population growth inhibition activity, mainly by triggering caspase‐dependent apoptosis. Conversely, in U937 cells, coronopilin’s primary response was a robust arrest in G2/M. Marked increase in mitotic index and presence of activated cyclin B1/Cdk1 complex, phosphorylated histone H3 at Ser10, and hyperpolymerized tubulin indicated that cells accumulated in mitosis. Prolonged mitotic arrest ultimately resulted in U937 mitotic catastrophe, and dying cells exhibited the features of non‐caspase‐dependent death.
Conclusions: This study demonstrated that coronopilin efficiently inhibited leukaemia cell population growth by triggering cell type‐specific responses. Moreover, coronopilin‐mediated cell population expansion inhibition was specific to neoplastic cells, as normal white blood cell viability was not significantly affected. Thus, coronopilin may represent an interesting new chemical scaffold upon which to develop new anti‐leukaemic agents.
Introduction
Medicinal plants are extremely important in drug discovery for treatment of human diseases, and their secondary metabolites have proven to be a reliable source of new and effective anticancer agents. Small molecules are generally more stable and free from contaminants of chemical and biological origin, and may offer a number of advantages over general biotherapeutics and more opportunity for delivery (1).
Sesquiterpene lactones compose a large group of natural products, and often are the active components of great numbers of traditional medicinal plants. Sesquiterpene lactones have been shown to possess a wide range of biological activities, including anti‐tumour properties (2, 3); these have been linked mainly to presence of an α,β‐unsaturated carbonyl group, which, acting as Michael acceptor, may affect proteins controlling cell cycle progression and survival of tumour cells (4, 5). Despite presence of this reactive group, sesquiterpene lactones display different anti‐tumour potency depending on other structural factors, including side chain lipophilicity and molecular geometry (6, 7). Structure/activity studies have shown that, among sesquiterpene lactones, those possessing a guaianolide and/or a pseudoguaianolide skeleton are the most active (8).
In earlier chemical investigations (9, 10), we have isolated several pseudoguaianolide sesquiterpene lactones from Ambrosia arborescens Mill (Asteraceae), an aromatic plant growing in western South America, where it is used traditionally to discourage insects (11). Coronopilin, one of the pseudoguanianolides, is a major constituent of plant leaves, that has been shown to inhibit proliferation of cells from certain lines, including those leukaemia‐derived (9, 10); however, mechanism(s) underlying its activity still remain unexplored.
Despite various treatment strategies up to now developed, leukaemia is the most common haematological malignant disease, often with unfavourable prognosis, because of high risk of relapse (12, 13). Due to the need for new agents to use alone or in combination with current chemotherapeutics to counteract these malignancies, we have aimed to investigate thoroughly anti‐tumour potential of coronopilin, on Jurkat cells, a leukaemic T‐cell line, and U937 cells, a monocytic cell line from histiocytic lymphoma. In particular, we analysed effects of coronopilin on cell cycle progression, cell death (apoptosis or necrosis), and we explored underlying molecular mechanisms. Moreover, we also evaluated cytotoxic/cytostatic potential of coronopilin on normal white blood cells.
Materials and methods
Reagents and antibodies
Foetal bovine serum (FBS) and KaryoMAX giemsa stain stock solution were from GIBCO, (Life Technologies, Grand Island, NY, USA) Hoechst 33342 was from Invitrogen (Life Technologies, Grand Island, NY, USA) and Z‐VAD‐fmk (Z‐VAD) was from BD Pharmigen (Franklin Lakes, NJ, USA). All other reagents were from Sigma‐Aldrich (St. Louis, MO, USA). Antibodies such as anti‐Hsp60 (mouse monoclonal, sc‐13115), anti‐histone H1 (mouse monoclonal, sc‐8030), anti‐GAPDH (mouse monoclonal, sc‐32233), anti‐cdc2 (mouse monoclonal, sc‐8395), anti‐phospho‐cdc2 (Thr161) (rabbit polyclonal, sc‐101654), anti‐α tubulin (mouse monoclonal, sc‐32293), anti‐cytochrome c (rabbit polyclonal, sc‐7159), anti‐PARP1 (mouse monoclonal, sc‐8007) and anti‐β‐actin (mouse monoclonal, sc‐47778) were obtained from Santa Cruz Biotechnology (Santa Cruz, CA, USA). Anti‐cleaved caspase‐3 (Asp175) (rabbit polyclonal, 9661), anti‐caspase‐3 (rabbit polyclonal, 9662), anti‐phospho‐histone H3 (Ser10) (mouse monoclonal, 9706), anti‐cyclin B1 (mouse monoclonal, 4135), anti‐phospho‐histone H2AX (Ser139) (rabbit monoclonal, 9718) and anti‐Aurora B/AIM 1 (rabbit polyclonal, 3094) were from Cell Signaling Technology (Danvers, MA, USA); appropriate peroxidase‐conjugated secondary antibodies were from Jackson ImmunoResearch (Baltimore, PA, USA). Coronopilin and dihydrocoronopilin (Fig. 1 ) were isolated and identified as previously reported (9).
Figure 1.
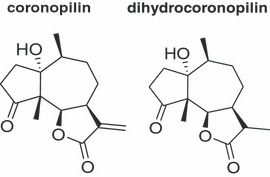
Structures of coronopilin and dihydrocoronopilin.
Cells and treatments
Jurkat and U937 cells, obtained from Cell Bank in GMP‐IST (Genova, Italy), were maintained in RPMI 1640 medium supplemented with 10% (v/v) FBS, 2 mm L‐glutamine and antibiotics at 37 °C in humidified atmosphere with 5% CO2. To ensure logarithmic growth, cells were sub‐cultured every 2 days. All experiments were performed using cells seeded at 2 × 10⁵ cells/ml. Under given experimental conditions, untreated leukaemia cells were able to double in number in <24 h.
Human peripheral blood mononuclear cells (PBMC) were isolated from buffy coat of healthy donors (kindly provided by the Blood Center of the Hospital of Battipaglia, Salerno, Italy) by using standard Ficoll–Hypaque gradients. Freshly isolated PBMC contained 91.6 ± 2.8% live cells, as assessed manually by trypan blue exclusion. Resting PBMC and PBMC induced to proliferate by phytohemagglutinin (PHA) (10 μg/ml) were used to evaluate coronopilin cytotoxic and cytostatic effects, respectively. Stock solutions (76 mm) of purified coronopilin and dihydrocoronopilin in DMSO, were stored in the dark at 4 °C. Working solutions were prepared in culture medium immediately prior to use; final concentration of DMSO, never exceeding 0.15% (v/v), was equal in samples and controls.
Analysis of cell proliferation and viability
Cells were seeded in 96 well‐plates at 1 × 10⁴ cells per well and were incubated for 24 h and 48 h, in absence of and in presence of different concentrations of coronopilin. Numbers of viable cells were quantified using the MTT ([3‐(4,5‐dimethyldiazol‐2‐yl)‐2,5‐diphenyl tetrazolium bromide]) assay. Absorption at 550 nm for each well was assessed by microplate reader ((LabSystems, Vienna, VA, USA)). To exclude any interference of coronopilin with the tetrazolium salt‐based assay, cell population growth inhibition was also randomly verified by cytometric counting (trypan blue exclusion). IC50 values were calculated from cell viability dose–response curves and defined as the concentration resulting in 50% inhibition of cell survival compared to untreated cells.
Cell cycle distribution and cell death analysis by flow cytometry
Cell cycle and hypodiploidia. Cell DNA content was evaluated using propidium iodide (PI) staining of permeabilized cells, according to the available protocol (14) and data from 10 000–20 000 events per sample were collected. Percentages of elements in hypodiploid regions were calculated using CellQuest (Becton Dickinson, San José, CA) software and those in G0/G1, S and G2/M phases were determined using MODFIT software (Becton Dickinson).
Detection of apoptosis. Percentage of cells actively undergoing apoptosis was determined using Human Annexin V/FITC kit (Bender MedSystems, Vienna, Austria) according to the manufacturer’s instructions. Annexin V binds to those cells (apoptotic cells) expressing phosphatidylserine on the outer layer of their plasma membranes, while PI stains DNA of those that have compromised cell membranes. Green and red fluorescence of individual cells was measured by flow cytometry. Electronic compensation was required to exclude overlapping of the two emission spectra.
Mitochondrial membrane potential changes
Changes in mitochondrial membrane potential (ΔΨm) were monitored using mitochondrial membrane potential‐driven uptake of fluorescent tetramethylrhodamine ethyl ester (5 nm, final concentration) and flow cytometry (FL‐2 channel).
Microscopic analysis
Analysis of nuclei. Hoechst 33342 (10 μg/ml) staining was used for detection of apoptotic nuclei. Cells were analysed on a Zeiss Axiovert 200 microscope (Zeiss, Oberkochen, Germany) using ×40 objective lens (excitation, 351 nm; emission, 380 nm) and images were acquired from randomly selected fields.
Cytological characterization of cells undergoing mitotic catastrophe. To visualize metaphases in control and coronopilin‐treated U937 cells, colcemid (0.2 μg/ml) was added to them and left for the last 2 h of incubation. Cells were then centrifuged at 315 g for 10 min, culture media were discarded and harvested cells were treated with pre‐warmed hypotonic solution (75 mm KCl) for 20 min; then they were fixed in cold methanol/acetic acid (3:1) for further 20 min. Cells were washed then in cold fixative, dropped on to slides, stained with 5% Giemsa solution and analysed under a light microscope (Zeiss) at total 1000× magnification. Mitotic index was evaluated as percentage of metaphase cells per 1000 nuclei analysed at randomly on blindly coded slides (15).
Western blot analysis
Whole lysates for immunoblotting analysis were prepared according to standard protocols. Cytosolic protein extracts for determining cytochrome c were prepared as described previously (16). Briefly, cells were gently lysed for 2 min in ice‐cold lysis buffer containing 0.05% digitonin. Clarified whole lysates or cytosolic proteins were fractionated on SDS‐PAGE (20–50 μg/lane) under reducing conditions. Protein concentration in samples was determined by Bio‐Rad (Berkeley, CA, USA) DC Protein Assay. Percentage of polyacrylamide was chosen based on molecular weight of protein to be detected. Proteins were transferred to nitrocellulose membranes and these were blocked for 1 h in blocking buffer (50 mm Tris, 200 mm NaCl, 0.1% Tween 20, 10% (w/v) non‐fat dried milk) before being incubated at 4 °C overnight with the desired primary antibody. Reactive protein bands were visualized with appropriate horseradish peroxidase‐conjugated secondary antibodies with enhanced chemiluminescence (Amersham, Biosciences‐GE Healthcare, NY, USA). When indicated, blots were stripped according to the manufacturer’s procedure (Amersham Product Booklet) and re‐probed with new primary antibody.
LC‐MS analysis
Coronopilin and tubulin (1:1 molar ratio) were incubated in PBS (0.1 m 1% DMSO) for 2 h at 37 °C. Aliquots of reaction mixture were dissolved in 1% aqueous formic acid and chromatographed over a GELoader tip column with C18 as stationary phase (POROS R2). Then, samples were washed with 1% aqueous formic acid and directly eluted over MALDI sample plate. MALDI/MS analysis was performed on a MALDI‐TOF MX micro (Waters, Milford, MA, USA) instrument by using a solution of sinapinic acid in H2O/CH3CN 1:1 as ionization matrix. Mass spectra were acquired over m/z range 15 000–60 000 Thomson. Mass data were elaborated using Masslynx software (Waters).
Extraction of monomeric and polymeric tubulin
Analysis of monomeric and polymeric tubulin was performed as described previously (17). Briefly, control and coronopilin‐treated cells were washed twice in PBS and lysed for 10 min at 4 °C in lysis buffer added to protease and phosphatase inhibitor cocktails (Sigma‐Aldrich). After centrifugation at 15 000 g for 10 min at 4 °C, supernatants, containing monomeric tubulin, were collected separately (soluble fraction), whereas pellets (insoluble fraction), containing polymerized tubulin, were re‐dissolved in SDS buffer (4% SDS, 20% glycerol, 10% 2‐mercaptoethanol, 0.004% bromophenol blue, and 0.125 m Tris HCl, pH 6.8). Soluble and insoluble fractions were subjected to electrophoresis on 10% SDS‐PAGE and relative amounts of monomeric and polymeric tubulin were measured by immunoblotting with anti‐human α‐tubulin antibody.
Statistical analysis
Data reported in each figure are mean values ± SD of at least three experiments, performed in duplicate, showing similar results. Differences between treatment groups were analysed by Student’s t‐test. Differences were considered significant when P < 0.05.
Results
Effect of coronopilin on leukaemia cell viability
Effects of coronopilin and dihydrocoronopilin, a coronopilin structural analogue lacking the α,β‐unsaturated carbonyl group (Fig. 1), were evaluated on leukaemia cell population expansion. Jurkat and U937 cells were exposed to different concentrations of compounds and, after 24 h and 48 h incubation, cell viability was measured by MTT assay. Half maximal inhibitory concentration (IC50) values (Table 1) were calculated from dose–response curves. Coronopilin IC50 values resulted, in both Jurkat and U937 cells, several fold lower than those of dihydrocoronopilin, thus confirming a major role of the α,β‐unsaturated carbonyl group, in coronopilin cell population growth inhibition activity. At 24 h, no significant changes between the two cell lines were observed, whereas at 48 h, IC50 value of Jurkat cells reduced to approximately one half of U937.
Table 1.
IC50 values (μm) for inhibition of leukaemia cell growth by tested lactones. Data represent the mean values ± SD of three experiments performed in quintuplicate
| Compound | Jurkat | U937 | ||
|---|---|---|---|---|
| 24 h | 48 h | 24 h | 48 h | |
| Coronopilin | 16 ± 0.8 | 5 ± 0.2 | 19.3 ± 1.1 | 11 ± 0.32 |
| Dihydrocoronopilin | >100 | >80 | >100 | >100 |
Coronopilin inhibited leukaemia cell population expansion by inducing cell cycle arrest and cell death
To discriminate between cytotoxic and cytostatic effects, we measured DNA content in Jurkat and U937 cells incubated for 24 and 48 h, with 15 μm and 20 μm coronopilin respectively. These concentrations, chosen for their proximity to IC50 values of each cell line, were used in all subsequent experiments. Data summarized in Fig. 2 indicate that coronopilin triggered different responses depending on cell type. In Jurkat cells, the most prominent response to coronopilin treatment was sustained and time‐dependent increase of cells with subG0/G1 DNA content, indicative of apoptotic cell death. Conversely, in U937 cells, coronopilin induced robust G2/M block without any significant increase, at least in the first 24 h, of hypodiploid cells (representative histograms on the right). Cytostatic rather than cytotoxic (apoptotic or necrotic) effects of coronopilin in U937 at 24 h were confirmed by trypan blue exclusion analysis (data not shown). Deeper characterization of cell death and G2/M arrest induced by coronopilin in Jurkat and U937 cells respectively is detailed below.
Figure 2.
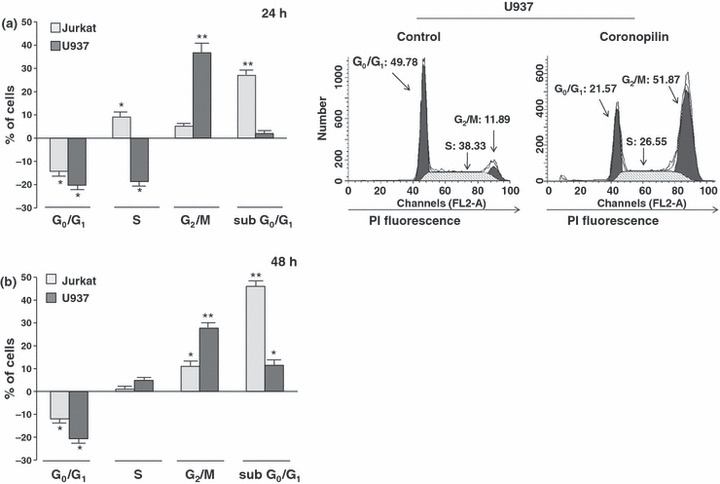
Effect of coronopilin on proliferation of leukaemia cells. Flow cytometric evaluation of DNA content in coronopilin‐treated leukaemia cells. (a) Jurkat and U937 cells were exposed to vehicle alone or to 15 μm and 20 μm coronopilin for 24 h, and nuclei were stained with PI. Data are presented as increase/decrease in percentages of treated cells with a specific DNA content, in respect to control values (Jurkat control cells: subG0/G1, ≤2%; G0/G1, 52 ± 2.4%; S, 38.9 ± 1.7%; G2/M, 9.9 ± 0.7 %; U937 control cells: subG0/G1 ≤ 2%; G0/G1, 48.7 ± 2%; S, 40 ± 2%; G2/M, 12 ± 1.1%). Representative histograms of control and coronopilin‐treated U937 cell cycles are on the right. (b) Same experiment as in (a), but results collected 48 h after treatment (percentages of control cells with specific DNA content were similar to those measured after 24 h incubation). All results are mean values ± SD from at least three experiments performed in duplicate (*P < 0.05, **P < 0.001).
Coronopilin’s cytotoxic and cytostatic potential were also evaluated on freshly isolated resting and PHA‐stimulated proliferating PBMC, taken to be the normal cell counterpart. Remarkably, by means of trypan blue count, we found that 20 μm coronopilin, a dose cytoxic to Jurkat cells, was not cytotoxic to freshly isolated resting PBMC. Percentages of non‐viable cells after 24 h following coronopilin addition (about 14 ± 2.3%) were similar to control values (13 ± 2.1%). Coronopilin (20 μm) did not exhibit any pro‐death activity either in PHA‐stimulated proliferating PBMC, up to 72 h treatment (Fig. 3a). Levels of hypodiploidia/necrosis in treated‐PBMC were, indeed, comparable to those of controls. However, coronopilin displayed some cytostatic effects to normal white blood cells induced to proliferate by PHA. Representative histograms in Fig. 3b show that after 72 h culture, in the region of 25% and 10% of PHA‐stimulated control PBMC were in S and G2/M respectively, while most treated cells remained blocked in G0/G1.
Figure 3.
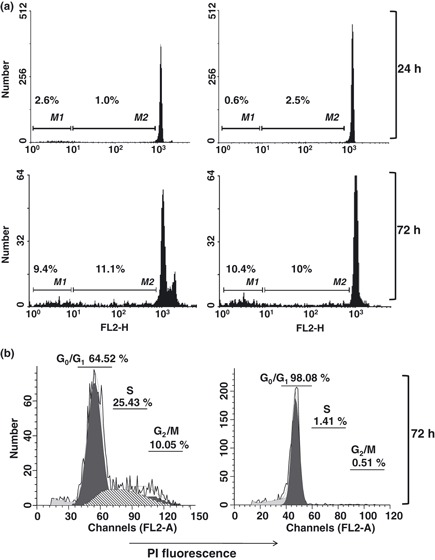
Effect of coronopilin on PBMC viability and proliferation. PHA‐stimulated PBMC were incubated with vehicle only (Control) or 20 μm coronopilin, for times indicated. PI‐stained nuclei were analysed by flow cytometry. (a) Quantification of hypodiploid cells (M2 region) and necrotic cells (M1 region). (b) Cell cycle distribution. All histograms reported are representative of experiments performed in duplicate, with three different PBMC preparations giving qualitatively similar results.
Characterization of coronopilin cell death‐promoting activity in Jurkat cells
Early cytotoxic response to coronopilin in Jurkat cells was accompanied by changes in nuclear morphology, typical of apoptotic cell death (Fig. 4a). Hypercondensed chromatin and apoptotic bodies were largely present 20 h after coronopilin addition, while control cells had round and homogeneous nuclei.
Figure 4.
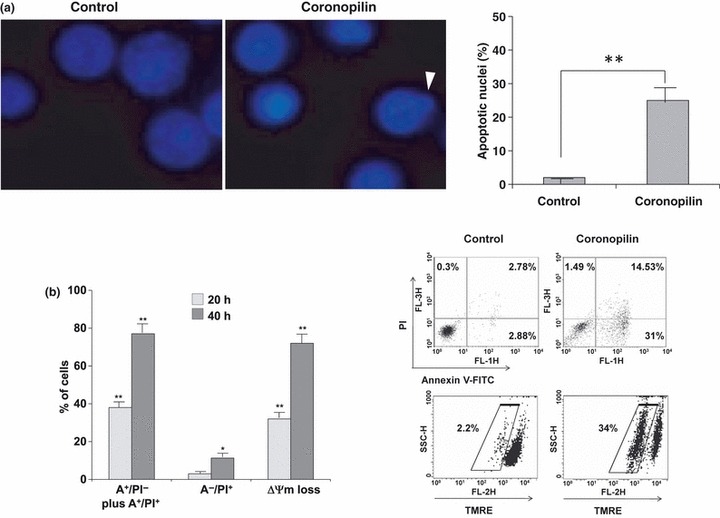
Coronopilin‐induced apoptosis in Jurkat cells. (a) Fluorescence microscopy for apoptotic nuclei. Left panel: hypercondensed chromatin and apoptotic bodies (arrowhead) in Jurkat cells incubated with 15 μm coronopilin for 20 h; right panel: percentage of apoptotic nuclei based on counting approximately 100 cells. Results indicated as mean ± SD of two independent experiments (*P < 0.05, **P < 0.001 versus control). (b) Flow cytometric evaluation of phosphatidylserine externalization and mitochondria depolarization. Jurkat cells, incubated with vehicle only or 15 μm coronopilin for 20 h and 40 h, were double‐stained with annexin V‐FITC (A) and PI to discriminate between apoptosis (cells gated ‐ lower right, A+/PI−, and upper quadrant, A+/PI+) and primary necrosis (cells gated – upper left quadrant, A−/ PI+). Loss of mitochondrial membrane potential (ΔΨm) was determined by staining cells with the potential sensitive probe tetramethylrhodamine ethyl ester. Left panel: mean values ± SD from at least three experiments performed in duplicate. Data reported are subtracted for corresponding percentages of control cells; right panel: representative cytograms of control, and cells exposed to coronopilin for 20 h.
To corroborate cell morphology‐based observations, we monitored phosphatidylserine externalization (annexin V‐staining positive cells, A+), a hallmark of apoptosis, in Jurkat cells exposed to coronopilin for 20 h and 40 h (Fig. 4b). Coronopilin induced marked and time‐dependent increase in numbers of apoptotic cells (A+/PI− plus A+/PI+), without signs, at least in the first 20 h treatment, of primary necrosis (A−/PI+). Figure 4b shows also that coronopilin treatment caused significant changes in mitochondrial membrane potential ‐ early or secondary events in the apoptotic‐signalling pathway (18).
Caspase pathways mediating coronopilin‐induced apoptotic death in Jurkat cells
The contribution of caspase pathways to coronopilin‐induced apoptosis and mitochondrial dysfunction in Jurkat cells was first investigated by means of Z‐VAD, a pan‐caspase inhibitor. Cells were pre‐incubated for 2 h with Z‐VAD before addition of coronopilin and then incubated for 20 h and 40 h. Data summarized in Fig. 5a show that Z‐VAD pre‐treatment strongly reduced, even if not ablated, coronopilin‐induced apoptosis at 20 h (A+/PI− and A+/PI+ cells) and concomitantly caused a shift towards primary necrosis (A−/PI+ cells). Contribution of Z‐VAD‐inhibitable components to coronopilin‐induced apoptosis became less marked at 40 h. Caspase inhibition by Z‐VAD also prevented coronopilin‐induced ΔΨm loss, but less efficiently than phosphatidylserine exposure, suggesting that caspase pathways were activated downstream of mitochondria. Accordingly, Fig. 5b shows that Z‐VAD failed to prevent mitochondrial membrane permeabilization and subsequent cytochrome c release into the cytosol; cytochrome c is an apoptogenic factor known to promote caspase‐3/caspase‐9 pathway activation (18).
Figure 5.
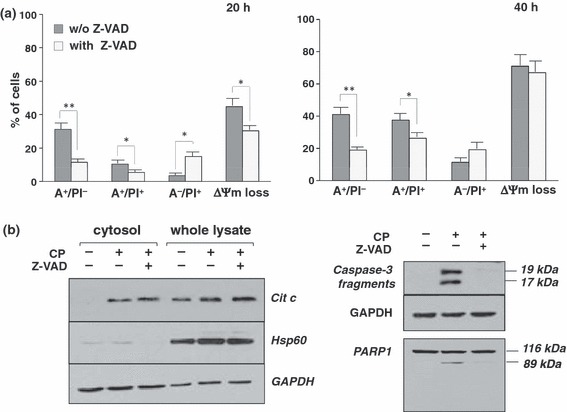
Role of caspases in coronopilin‐induced cell death in Jurkat cells. (a) Jurkat cells were incubated with 15 μm coronopilin ± Z‐VAD (20 μm) for indicated times. For details and abbreviations, see legend to Fig. 3b. Results are means ± SD of at least three experiments performed in duplicate (*P < 0.05 and **P < 0.001 versus samples without Z‐VAD). (b) Western blot analyses of indicated proteins. Whole lysates and cytosolic fractions were from Jurkat cells incubated with vehicle alone or 15 μm coronopilin (CP) ± Z‐VAD for 16 h (left panel: cytochrome c release) or for 20 h (right panel: caspase‐3 and PARP1 processing); filters re‐probed with anti‐HSP60 antibody to monitor the purity of cytosolic fractions and with anti‐GAPDH antibody, to check protein loading.
Inhibition of coronopilin‐induced apoptosis by Z‐VAD was not per se sufficient to unequivocally assess caspase pathway involvement, as Z‐VAD may inhibit proteases other than caspases (19). Thus, we directly evaluated activation of caspase‐3, an effector caspase, on coronopilin‐treated Jurkat cells (Fig. 5b). Caspase‐3 proteolytic fragments (19 and 17 kDa) were clearly detectable in coronopilin‐treated Jurkat cells, but not in controls. Caspase‐3 activation was also confirmed by proteolytic cleavage of its substrate PARP1, to produce 89 kDa inactive derivative. Absence of PARP1 fragments with molecular weight lower than 89 kDa (20) confirmed that coronopilin did not activate, at least within the first 24 h, necrotic events. As expected, both caspase‐3 and PARP1 processing were almost completely inhibited by Z‐VAD.
Coronopilin induced U937 cells to arrest in mitosis
G2/M arrest was shown to largely contribute to reduction in cell number observed in coronopilin‐treated U937 cells after 24 h incubation (Fig. 2). As flow cytometric analysis of DNA content does not allow us to distinguish between G2 and M arrest, further experiments were carried out to establish in which precise cell cycle phase U937 cells accumulated.
By Giemsa dye staining, we evaluated mitotic index of U937 cells exposed to coronopilin for 20 h (Fig. 6a). Results clearly showed significant increase in numbers of mitoses after coronopilin treatment (from 6.67% to 18.05%) indicating specific arrest in M phase. In addition, nuclear morphology analysis indicated presence of cells with nuclear fragmentation. Taken together, these data suggested that U937 cells underwent so called “mitotic catastrophe” (21).
Figure 6.
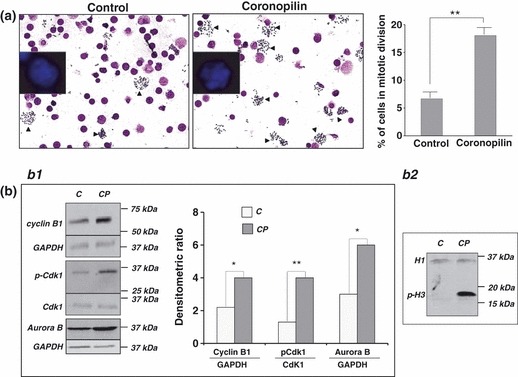
Coronopilin‐induced mitotic arrest in U937 cells. (a) Morphological analysis after Giemsa and Hoechst (insert) staining of U937 cells treated with vehicle alone or 20 μm coronopilin for 20 h. In the images, a reduced number of nuclei and an increased number of metaphase spreads (arrowheads) are evident in coronopilin‐treated cells compared with the control. The percentage of mitotic cells based on counting approximately 1000 cells is reported on the right. Results are shown as mean ± SD of three independent experiments (**P < 0.001 versus control). (b) Western blot analysis of cell cycle regulatory proteins in control (C) and coronopiln (CP)‐treated U937 cells. CP treatment was as in (a) Panel b1. Cyclin B1, Cdk1 and its phosphorylated form at Thr161 (p‐Cdk1), and aurora B; data from three experiments normalized by means ± SD of densitometric ratios (*P < 0.05, **P < 0.001 versus control). Panel b2. Histone H3 phosphorylation at Ser10 (p‐H3); histone H1 included to assess equal protein loading.
To characterize cytological observations at a molecular level, we monitored expression and/or activity of M phase progression key proteins in coronopilin‐treated U937 cells (Fig. 6b). Activation status of cyclin B1/Cdk1 complex was clearly indicated by phosphorylation of Cdk1 protein at Thr161 (22). In addition, coronopilin‐treated U937 cells displayed sustained aurora B‐catalysed phosphorylation of histone H3 at Ser10, a hallmark of mitotic chromosomes (23, 24, 25). Moreover, cyclin B1 and aurora B protein levels were moderately increased by coronopilin.
Coronopilin‐induced mitotic arrest in U937 cells was followed by caspase‐independent apoptosis
To investigate molecular mechanisms underlying cell death following mitotic arrest, U937 cells were exposed to coronopilin for 48 h and then double‐stained with annexin V‐FITC/PI. Data in Fig. 7a show that coronopilin caused marked increase in phosphatidylserine exposing cells (A+/PI− and A+/PI+ cells). Total annexin V‐staining positive cells was higher than percentages of hypodiploid cells at 48 h (about 15%, Fig. 2b). One possible explanation may be that some mitotically arrested apoptotic cells, having subG2/M DNA content, had been integrated in FACS analysis as S or G0/G1 peaks. This hypothesis could also explain reduction of cells in G2/M at 48 h, concomitant with their increase in S and G0/G1 (Fig. 2b).
Figure 7.
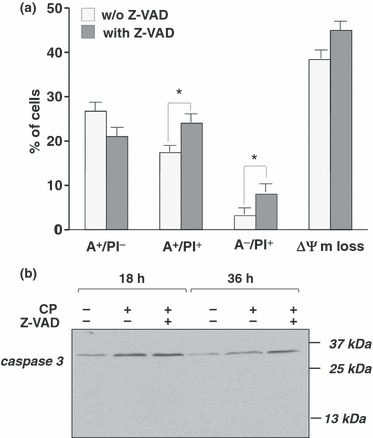
Coronopilin‐induced mitotic block in U937 cells is followed by caspase‐independent apoptotic death. (a) U937 cells incubated with vehicle only or 20 μm coronopilin ± Z‐VAD (20 μm) for 48 h. For details and abbreviations, see legend to Fig. 3b; results are means ± SD of at least three experiments performed in duplicate (*P < 0.05 versus samples without Z‐VAD). (b) Western blot analysis of caspase‐3 cleavage in U937 cells treated with 20 μm coronopilin (CP) ± Z‐VAD for indicated times.
Z‐VAD pre‐treatment did not prevent mitotic‐delayed apoptotic death induced by coronopilin; rather, it caused a further shift towards necrosis and worsened mitochondrial depolarization (Fig. 7a). Relating to caspase‐independent mechanisms of cell death, we did not observe caspase‐3 proteolytic activation in coronopilin‐tretated U937 cells (Fig. 7b).
Coronopilin‐tubulin interaction in cellular and cell‐free systems
Significant mitotic arrest in U937s prompted us to investigate whether coronopilin affected microtubule dynamics. Cells were exposed to coronopilin for 20 h and polymeric and monomeric tubulins were separately extracted, thanks to their differential solubility in non‐ionic detergents. Blots, reported in Fig. 8a, demonstrated that in coronopilin‐treated cells, polymeric/monomeric tubulin ratio was largely higher (0.73) than in controls (0.1). Interaction of coronopilin with tubulin protein was investigated by MALDI‐TOF/MS and the mass spectrum showed a peak at m/z 50 679, generated by addition product of 4 molecules of coronopilin to tubulin (theoretical mass increase 1056 Da) (supplementary Fig. S1).
Figure 8.
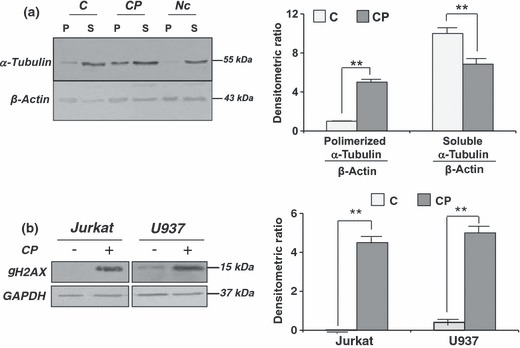
Coronopilin‐induced tubulin hyperpolymerization and DNA damage. (a) U937 treated with vehicle only (C) or 20 μm coronopilin (CP) for 20 h were analysed by Western blot analysis for levels of polymerized (P) and soluble (S) tubulin; cells exposed to 2 μm nocodazole (Nc) were included as control; β‐actin was used for normalization; data from four experiments normalized by means ± SD of densitometric ratios (**P < 0.001 versus control). (b) Whole lysates from U937 and Jurkat cells, treated with 20 μm and 15 μm coronopilin respectively for 12 h, were analysed by Western blot analysis for levels of γH2AX; GAPDH used for normalization; data from three experiments normalized by means ± SD of densitometric ratios (**P < 0.001 versus control).
Coronopilin‐induced DNA damage
The findings that coronopilin impaired tubulin functions in cells, and bound (probably through a Michael addition (4)) nucleophilic groups of the protein suggested that cell DNA, which contains several nucleophylic sites, might be a further target of coronopilin. To verify this possibility, we monitored levels of histone H2AX phosphorylation at Ser139 (γH2AX), a hallmark of damaged DNA (26), in coronopilin‐treated leukaemia cells. As shown in Fig. 8b, γH2AX signal was absent or very weak in control Jurkat and U937 cells. Levels of γH2AX were, however, markedly increased in both cell lines already 12 h after coronopilin addition. Thus, DNA damage could be quite an early common effect of coronopilin in Jurkat and U937 cells.
Discussion
In the present study, we have demonstrated the ability of the sesquiterpene lactone coronopilin to inhibit, with comparable potency, population expansion growth of two leukaemia‐derived cell lines, by activating signals which, depending on the cell type, primarily promoted either cell death or mitotic arrest. These activities could be linked to presence of α,β‐unsaturated carbonyl group; structural coronopilin analogue, dihydrocoronopilin, lacking this group, failed to inhibit leukaemia cell population growth.
Extensive apoptotic death was the most prominent and primary response to coronopilin in Jurkat cells. Coronopilin‐induced apoptosis was largely mediated by caspase pathways, as demonstrated by proteolytic activation of effector caspase‐3 and the protective effect of Z‐VAD, a pan caspase inhibitor. Marked loss of mitochondrial membrane potential (ΔΨm) and release of cytochrome c, indicated that mitochondria play a central role in coronopilin‐triggered apoptotic processes (27). Upon release into the cytosol, mitochondrial cytochrome c promotes apoptosome‐complex formation and subsequent caspase‐9/caspase‐3 pathway activation. In addition to these “downstream of mitochondria” caspases, other caspases may be activated upstream of mitochondria (27). The findings that Z‐VAD failed almost completely to prevent ΔΨm loss and cytochrome c release suggested that caspase pathways were activated in coronopilin‐treated Jurkat cells mainly, if not exclusively, “downstream of mitochondria”. The contribution of caspases to coronopilin‐activated apoptotic death was more marked in the first 24 h, as Z‐VAD reduced population of phosphatidylserine‐exposing cells, by >60% at 20 h, but <40% at 40 h.
Unlike Jurkat cells, only a low percentage (<15%) of U937 cells underwent cell death within the first 24 h after exposure to coronopilin (20 μm, a dose close to IC50 value in U937). Analysis of the cycle showed that most cells accumulated at G2/M, indicating that reduction in U937 cell number could be almost completely ascribed to coronopilin cytostatic effects.
Analysis of coronopilin effects on cyclin B1, Cdk1, and aurora B kinase, key regulators of cell cycle transition from G2 to M (28, 29), allowed us to further discriminate between G2 and M phase arrest. Indeed, increase in cyclin B1 expression and formation of cyclin B1/Cdk1 active complex are the rate‐limiting steps of mitosis (22, 30). Cyclin B1/Cdk1 complex is held in an inactive state during interphase, by phosphorylation of Thr14 and Tyr15 residues of Cdk1 subunit. To allow G2 to M transition, the complex is then activated through dephosphorylation of these two negative regulatory sites and concomitant phosphorylation of Cdk1 subunit at Thr161. Presence of Thr161‐phosphorylated Cdk1, together with more than 3‐fold increase in the mitotic index, indicated that coronopilin specifically induced mitotic blockage in U937 cells. In particular, as transition from metaphase to anaphase is characterized by rapid ubiquitin‐mediated proteolysis of cyclin B1 (31), sustained levels of cyclin B1 protein suggested that cells accumulated mainly in metaphase (early or late). Coronopilin‐induced metaphase arrest was further indicated by presence of high levels of aurora B kinase–mediated phosphorylation of histone H3 at Ser10 (25). Changes in phosphorylation status of histone H3 are indeed known to occur in mitotic phases (23, 32). While Ser10H3 phosphorylation is maintained throughout metaphase, dephosphorylation of this site, beginning in anaphase and completed in telophase, is required for further progression of mitotic division.
Several kinds of anti‐cancer agent are known to inhibit tubulin transition from a polymerized to a de‐polymerized state or the reverse, leading to mitotic arrest and ultimately to cell death (33, 34). By performing MS analysis, we demonstrated the ability of coronopilin to interact covalently with tubulin nucleophilic groups, possibly –SH residues (35). As most mitotic poisons interacting or oxidizing tubulin sulphydryls tend to be inhibitors of tubulin in vivo polymerization (36, 37), we expected that coronopilin also would inhibit microtubule assembly. In U937 cells’ system, coronopilin instead caused marked increase in the polymerized/soluble tubulin ratio. Discrepancies between data obtained in cell‐free and in a cell system might depend on several factors, including the following: (i) intrinsic difficulty to extrapolate results from a cell‐free system to a cell system (38, 39); (ii) other signalling proteins, controlling downstream tubulin microtubule dynamics (40), rather than tubulin itself, might be the effective coronopilin target in cells; (iii) an alternative, but not exclusive, hypothesis is that a coronopilin metabolite may be the active species responsible for cell tubulin hyperpolymerization. At least, we cannot exclude that increase in hyperpolymerized tubulin was a mere consequence of induced mitotic arrest.
During prolonged mitotic arrest, several death signals accumulate and subsequent ‘delayed’ mitotic‐linked cell death is indicated as ‘mitotic catastrophe’ (21, 41). Our observations concerning mitotic arrest, cyclin B1/Cdk1 complex activation, and nucleus fragmentation strongly suggest that, at times later than 24 h, coronopilin‐treated U937 cells underwent mitotic catastrophe (21). Moreover, absence of polyploid cells indicated that cells died during failed mitosis rather than in subsequent mitoses without cytokinesis (34). Mitotic catastrophe has been defined as a ‘prestage’ to necrosis or to caspase‐dependent and caspase‐independent apoptosis (21, 42). In U937 cells, mitotic catastrophe preceded any caspase‐independent apoptosis‐like mode of death, as indicated by the negligible protective effect of Z‐VAD against phosphatidylserine exposure and absence of caspase‐3 proteolytic activation.
Presence of several nucleophilic sites makes DNA a suitable target for coronopilin’s α,β‐unsaturated carbonyl group. Accordingly, increased levels of γH2AX, marker of DNA damage (26), were observed in both Jurkat and U937 coronopilin‐treated cells. This finding suggested, even though not conclusively demonstrated (43), that DNA damage may be one of the initiating events, occurring in both cell lines, following coronopilin exposure. In response to DNA damage, different pathways, ultimately resulting in early or mitotic arrest/delayed apoptotic cell death, may be activated in Jurkat and U937 cells. Different outcomes of coronopilin treatment in Jurkat and U937 cells could be due to: (i) Jurkat and U937 cells, being of different origin (Jurkat, T‐lymphoid origin; U937, monocytoid origin), display different protein expression, and activation patterns (44, 45, 46). Remarkably, Kaufman et al. (44) highlighted differences in U937 versus Jurkat T cells in regulation of NF‐κB subunits, which may be, as for other sesquiterpene lactones (47), a possible coronopilin target; (ii) different susceptibilities of leukaemia cells to exogenous or endogenous stimuli is well documented (48, 49, 50). Other factors might include different coronopilin metabolic fate/rate (51) and differences in membrane composition, or in P‐glycoprotein‐mediated influx/efflux (52). All the above differences might possibly result in changes in effective coronopilin intracellular concentration and, consequently, in different primary responses (53).
A major challenging task for chemotherapeutic strategies is identification of drugs that specifically work on cancer cells, but not on normal cells. In particular, those chemotherapeutic agents, that target proteins involved in regulation of cell division, have been shown to preferentially eliminate cancer cells due to their actively cycling phenotype (33, 54). Here, we demonstrated that coronopilin had low, if not any, cytotoxic effect on freshly isolated resting PBMC, as well as on PBMC cultured up to 72 h in the presence of mitogenic stimuli. Resistance of normal cells to coronopilin‐promoted early or delayed death processes might be ascribed, at least in part, to the ability of the molecule to inhibit PBMC response to PHA stimulation, causing, also after 72‐h culture, the cells to arrest in G0/G1. Non‐proliferative status of PBMC might enable the cells to escape cytotoxic effects of coronopilin, especially if driven by DNA damage.
In conclusion, coronopilin may be considered to be a promising chemotherapeutic molecule for its effectiveness against leukaemia cells, while having low toxicity to normal white blood cells. Moreover, coronopilin may represent an interesting new chemical scaffold to develop, by medicinal chemistry approaches, new small molecules as anti‐leukaemic agents.
Supporting information
Fig. S1 Coronopilin‐tubulin interaction in cell‐free system. MALDI/MS spectrum of tubulin (upper panel) and of coronopilin/tubulin (1:1 molar ratio) mixture (lower panel).
Supporting info item
References
- 1. Newman DJ, Cragg GM, Snader KM (2003) Natural products as sources of new drugs over the period 1981–2002. J. Nat. Prod. 66, 1022–1037. [DOI] [PubMed] [Google Scholar]
- 2. Zhang S, Won Y‐K, Ong C‐N, Shen H‐M (2005) Anti‐cancer potential of sesquiterpene lactones: bioactivity and molecular mechanisms. Anticancer Agents 5, 239–249. [DOI] [PubMed] [Google Scholar]
- 3. Liu JW, Cai MX, Xin Y, Wu QS, Ma J, Yang P et al. (2010) Parthenolide induces proliferation inhibition and apoptosis of pancreatic cancer cells in vitro . J. Exp. Clin. Canc. Res. 29, 108. [DOI] [PMC free article] [PubMed] [Google Scholar]
- 4. Kupchan SM, Fessler DC, Eakin MA, Giacobbe TJ (1970) Reactions of α methylene lactone tumor inhibitors with model biological nucleophils. Science 168, 376–378. [DOI] [PubMed] [Google Scholar]
- 5. Avonto A, Taglialatela‐Scafati O, Pollastro F, Minassi A, Di Marzo V, De Petrocellis L et al. (2011) An NMR Spectroscopic method to identify and classify thiol‐trapping agents: revival of Michael acceptors for drug discovery. Angew. Chem. Int. Ed. 50, 467–471. [DOI] [PubMed] [Google Scholar]
- 6. Fernandes MB, Scotti MT, Ferreira MJP, Emerenciano VP (2008) Use of self‐organizing maps and molecular descriptors to predict the cytotoxic activity of sesquiterpene lactones. Eur. J. Med. 43, 2197–2205. [DOI] [PubMed] [Google Scholar]
- 7. Ghantous A, Gali‐Muhtasib H, Vuorela H, Saliba NA, Darwiche N (2010) What made sesquiterpene lactones reach cancer clinical trials? Drug Discov. Today 15, 668–678. [DOI] [PubMed] [Google Scholar]
- 8. Scotti MT, Fernandes MB, Ferreira MJP, Emerenciano VP (2007) Quantitative structure–activity relationship of sesquiterpene lactones with cytotoxic activity. Bioorg. Med. Chem. 15, 2927–2934. [DOI] [PubMed] [Google Scholar]
- 9. De Leo M, Vera Saltos MB, Naranjo Puente BF, De Tommasi N, Braca A (2010) Sesquiterpenes and diterpenes from Ambrosia arborescens . Phytochemistry 71, 804–809. [DOI] [PubMed] [Google Scholar]
- 10. De Leo M, Vera Saltos MB, Naranjo Puente BF, De Tommasi N, Braca A (2011) Corrigendum to “Sesquiterpenes and diterpenes from Ambrosia arborescens” [Phytochemistry 71 (2010) 804–809]. Phytochemistry 72, 952. [DOI] [PubMed] [Google Scholar]
- 11. Correa QJE, Bernal HY (1990) Especies promisorias vegetales de los países del Convenio Andrés Bello, Tomo V. Bogotá: SECAB Ciencia y Tecnología 17, pp. 464–467. [Google Scholar]
- 12. Duval M, Klein JP, He W, Cahn JY, Cairo M, Camitta BM et al. (2010) Hematopoietic stem‐cell transplantation for acute leukemia in relapse or primary induction failure. J. Clin. Oncol. 28, 3730–3738. [DOI] [PMC free article] [PubMed] [Google Scholar]
- 13. Ofran Y, Rowe JM (2011) Induction and postremission strategies in acute myeloid leukemia: what is new? Curr. Opin. Hematol. 18, 83–88. [DOI] [PubMed] [Google Scholar]
- 14. Nicoletti I, Migliorati G, Pagliacci MC, Grignani F, Riccardi C (1991) A rapid and simple method for measuring thymocyte apoptosis by propidium iodide staining and flow cytometry. J. Immunol. Methods 139, 271–279. [DOI] [PubMed] [Google Scholar]
- 15. Santoro A, Pisanti S, Grimaldi C, Izzo AA, Borrelli F, Proto MC et al. (2009) Rimonabant inhibits human colon cancer cell growth and reduces the formation of precancerous lesions in the mouse colon. Int. J. Cancer 125, 996–1003. [DOI] [PubMed] [Google Scholar]
- 16. Gallotta D, Nigro P, Cotugno R, Gazzerro P, Bifulco M, Belisario MA (2010) Rimonabant‐induced apoptosis in leukemia cell lines: activation of caspase‐dependent and ‐independent pathways. Biochem. Pharmacol. 80, 370–380. [DOI] [PubMed] [Google Scholar]
- 17. Wu Y‐C, Yen W‐Y, Ho H‐Y, Su T‐L, Yi L‐H (2010) Glyfoline induces mitotic catastrophe and apoptosis in cancer cells. Int. J. Cancer 126, 1017–1028. [DOI] [PubMed] [Google Scholar]
- 18. Ly JD, Grubb DR, Lawen A (2003) The mitochondrial membrane potential (deltapsi(m)) in apoptosis; an update. Apoptosis 8, 115–128. [DOI] [PubMed] [Google Scholar]
- 19. Vandenabeele P, Vanden Berghe T, Festjens N (2006) Caspase inhibitors promote alternative cell death pathways. Sci. STKE 358, pe44. [DOI] [PubMed] [Google Scholar]
- 20. Moubarak RS, Yuste VJ, Artus C, Bouharrour A, Greer PA, Menissier‐de Murcia J et al. (2007) Sequential activation of poly(ADP‐Ribose) polymerase 1, calpains, and bax is essential in apoptosis‐inducing factor‐mediated programmed necrosis. Mol. Cell. Biol. 27, 4844–4862. [DOI] [PMC free article] [PubMed] [Google Scholar]
- 21. Vakifahmetoglu H, Olsson M, Zhivotovsky B (2008) Death through a tragedy: mitotic catastrophe. Cell Death Differ. 15, 1153–1162. [DOI] [PubMed] [Google Scholar]
- 22. Morgan DO (1995) Principles of CDK regulation. Nature 374, 131–134. [DOI] [PubMed] [Google Scholar]
- 23. Hendzel MJ, Wei Y, Mancini MA, Van Hooser A, Ranalli T, Brinkley BR et al. (1997) Mitosis‐specific phosphorylation of histone H3 initiates primarily within pericentromeric heterochromatin during G2 and spreads in an ordered fashion coincident with mitotic chromosome condensation. Chromosoma 106, 348–360. [DOI] [PubMed] [Google Scholar]
- 24. Murnion ME, Adams RR, Callister DM, Allis CD, Earnshaw WC, Swedlow JR (2001) Chromatin‐associated protein phosphatase 1 regulates aurora‐B and histone H3 phosphorylation. J. Biol. Chem. 276, 26656–26665. [DOI] [PubMed] [Google Scholar]
- 25. Song L, Li D, Liu R, Zhou H, Chen J, Huang X (2007) Ser‐10 phosphorylated histone H3 is involved in cytokinesis as a chromosomal passenger. Cell Biol. Int. 31, 1184–1190. [DOI] [PubMed] [Google Scholar]
- 26. Bonner WM, Redon CE, Dickey JS, Nakamura AJ, Sedelnikova OA, Solier S et al. (2008) GammaH2AX and cancer. Nat. Rev. Cancer 8, 957–967. [DOI] [PMC free article] [PubMed] [Google Scholar]
- 27. Kroemer G, Galluzzi L, Brenner C (2007) Mitochondrial membrane permeabilization in cell death. Physiol. Rev. 87, 99–163. [DOI] [PubMed] [Google Scholar]
- 28. Nigg EA (2001) Mitotic kinases as regulators of cell division and its checkpoints. Nat. Rev. Mol. Cell Biol. 2, 21–32. [DOI] [PubMed] [Google Scholar]
- 29. Carmena M, Ruchaud S, Earnshaw WC (2009) Making the Auroras glow: regulation of Aurora A and B kinase function by interacting proteins. Curr. Opin. Cell Biol. 21, 796–805. [DOI] [PMC free article] [PubMed] [Google Scholar]
- 30. Timofeev O, Cizmecioglu O, Settele F, Kempf T, Hoffmann I (2010) Cdc25 phosphatases are required for timely assembly of CDK1‐cyclin B at the G2/M transition. J. Biol. Chem. 285, 16978–16990. [DOI] [PMC free article] [PubMed] [Google Scholar]
- 31. Brandeis M, Hunt T (1996) The proteolysis of mitotic cyclins in mammalian cells persists from the end of mitosis until the onset of S phase. EMBO J. 15, 5280–5289. [PMC free article] [PubMed] [Google Scholar]
- 32. Hans F, Dimitrov S (2001) Histone H3 phosphorylation and cell division. Oncogene 20, 3021–3027. [DOI] [PubMed] [Google Scholar]
- 33. Jackson JR, Patrick DR, Dar MM, Huang PS (2007) Targeted anti‐mitotic therapies: can we improve on tubulin agents? Nat. Rev. Cancer 7, 107–117. [DOI] [PubMed] [Google Scholar]
- 34. Gascoigne KE, Taylor SS (2009) How do anti‐mitotic drugs kill cancer cells? J. Cell Sci. 122, 2579–2585. [DOI] [PubMed] [Google Scholar]
- 35. Oakley BR (2000) An abundance of tubulins. Trends Cell Biol. 10, 537–542. [DOI] [PubMed] [Google Scholar]
- 36. Legault J, Gaulin J‐F, Mounetou E, Bolduc S, Lacroix J, Poyet P et al. (2000) Microtubule disruption induced in vivo by alkylation of β‐tubulin by 1‐aryl‐3‐(2‐chloroethyl)ureas, a novel class of soft alkylating agents1. Cancer Res. 60, 985–992. [PubMed] [Google Scholar]
- 37. Stewart BJ, Doorn JA, Petersen DR (2007) Residue‐specific adduction of tubulin by 4‐hydroxynonenal and 4‐oxononenal causes cross‐linking and inhibits polymerization. Chem. Res. Toxicol. 20, 1111–1119. [DOI] [PubMed] [Google Scholar]
- 38. Bocca C, Gabriel L, Bozzo F, Miglietta A (2004) A sesquiterpene lactone, costunolide, interacts with microtubule protein and inhibits the growth of MCF‐7 cells. Chem. Biol. Interact. 147, 79–86. [DOI] [PubMed] [Google Scholar]
- 39. Miglietta A, Bozzo F, Gabriel L, Bocca C (2004) Microtubule‐interfering activity of parthenolide. Chem. Biol. Interact. 149, 165–173. [DOI] [PubMed] [Google Scholar]
- 40. Moon D‐O, Kim M‐O, Kang C‐H, Lee J‐D, Choi YH, Kim G‐Y (2009) JNK inhibitor SP600125 promotes the formation of polymerized tubulin, leading to G2/M phase arrest, endoreduplication, and delayed apoptosis. Exp. Mol. Med. 41, 665–677. [DOI] [PMC free article] [PubMed] [Google Scholar]
- 41. Castedo M, Perfettini J‐L, Roumier T, Valent A, Raslova H, Yakushijin K et al. (2004) Mitotic catastrophe constitutes a special case of apoptosis whose suppression entails aneuploidy. Oncogene 23, 4362–4370. [DOI] [PubMed] [Google Scholar]
- 42. Mansilla S, Priebe W, Portugal J (2006) Mitotic catastrophe results in cell death by caspase‐dependent and caspase‐independent mechanisms. Cell Cycle 5, 53–60. [DOI] [PubMed] [Google Scholar]
- 43. Ichijima Y, Sakasai R, Okita N, Asahina K, Mizutani S, Teraoka H (2005) Phosphorylation of histone H2AX at M phase in human cells without DNA damage response. Biochem. Biophys. Res. Commun. 336, 807–812. [DOI] [PubMed] [Google Scholar]
- 44. Kaufman PA, Weinberg JB, Greene WC (1992) Nuclear expression of the 50‐ and 65‐kD Rel related subunits of nuclear factor‐κB is differentially regulated in human monocytic cells. J. Clin. Invest. 90, 121–129. [DOI] [PMC free article] [PubMed] [Google Scholar]
- 45. Chan AC, van Oers NSC, Tran A, Turka L, Law CL, Ryan JC et al. (1994) Differential expression of ZAP‐70 and Syk protein tyrosine kinases, and the role of this family of protein tyrosine kinases in TCR signaling. J. Immunol. 152, 4758–4766. [PubMed] [Google Scholar]
- 46. Alvarez P, Sáenz P, Arteta D, Martínez A, Pocoví M, Simón L et al. (2007) Transcriptional profiling of hematologic malignancies with a low‐density DNA microarray. Clin. Chem. 53, 259–267. [DOI] [PubMed] [Google Scholar]
- 47. Steele AJ, Jones DT, Ganeshaguru K, Duke VM, Yogashangary BC, North JM et al. (2006) The sesquiterpene lactone parthenolide induces selective apoptosis of B‐chronic lymphocytic leukemia cells in vitro. Leukemia 20, 1073–1079. [DOI] [PubMed] [Google Scholar]
- 48. Mariani AR, Columbaro M, Zauli G, Zamai L, Luchetti F, Gobbi P et al. (1999) Lineage‐related susceptibility of human hemopoietic cell lines to apoptosis. Anat. Rec. 254, 1–6. [DOI] [PubMed] [Google Scholar]
- 49. Bernabei P, Coccia EM, Rigamonti L, Bosticardo M, Forni G, Pestka S et al. (2001) Interferon‐γ receptor 2 expression as the deciding factor in human T, B, and myeloid cell proliferation or death. J. Leuk. Biol. 70, 959–960. [PubMed] [Google Scholar]
- 50. Wuchter C, Ruppert V, Schrappe M, Dörken B, Ludwig WD, Karawajew L (2002) In vitro susceptibility to dexamethasone‐ and doxorubicin‐induced apoptotic cell death in context of maturation stage, responsiveness to interleukin 7, and early cytoreduction in vivo in childhood T‐cell acute lymphoblastic leukemia. Blood 99, 4109–4115. [DOI] [PubMed] [Google Scholar]
- 51. Nagai F, Hiyoshi Y, Sugimachi K, Tamura HO (2002) Cytochrome P450 (CYP) expression in human myeloblastic and lymphoid cell lines. Biol. Pharm. Bull. 25, 383–385. [DOI] [PubMed] [Google Scholar]
- 52. Kamau SW, Krämer SD, Günthert M, Wunderli‐Allenspach H (2005) Effect of the modulation of the membrane lipid composition on the localization and function of P‐glycoprotein in MDR1‐MDCK cells. In Vitro Cell. Dev. Biol. Anim. 41, 207–216. [DOI] [PubMed] [Google Scholar]
- 53. Yeung TK, Germond C, Chen X, Wang Z (1999) The mode of action of taxol: apoptosis at low concentration and necrosis at high concentration. Biochem. Biophys. Res. Commun. 263, 398–404. [DOI] [PubMed] [Google Scholar]
- 54. Schmit TL, Ahmad N (2007) Regulation of mitosis via mitotic kinases: new opportunities for cancer management. Mol. Cancer Ther. 6, 1920–1931. [DOI] [PubMed] [Google Scholar]
Associated Data
This section collects any data citations, data availability statements, or supplementary materials included in this article.
Supplementary Materials
Fig. S1 Coronopilin‐tubulin interaction in cell‐free system. MALDI/MS spectrum of tubulin (upper panel) and of coronopilin/tubulin (1:1 molar ratio) mixture (lower panel).
Supporting info item


