Abstract
Objectives
Terminal restriction fragment (TRF) analysis of human telomeres was used to calibrate flow‐fluorescence in situ hybridization (FF) measures of telomere lengths to expand the range of measures and increase power of resolution of our previously published protocol. TRF data used as the gold standard should be obtained by electrophoresis with suitable resolution applied to appropriately isolated genomic DNA. When we considered TRF attained by correct methods, we found our method to be insufficiently accurate, thus we have reviewed our previously published FF protocol to obtain the best coefficient of determination (r 2) between our experimental results and valid TRF lengths.
Materials and methods
Using human telomere‐specific PNA probe, Cy5‐OO‐(CCCTAA)3, we measured telomere lengths of continuous cell line and of peripheral blood lymphocytes by FF. We modified hybridization, stringency, negative control handling, stoichiometric DNA staining and telomere fluorescence assessment of the protocol.
Results
We realized a procedure with increased power of resolution, improved TRF versus FF r 2 values that allowed simultaneous analysis of DNA and telomere duplication. Notwithstanding multiple steps in formamide sampling, recovery was satisfactory.
Discussion
The reviewed FF protocol appeared at least as suitable as the TRF method. Measures obtained by TRF can be affected by chromosome end variability, DNA fragmentation, incomplete digestion and unsuitable electrophoresis. In contrast, the FF technique analyses telomeric sequences confined to preserved nuclei thus overcome most previous limitations. As yet, however, the FF telomere measure cannot be performed together with immunophenotyping and/or generation study by the dye dilution method.
Introduction
Terminal restriction fragment (TRF) length analysis by Southern blotting is commonly used to calibrate flow‐fluorescence (FF) results. The 1301 cell line, for example, is frequently used as reference standard due to its long telomeres that some authors have evaluated to be in the order of 25 kb, by the TRF method 1, 2. Curiously, this molecular weight coincides with resolution power of standard agarose gel (0.5–0.7%) electrophoresis (3a) and/or with average length of genomic DNA molecules sheared during the isolation procedure (3b). This is so true that, authors who avoid break‐off of DNA during extraction by lysing cells in low melting agarose plugs or by following the spooling method of DNA isolation, have reported longest TRF sizes 4, 5. As a consequence, these authors resolved TRFs by field inversion gel electrophoresis that allows separation of DNA molecules up to 5 Mb in length (3c). In particular, TRF length of 1301 cell line widely used as internal standard in FF measures (e.g. Telomere PNA Kit/FITC for Flow Cytometry; DakoCytomation, Glostrup, Denmark) rises from around 25 to 80 kb when telomeric DNA is correctly analysed.
Attributing length of 80 kb to 1301 cell telomeres and correlating it with our previously published relative telomere lengths of Ramos and Daudi cell lines and of lymphocytes 6, we have obtained a determination coefficient (r 2) of 0.65 ± 0.15, plotting FF versus TRF measures. Thus, we reviewed our FF protocol to ameliorate the correlation between TRF and FF data of samples of cells with telomere sizes from few kb up to 80 kb. In particular, we unified treatment of stained and control cells, modified hybridization solutions, stringency steps and genomic DNA staining. As a consequence, we achieved r 2 between FF and TRF measures of 0.96 ± 0.03, with telomere lengths ranging from ≈6 kb to ≈80 kb. Moreover, we improved simultaneous study of genomic and telomeric DNA duplication in proliferating cells. Finally, although the reviewed protocol includes more steps in ionizing solvents, cell physical parameters (FSC and SSC) were preserved and sample recovery was acceptable (from 30 to 50%).
Materials and methods
Cells
Hypodiploid human Burkitt's lymphoma B‐cell line Ramos (ECACC cat. no. 85030802), near diploid (with 20% polyploidy) human Burkitt's lymphoma B‐cell line Daudi (ECACC cat. no. 85011437) and near tetraploid human T‐cell leukaemia line 1301 (ECACC cat. no. 01051619) were purchased from Sigma Aldrich (Milan, Italy). Cells were maintained from 1 × 10⁵ to 1 × 10⁶ cells/ml and cultured in RPMI 1640 (Life Technologies, Milan, Italy) supplemented with antibiotics and 10% foetal calf serum (FCS; HyClone, Logan, UT, USA) at 37 °C in humidified atmosphere with 5% CO2. T and B lymphocytes from human peripheral blood mononuclear cells were purified (purity >95%) using Dynal Negative Isolation Kits (Dynal Biotech Asa, Oslo, Norway) and separated by isopicnic centrifugation on Lymphoprep (Axis‐Shield, Oslo, Norway), from EDTA‐treated blood samples.
Cell permeabilization‐denaturation, hybridization and stringency washes
For each test, 6 × 10⁵ cells were washed in 1.5‐ml tubes with phosphate‐buffered saline 0.15 M pH 7.2 (PBS) containing 10% FCS (v/v) and maintained in the same solution at 4 °C for at least 10 min. Samples were then centrifuged at 200 g for 4 min. at 4 °C and re‐suspended in 600 μl of denaturing solution containing 50% formamide (v/v) (Invitrogen, Carlsbad, CA, USA), 10% FCS (v/v) and PBS 9 mm pH 7.2. After 10 min. at RT, 300 μl samples were transferred into further 1.5‐ml tubes, incubated for 15 min at 87 °C, 10 min at RT then reunited in 0.5‐ml tubes with the 300 μl of sample left at RT. Tubes containing both high‐temperature and RT‐treated cells were then centrifuged at 600 g for 4 min. at 20 °C (from this step on, all centrifugations were performed using these parameters). After one wash in 0.5 ml PBS containing 30% FCS, cells were re‐suspended in 0.5 ml hybridization solution, PBS, 30% FCS and formamide 1:1, containing 20 nm PNA probe Cy5‐OO‐(CCCTAA)3 (Panagene, Daejeon, Korea) and incubated overnight at RT, in the dark with gentle rotation. The probe (shipped freeze‐dried) was dissolved in PBS containing 30% FCS, 30% formamide and 0.05% NaN3 20 μm concentration, and stored at 4 °C for at least 12 months without any evident loss of efficiency. Samples were then centrifuged and washed in 0.5 ml of PBS, 30% FCS. Stringency was performed re‐suspending cells in 0.5 ml of hybridization solution (without probe) for 10 min. at RT, with gentle rotation, then samples were washed in 0.5 ml PBS, 30% FCS. Finally, cells were re‐suspended in 0.3 ml of PBS, 10% FCS containing 5 μg/ml ethidium bromide (Eth‐Br; Sigma Aldrich) for at least 30 min. with gentle rotation at RT in the dark before acquisition.
Flow cytometry
Cells were analysed using FACS Calibur cytometry apparatus (Becton Dickinson, Milan, Italy) equipped with 15 mW, 488 nm, air‐cooled argon ion laser for excitation of Eth‐Br (FL2), with 10 mW, 635 nm, red diode laser for excitation of Cy5 (FL4). Cytometer stability and sensitivity were checked before each acquisition session, by measuring intensity and variation coefficient of scatters and fluorescence signals of Nile Red microbeads (Becton Dickinson). FL4 detection was optimized by time delay calibration using APC microbeads (Becton Dickinson); singlets and doublets of the same microbeads were used to check linearity of FL4 detection. FSC‐H, SSC‐H, FL2‐H and FL4‐H height signals, and FL2‐A area signals were collected after linear amplification. For analysis of samples containing all three cell lines, FL4‐H was collected after logarithmic amplification. Discrimination of doublets was achieved gating single events in FL2‐A versus FL2‐H plot. Suitable instrumentation setting did not require any compensation between FL2 and FL4 fluorescences. To improve resolution of DNA content and telomere length, it was necessary to set low flow rate (10–14 μl/min, 150–300 cells/s) and to acquire Eth‐Br and Cy5 fluorescences as much as possible on the right hand side of the linear scale.
Samples were acquired and analysed using CELLQuest 3.3 software (Becton Dickinson); for deconvolution of FL2‐A and FL4‐H frequency distributions, FlowJo 6.4.7 software was used (Stanford University, Tree Star Inc., Stanford, CA, USA).
Results
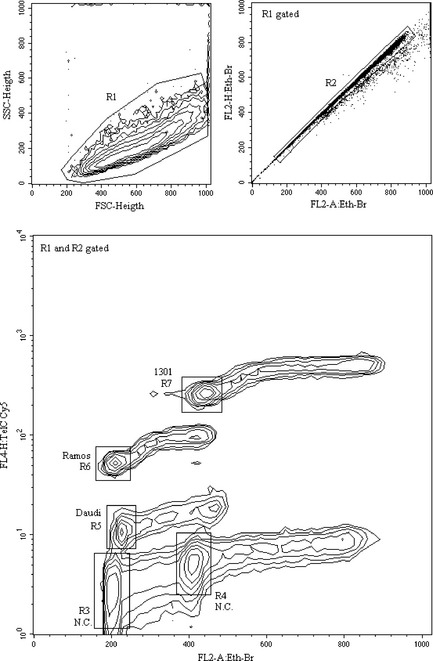
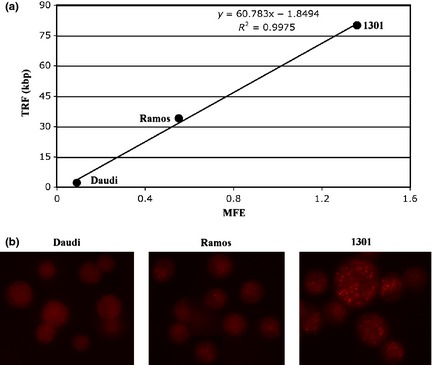
Figure 1 reveals results of a typical FF telomere measure experiment, performed on 1301, Ramos and Daudi cell lines following the reviewed procedure. Quality of physical and fluorescence parameters allows accurate data analysis by logical gating single events contained in R1 and R2 regions (upper panels): contour graph of total DNA versus telomeric DNA represents cells gated (92% total events) on scattergram (R1) and doublet discrimination dot plot (R2) to exclude debris and doublets. The acquired sample includes (in the same tube) both stained cells and their negative controls: by analysis of FL2‐A emission of stoichiometric stained total DNA, it is possible to gate G1‐G0 events of the three different cell lines, indicated as R5, R6, R7, and of their negative controls, (R3) for Daudi and Ramos and (R4) for 1301. As the FACSCalibur has 1024 channels of resolution power (10 bits, 4 decades), to simultaneously measure PNA fluorescence emission of negative controls and of tetraploid cell line 1301, the FL4‐H was collected with logarithmic amplification. Telomeric measures were normalized as follows: for each cell line, FL4‐H geometric mean of G1‐G0‐gated negative control (NC) events, was subtracted from FL4‐H geometric mean of G1‐G0‐gated hybridized cells (R3 NC for R5 and R6; R4 NC for R7). Specific fluorescence value, so calculated, was divided by number of chromosome ends of each cell line (92 for Daudi, 90 for Ramos and 184 for 1301) 7 obtaining the mean fluorescence for extremity (MFE). Plotting MFE values versus corresponding TRF measures, it is possible to draw a linear regression curve and to compute r 2 determination coefficient (Fig. 2a). Assigning to each cell line TRF sizes reported in the literature 4, 5, MFE percentage values (e.g. Ramos MFE/1301 MFE× 100) can be converted into kbp relative telomere size. In Table 1, mean FF sizes (kbp) obtained in ten replicated experiments are reported. The Daudi cell line shows significant difference between TRF and FF telomere measures (2.2 kbp versus 6.158 ± 0.549 kbp). This Burkitt's lymphoma derived cell line has many EBV genome copies (200–400/cell) mainly present as episomal forms 8, 9 and each episome contains some telomere sequences 10. During genomic DNA isolation and digestion TRF procedure, these episomes are lost, whereas hybridization in preserved nuclei of FF method stains these extrachromosomal telomeric repeats also.
Figure 1.

Scattergram ( FSC ‐height versus SSC ‐height; formatted without smoothing and with threshold 0.5%) of a sample containing all three cell lines treated following the reviewed procedure, upper left panel. Dot plot (FL2‐A: Eth‐Br versus FL2‐H: Eth‐Br) of R1‐gated cells used to select single events (R2 gate). Contour graph (FL2‐A: Eth‐Br versus FL4‐H: TelC Cy5; formatted without smoothing and with threshold 0.5%) of logical gated (R1 and R2) cells illustrates double fluorescence (total versus telomeric DNA) of 1301, Ramos and Daudi hybridized cells and their negative controls (N.C.). Biparametric regions (R7, R6 and R5 for hybridized cells; R4 and R3 control cells) drawn around G1–G0 events to calculate geometric mean of Cy5 fluorescence.
Figure 2.

(a) Linear regression curve MFE versus TRF values. MFE data calculated on sample analysed in Fig. 1; TRF sizes obtained from Mochida et al. 4 for Ramos and Daudi cells and from Jeyapalan et al. 5 for 1301 cells. In the graph, equation and coefficient of determination (R 2) of the curve are reported. (b) Images represent PNA probe emission of the three cell lines treated without Eth‐Br counterstaining to demonstrate different fluorescence patterns. Photomicrographs obtained using Olympus BX51 microscope equipped with a SPOT RT colour camera, objective 60× and Cy5 filter (Olympus U‐MWIY2).
Table 1.
TRF sizes (kbp) and mean FF sizes (kbp) of Daudi, Ramos and 1301 cells. TRF measures were obtained from the literature 4, 5 and the FF measures were calculated as described in the text
| TRF size (kbp) | Mean FF size ± SD (kbp) | |
|---|---|---|
| Daudi | 2.2 | 6.158 ± 0.549 |
| Ramos | 34 | 33.618 ± 1.133 |
| 1301 | 80 | 81.064 ± 3.13 |
TRF, terminal restriction fragment; FF, flow‐fluorescence.
Capability of the reviewed protocol permits evaluation of difference in PNA emissions between the three cell lines using a simple fluorescence microscope (Fig. 2b): in 1301 cells, fluorescence is bright and spotted, in Ramos cells it is spotted, but less intense and in Daudi cells it appears diffuse and faint.
To definitely confirm our postulate that telomeric DNA denatured in hot formamide cannot properly re‐nature if constrained within the nuclear microvolume 6, we performed experiments in which cells, after denaturation, were left in PBS containing 30% FCS at 4 °C for up to 6 days before hybridization. The measures of telomere lengths of Daudi, Ramos and 1301 cells did not show any significant variations, notwithstanding the stay in solution without formamide (data not shown).
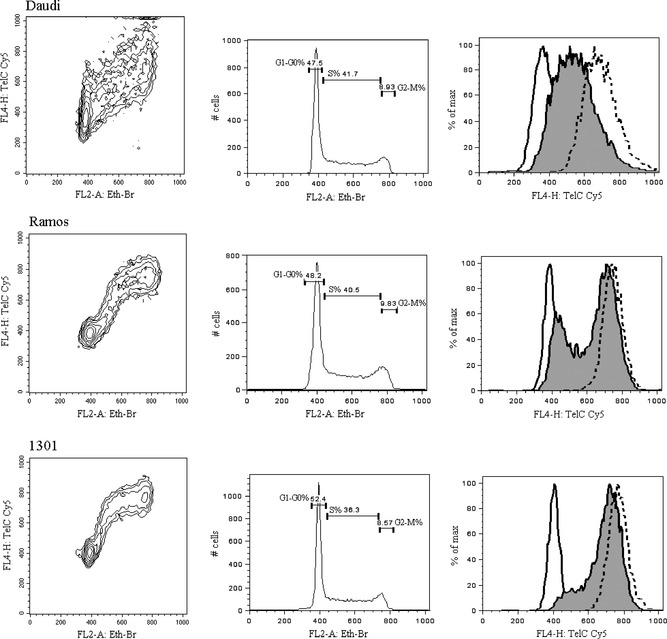
Our improved protocol can be used to study different duplication kinetics of genomic and telomeric DNA. For this purpose, we preliminarily verified that the PNA probe did not interfere with simultaneous stoichiometric staining of total DNA, by comparing cell cycle analysis of double (PNA and Eth‐Br) or single (Eth‐Br) stained samples. In Fig. 3, FL2‐A versus FL4‐H contour graphs of the three cell lines are represented (events were logical gated to exclude debris and doublets as described for Fig. 1) to illustrate different biparametric distributions of the fluorescences. Deconvolution of histograms of total DNA (FL2‐A EtBr) and gates G1‐G0, S and G2‐M were realized by the Dean‐Jett‐Fox model of FlowJo cell cycle platform. Overlaid histograms of FL4‐H TelC Cy5 fluorescence, gated on the three cell cycle phases, show simultaneous duplication of genomic and telomeric DNA in Daudi cells, while S phase‐gated Ramos cells (grey histogram) have prevalence of events with duplicated telomeres. Early duplication of telomeric sequences is even more evident in 1301 S phase‐gated cells (grey histogram) that almost all appear with duplicated telomeres.
Figure 3.

Three contour graphs gated and formatted as described in Fig. 1 illustrate different biparametric distributions of Eth‐Br and Cy5 fluorescences of Daudi, Ramos and 1301 cell lines throughout cell cycle. In the corresponding histograms of total DNA (FL2‐A Eth‐Br), monoparametric regions and their cell content (percentage) drawn by Dean‐Jett‐Fox modelling to select G1‐G0, S and G2‐M events. Overlaid histograms of FL4‐H TelC Cy5 fluorescence gated on G1‐G0 events (continuous line), S events (grey coloured) and G2‐M events (dashed line) illustrated on the right.
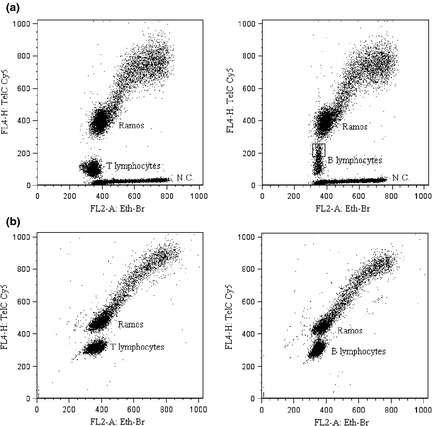
Achieved resolution power of the procedure is well illustrated by analysis of telomere lengths of normal human peripheral blood T and B lymphocytes. In Fig. 4, dot plots (FL2‐A versus FL4‐H) of samples containing lymphocytes and internal standard (Ramos cells) obtained by reviewed (A) and previous (B) protocols are shown. Comparison between A and B panels shows that in samples treated with the optimized procedure, difference in PNA emission between lymphocytes and G1‐G0 Ramos cells is higher and that telomeres of B lymphocytes not only turn out to be longer than those of T cells, but also have a more complex fluorescence pattern. Some B events have PNA fluorescence intensity approximately twice the lymphocytes B mean fluorescence (see box upper right dot plot). Normalizing data as described above and assigning 34 kbp to G1‐G0 Ramos cell telomeres, we measured 7.93 ± 0.42 kbp telomeres of T lymphocytes and 10.54 ± 0.48 kbp telomeres of B lymphocytes. The described quantitative and qualitative difference between T and B telomeres is more impressive than that reported in previous literature and in our previously published data 6, 11.
Figure 4.

Dot plots (FL2‐A Eth‐Br versus FL4‐H TelC Cy5) of lymphocytes and internal standard (Ramos) obtained by reviewed (a) or previous (b) protocols. Plots represent events logical gated to exclude debris and doublets. Samples treated following the optimized procedure include negative controls (N.C.) and B lymphocytes with high PNA fluorescence intensity are indicated in the box.
Discussion
The observation that treatment in hot formamide can fix cells, denature DNA and allow entrance and hybridization of a PNA probe was originally reported by the Terry Fox research group 12. In our laboratory, we subsequently demonstrated that, at least with respect to telomeric sequences, DNA confined in the nuclear microvolume is not able to re‐nature even after removal of the formamide and return to the room temperature. Thus, the fluorescent PNA probe can be added after thermal stress preserving its quantum efficiency and simultaneously reducing non‐specific binding of several cell compartments. As a result, probe hybridization increases in efficiency, specificity, and proportionality, improving FF measures of telomere length 6. Some years after publication of the original observations, the above‐cited group reviewed the protocol and modified some of its technical features 13. Similarly here, we have re‐examined technical steps to further improve resolving power of our protocol.
First, we confirmed our previous observation that telomeric sequences denatured in preserved nuclei, cannot re‐nature, and we demonstrated that these sequences remain accessible to the PNA probe for up to 6 days after formamide removal. Hence, the permeabilization/denaturation step in hot formamide can be considered to be a partial fixation step; the sample can be stored for some days, but microscopic examination of treated cells shows some cytoplasmic lost.
Notwithstanding ability of PNA to hybridize to the heat formamide denatured DNA, after complete removal of formamide, resolution power of our FF protocol was considerably increased by addition of ionizing solvent in hybridization solution and during stringency washes.
Obtained telomere measures had good correlation with reliable TRF data achieving, in samples with a wide range of telomere lengths, a coefficient of determination >0.98. During optimization of our protocol, we constantly obtained a remarkable difference between TRF and FF measures of Daudi telomeres (2.2 kbp and ≈6 kbp respectively). This discrepancy can be explained by the reported telomeric sequences of EBV episomal DNA 10 abundantly present in this human Burkitt's lymphoma‐derived cell line 8, 9. Such short repeats cannot be detected by TRF electrophoretic analysis of isolated and digested DNA; on the contrary, by FF procedure, episomal DNA remains within cells and contributes to fluorescence intensity of the sample.
In the updated protocol, we completely changed treatment of negative control cells hybridized and acquired together with the heat‐denatured counterpart of the sample. This allowed higher reliability of autofluorescence and aspecific binding measure. Furthermore, comparison of samples analysed in the same or in different acquisition sessions was more accurate, thanks to the instrument being set to acquire negative control always in the same fluorescence channels.
For normalization of PNA fluorescence intensity, we replaced DNA index with number of chromosome ends: same samples (e.g. the Ramos cell line) may have variations in total DNA content that do not involve telomeric ends. Increased specificity of PNA binding and ameliorated stoichiometric staining of genomic DNA allowed kinetic analysis of total and telomeric DNA duplication directly in the three phases of cell cycle. Regions corresponding to G1‐G0, S and G2‐M phases could be drawn automatically by the same software used for deconvolution of Eth‐Br histograms.
When applied to T and B lymphocytes, the procedure indicated that B cell telomeres were longer than T cell telomeres with mean difference in the order of 2.5 kbp – significantly greater than as we have previously reported 6, 14. Furthermore, distribution of fluorescence of B lymphocytes purified from healthy donors, regularly revealed cells with very long telomeres, not previously reported in the literature. These results induce further investigation on resting and/or stimulated lymphocytes from primary or secondary immunodeficiencies, genome instability syndromes 15, Down syndrome 16 and inherited genetic disorder dyskeratosis congenitalis 17, 18.
Finally, we also tried to conjugate FF with immunostaining 19 and a dye dilution method 20, but only obtaining inconsistent results, probably due to the above‐described loss in cytoplasmic material.
Thanks to the modifications described, FF analysis of cell lines with different DNA content and telomere lengths appeared to be least as suitable as the TRF method. Measures obtained by the latter procedure can be affected by chromosome end variability, detrimental genomic DNA fragmentation, incomplete digestion and unsuitable electrophoretic system. In contrast, the FF technique analyses telomeric sequences confined into preserved nuclei thus overcomes most of these limitations and can potentially reach better resolution power.
References
- 1. Hultdin M, Grönlund E, Norrback K‐F, Eriksson‐Lindström E, Just T, Roos G. (1998) Telomere analysis by fluorescence in situ hybridization and flow cytometry. Nucleic Acids Res. 26, 3651–3656. [DOI] [PMC free article] [PubMed] [Google Scholar]
- 2. Derradji H, Bekaerts S, Van Oostveldt P, Baatout S (2005) Comparison of different protocols for telomere length estimation by combination of quantitative fluorescence in situ hybridization (Q‐FISH) and flow cytometry in human cancer cell lines. Anticancer Res. 25, 1039–1050. [PubMed] [Google Scholar]
- 3. Sambrook J, Russell DW (2001) Molecular Cloning a Laboratory Manual, 3rd edn Cold Spring Harbor, NY: Cold Spring Harbor Laboratory Press. (3a: v.1, 5.6; 3b: v.1, 6.28; 3c: v.1, 5.55). [Google Scholar]
- 4. Mochida A, Gotoh E, Senpuku H, Harada S, Kitamura R, Takahashi T et al (2005) Telomere size and telomerase activity in Epstein‐Barr virus (EBV)‐positive and EBV‐negative Burkitt's lymphoma cell lines. Arch. Virol. 150, 2139–2150. [DOI] [PubMed] [Google Scholar]
- 5. Jeyapalan JC, Saretzki G, Leake A, Tilby MJ, von Zglinicki T (2006) Tumor‐cell apoptosis after cisplatin treatment is not telomere dependent. Int. J. Cancer 118, 2727–2734. [DOI] [PubMed] [Google Scholar]
- 6. Carbonari M, Mancaniello D, Cinati M, Catizone A, Fiorilli M (2010) Improved procedure for the measurement of telomere length in whole cells by PNA probe and flow cytometry. Cell Prolif. 43, 553–561. [DOI] [PMC free article] [PubMed] [Google Scholar]
- 7. Baerlocher GM, Lansdorp PM (2003) Telomere length measurements in leukocyte subsets by automated multicolor flow‐FISH. Cytometry Part A 55A, 1–6. [DOI] [PubMed] [Google Scholar]
- 8. Jones MD, Foster L, Sheedy T, Griffin BE (1984) The EB virus genome in Daudi Burkitt's lymphoma cells has a deletion similar to that observed in a non‐transforming strain (P3HR‐1) of the virus. EMBO J. 3, 813–821. [DOI] [PMC free article] [PubMed] [Google Scholar]
- 9. Uphoff CC, Denkmann SA, Steube KG, Drexler HG (2010) Detection of EBV, HBV, HCV, HIV‐1, HTLV‐I and –II, and SMRV in human and other primate cell lines. J. Biomed. Biotechnol. 2010, 1–23. [DOI] [PMC free article] [PubMed] [Google Scholar]
- 10. Riethman H, Ambrosini A, Paul S (2005) Human subtelomere structure and variation. Chromosome Res. 13, 505–515. [DOI] [PubMed] [Google Scholar]
- 11. Hodes RJ, Hathcock KS, Weng N (2002) Telomeres in T and B cells. Nat. Rev. Immunol. 2, 699–706. [DOI] [PubMed] [Google Scholar]
- 12. Dragowska V, Rufer N, Martens U, Brummendorf T, Thornbury G, Lansdorp PM (1998) Measurement of DNA repeat sequences by flow cytometry. Cytometry 9(Suppl), 51. [Google Scholar]
- 13. Baerlocher GM, Mak J, Tien T, Lansdorp PM (2002) Telomere length measurement by fluorescence in situ hybridization and flow cytometry: tips and pitfalls. Cytometry 47, 89–99. [DOI] [PubMed] [Google Scholar]
- 14. Visentini M, Cagliuso M, Conti V, Carbonari M, Mancaniello D, Cibati M et al (2011) Telomere‐dependent replicative senescence of B and T cells from patients with type 1a common variable immunodeficiency. Eur. J. Immunol. 41, 854–862. [DOI] [PubMed] [Google Scholar]
- 15. Callen E, Surralles J (2004) Telomere dysfunction in genome instability syndromes. Mutat. Res. 567, 85–104. [DOI] [PubMed] [Google Scholar]
- 16. Jenkins EC, Ye L, Gu H, Ni SA, Velinov M, Pang D et al (2010) Shorter telomeres may indicate dementia status in older individuals with Down syndrome. Neurobiol. Aging 31, 765–771. [DOI] [PMC free article] [PubMed] [Google Scholar]
- 17. Mitchell JR, Wood E, Collins K (1999) A telomerase component is defective in the human disease dyskeratosis congenital. Nature 402, 551–555. [DOI] [PubMed] [Google Scholar]
- 18. Heiss NS et al (1998) X‐linked dyskeratosis congenital is caused by mutations in a highly conserved gene with putative nucleolar functions. Nat. Genet. 19, 32–38. [DOI] [PubMed] [Google Scholar]
- 19. Schmid I, Dagarag MD, Hausner MA, Matud JL, Just T, Effros RB et al (2002) Simultaneous flow cytometric analysis of two cell surface markers, telomere length, and DNA content. Cytometry 49, 96–105. [DOI] [PubMed] [Google Scholar]
- 20. Potter AJ, Wener MH (2005) Flow cytometric analysis of fluorescence in situ hybridization with dye dilution and DNA staining (flow‐FISH‐DDD) to determine telomere length dynamics in proliferating cells. Cytometry A 68, 53–58. [DOI] [PubMed] [Google Scholar]


