

Abstract
Objectives: Hypoxia‐inducible factor 1α (HIF‐1α) is a pivotal regulator of hypoxic and ischaemic vascular responses that drives transcriptional activation of hundreds of genes involved in vascular reactivity, angiogenesis and arteriogenesis. Previous reports based on gene knockout technology have demonstrated that HIF‐1α can promote osteogenesis. However, this protein is easily degraded in a normoxic state, which makes in vitro studies of HIF‐1α‐induced mesenchymal stem cell (MSC) osteogenesis difficult. For better understanding of HIF‐1α promoting osteogenesis, the role of HIF‐1α‐induced MSC osteogenesis in the normoxic state has been investigated here.
Materials and methods: HIF‐1α was made to overexpress using a lentiviral vector, and its effects on bone marrow‐derived mesenchymal stem cell (BMSC) osteogenesis were investigated. Real‐time quantitative and western blotting (to assess expression levels of angiogenic and osteogenic related genes regulated by Lenti‐HIF‐1α), alkaline phosphatase (ALP) and alizarin red‐S staining analyses, were performed.
Results: In HIF‐1α gene‐transfected BMSCs, expression levels of angiogenic, cartilaginous and osteogenic genes were all increased significantly compared to Lenti LacZ‐transfected cells, at both mRNA and protein levels. ALP activity and alizarin red‐S staining were significantly enhanced in HIF‐1α transduced cells compared to control cells, on day 21.
Conclusions: These results indicate that Lenti‐HIF‐1α can induce BMSC overexpression levels of angiogenic and osteogenic genes in vitro in the normoxic state. Further study will be focused on whether HIF‐1α can also improve bone repair in vivo.
Introduction
Loss of bone is mainly caused by pathological events such as trauma, inflammation and surgical treatment of tumours (1). Gene therapy has been intensively used for bone regeneration since the first proteins capable of inducing de novo bone formation were discovered (2). More recently, gene therapy has been investigated as a non‐traditional approach for bone‐loss repair.
Hypoxia‐inducible factor (HIF)‐1α is an active nucleoprotein whose expression is induced by hypoxic conditions, and it acts to both enhance production of corresponding proteins and launch the process of angiogenesis by binding to hypoxia response elements (3). With activation of prolyl hydroxylase in a normoxic state, HIF‐1α proline residues 402 and 564 are hydroxylated, and hydroxylated HIF‐1α can associate with the von Hippel‐Lindau tumour suppressor protein (pVHL). This association allows HIF‐1α protein to be directed to the proteasome for degradation after ubiquitination (4). Under hypoxic conditions, HIF‐1α protein cannot be hydroxylated and bound by pVHL; thus, its degradation by the proteasome is inhibited, and its concentration increases significantly (5, 6). Besides HIF‐1α protein, HIF‐2α protein whose sequence bears similarity to HIF‐1α, has been characterized (7). HIF‐1α and HIF‐2α have similar protein structures and they undergo the same oxygen‐dependent proteolysis. However, the pattern of expression of HIF‐2α is largely restricted to blood vessels, neural crest and distinct cell populations in the brain, heart, lung, kidney, liver, pancreas and intestine, whereas HIF‐1α is expressed in all cells (8).
Bone marrow‐derived mesenchymal stem cells (BMSCs) are multipotent stem cells that can differentiate into bone, cartilage and adipose cells as well as into many other cell types. In vivo and in vitro evaluations have demonstrated differentiation of BMSCs along these lineages under the influence of local stimuli, in many pre‐clinical models, and the osteogenic capacity of BMSCs has also been studied (9, 10). Use of gene‐modified stem cells in the context of gene therapy is an attractive option due to theoretical advantages of using stem cells instead of somatic cells, including higher proliferative capacity and long‐term survival of stem cells. Genetically modified BMSCs can deliver genes or proteins into specific organs or tissues that require gene therapy. Gene therapy using HIF‐1α as the target gene has two major advantages: (i) HIF‐1α can regulate many downstream genes, such as those of vascular endothelial growth factor (VEGF) and transforming growth factor‐β (TGF‐β) and (ii) gene therapy with HIF‐1α poses lower risk of angioma (11).
Angiogenesis and osteogenesis are tightly coupled during bone development and regeneration (12). Blood vessels not only carry oxygen and nutrients to the bone but also deliver critical signals to the stroma that stimulate mesenchymal cell specification and promote bone formation (13). As a gene that acts upstream of TGF‐β and VEGF, HIF‐1α gene has advantages over downstream genes. Therefore, transplantation of HIF‐1α‐modified BMSCs into a bone defect area may have a synergic effect in bone regeneration and angiogenesis that may contribute to a better outcome than gene therapy alone.
Materials and methods
Culture of rat BMSCs
Four‐week‐old male Fisher 344 rats of 40 ± 5 g in weight were obtained from the Tongji University Medical School Animal Center (Shanghai, China). Animal use was compliant with official Chinese guidelines and was assessed by the local Internal Evaluation Committee for Animal Welfare and Rights. Rat BMSCs were isolated and cultured according to the protocol reported by Maniatopoulos et al. (14). Briefly, all rats were sacrificed by intraperitoneal overdose of sodium pentobarbital (200 mg/kg). Both ends of femora were cut off at the epiphysis and marrow was flushed out using Dulbecco’s modified Eagle’s medium (DMEM) (Gibco BRL, Grand Island, NY, USA) containing 23 mm NaHCO3 (Gibco Biocult, Paisley, UK) supplemented with 10% heat‐inactivated foetal bovine serum (FBS) (Gibco Biocult) and antibiotics (50 μg/ml streptomycin sulphate, 100 U/ml penicillin). Cells were cultured in DMEM at 37 °C in a humidified 5% CO2 incubator.
Lenti‐HIF‐1α construction
Lenti‐HIF‐1α was made to overexpress using replication‐defective lentivirus that encodes green fluorescent protein (GFP), and a specific form of HIF‐1α. RNA was extracted according to the protocol provided in the PrimeScriptTM RT reagent Kit (TaKaRa Code: DRR037A) instructions. cDNA was synthesized using Reverse Transcription System Kit (Invitrogen, Carlsbad, CA, USA) following the manufacturer’s instructions. Primers for PCR were designed through NCBI and were based on Fisher 344 rat HIF‐1α mRNA sequences from GenBank (NM_024359.1). The Fisher 344 rat‐specific primers for HIF‐1α mRNA were designed using Oligo software; length of the amplified segment was 2480 bp. HIF‐1α was subcloned into the pDONR221 vector, and LR recombination system was used to add pDONR221‐HIF‐1α to the viral vector plenti6.3V5‐DEST. The recombinant plasmid was transfected into 293T cells for lentivirus production at 50 plaque‐forming units (pfu) per cell, based on total cell number from a replicate plate. Under these conditions, approximately 100% of cells were infected based upon GFP expression, as determined by fluorescence microscopy and flow cytometry (Lenti‐HIF‐1α and Lenti‐LacZ) 72 h after infection.
Gene transfection into BMSCs
BMSCs were transfected with the lentivirus overexpressing HIF‐1α (Lenti‐HIF‐1α and Lenti‐LacZ) at multiplicity of infection (MOI = 15 pfu/cell) of 15 pfu/cell. Cell morphology was evaluated by microscopy (Leica DM 1RB, Hamburg, Germany), and transfection efficiency was determined using inverted fluorescence microscopy (OLYMPUS IX71‐F22FL/PH, Tokyo, Japan) 4 days after transfection with Lenti‐HIF‐1α and Lenti‐LacZ, by calculating number of green cells among all cells observed. Transfection efficiency was analysed by flow cytometry. An immunofluorescence HIF‐1α antibody (HIF‐1α in cell cytospin, red dye) and DAPI (blue dye, used to stain nuclei,) were used to detect location of transfected genes, by their proteins, in the cells. During this process, hypoxia (0.5% oxygen for 24 h)‐treated BMSCs were regarded as positive control to indicate expression of endogenous HIF‐1α.
Alkaline phosphatase
BMSCs transfected with Lenti‐HIF‐1α or Lenti‐LacZ and untransfected BMSCs were plated on six‐well plates at a density of 105 cells/well and were cultured in DMEM until they were confluent. Next, they were evaluated for alkaline phosphatase (ALP) and alizarin red‐S staining on days 14 and 21 after transfection. Histochemical staining for ALP activity was performed using naphthol AS‐MX phosphate (Sigma‐Aldrich, St. Louis, Mo. USA) as substrate and fast red TR salt as coupler; semi‐quantitative analysis of ALP was performed. Procedures were as follows: first, cells were rinsed three times in phosphate‐buffered saline (PBS) and split using Triton X‐100. Total protein content was then determined with the BCA method, on aliquots of the same samples, with the Pierce (Rockford, IL, USA) protein assay kit. ALP activity was determined at 405 nm using p‐nitrophenyl phosphate (Sigma, St Louis, MO, USA) as substrate (15). ALP levels were normalized to total protein content at the end of the experiment. All procedures were conducted in triplicate.
Alizarin red‐S staining
BMSCs were evaluated using alizarin red‐S (ARS) on days 14 and 21 after transfection. Cell cultures achieved were washed twice in PBS, fixed for 1 h in ice‐cold 70% ethanol and rinsed twice in deionized water. Cultures were stained for 30 min with alizarin red‐S (16). Presence of calcium deposits was demonstrated by formation of red nodules. Semi‐quantitative analysis of ARS was carried using the procedure as follows: cells (Lenti‐HIF‐1α or Lenti‐LacZ and untransfected) were washed three times in PBS and fixed in ice cold 70% ethanol for 1 h. Then they were stained with ARS (40 mm) for 20 min at room temperature. Stain was desorbed by use of 10% cetylpyridinium chloride (Sigma) for 1 h. Solutions were collected and distributed as 100 μl/well on 96‐well plates for absorbance reading at 590 nm by spectrophotometry (Thermo Spectronic, California, USA).
Real‐time quantitative‐PCR (RT‐qPCR) analysis
Total cell RNA extraction was performed on days 0, 1, 4, 7, 14 and 21 after gene transduction using RNeasy Mini kit (Qiagen, Hilden, Germany). Quantity and quality of RNA obtained were checked by spectrophotometric analysis using the Eppendorf Biophotometer Plus; ratio of absorbance at 260 and 280 nm (A 260/A 280) was used to assess purity of RNA and A 260/A 280 to ∼2 was controlled. Quality of RNA was calculated as 40 μg/l A 260. Reverse transcription was carried out using 1 μg total RNA in final volume of 20 μl using PrimeScript RT reagent kit (Takara Bio, Shiga, Japan) according to the manufacturer’s recommendations. Gene‐specific primers were synthesized commercially (Shengong Co. Ltd., Shanghai, China) and the genes, accession numbers, primer sequences and amplicon sizes are listed in Table 1. Amplicons obtained with each of the primer pairs were verified by sequencing. Analysis involved calculating relative expression levels of blood vessel and bone marker genes in test samples, compared to expression in control samples, that is, BMSCs transduced with Lenti‐LacZ, on days 0, 1, 4, 7, 14 and 21 (n = 6); all values were normalized to GAPDH. All experiments were performed in triplicate and results are reported as average ± SD.
Table 1.
Nucleotide sequences for real‐time RT‐PCR primers
| Genes | Primer sequence (5′‐3′) (forward/reverse) | Product size (bp) | Annealing temperature (°C) | Accession number |
|---|---|---|---|---|
| HIF‐1α | CCCTACTATGTCGCTTTCTTGG | 199 | 60 | NM_024359.1 |
| GTTTCTGCTGCCTTGTATGGG | ||||
| VEGF | GGCTCTGAAACCATGAACTTTCT | 165 | 60 | NM_031836.2 |
| GCAATAGCTGCGCTGGTAGAC | ||||
| OCN | CAGTAAGGTGGTGAATAGACTCCG | 172 | 60 | NM_013414.1 |
| GGTGCCATAGATGCGCTTG | ||||
| COL‐1 | GGTCCCAAAGGTGCTGATGG | 182 | 60 | NM_053304.1 |
| GACCAGGCTCACCACGGTCT | ||||
| BSP | TGGATGAACCAAGCGTGGA | 162 | 60 | NM_012881.2 |
| TCGCCTGACTGTCGATAGCA | ||||
| ALP | GTCCCACAAGAGCCCACAAT | 172 | 60 | NM_013059.1 |
| CAACGGCAGAGCCAGGAAT | ||||
| Cbfa1 | TCTTCCCAAAGCCAGAGCG | 154 | 60 | NM_053470.1 |
| TGCCATTCGAGGTGGTCG | ||||
| Osteonectin | GCTTCCTGCTCATCAATCGTAAC | 120 | 60 | NM_138827.1 |
| TCATCTGCCGACCCTCTTCT | ||||
| GAPDH | GGCAAGTTCAACGGCACAGT | 76 | 60 | NM_017008.3 |
| GCCAGTAGACTCCACGACAT |
Western blot analyses
Cells (105/well) were seeded into six‐well plates 1 day before transfection. Total protein was harvested from cultured cells on days 0, 1, 4, 7, 14 and 21 after gene transduction. Cells were washed twice in PBS and incubated in 200 μl lysis buffer (20 mm Tris–Cl, 150 mm NaCl, 1% Triton X‐100, 1 mm EDTA, 2 mm sodium orthovanadate, 50 mm sodium fluoride, 2 μg/ml pepstatin A, 10 μg/ml aprotinin and 10 μg/ml leupeptin) on ice for 30 min, with occasional agitation. Cells were then scraped into microfuge tubes and centrifuged for 10 min at 10 000 g. Concentration of protein was measured using the Dc protein assay kit (Invitrogen). Equal amounts of cell lysates were separated on duplicate 8–10% SDS–PAGE gels and transferred to polyvinylidene difluoride membranes (0.45 μm; Millipore, Bedford, MA, USA). Membranes were blocked with 5% skim milk in Tween Tris‐buffered saline (TTBS) (137 mm NaCl, 2.7 mm KCl, 4.3 mm Na2HPO4, 1.4 mm K2HPO4, 0.1% Tween‐20) at room temperature on a shaker for 1 h. Blocked membranes were incubated overnight in mouse monoclonal antibody to HIF‐1α protein (ab85886, Abcam, Inc., AC, Cambridge, UK), diluted to 1:600 with TTBS containing 5% skim milk. After washing in TTBS, membranes were incubated in horseradish peroxidase (HRP)‐conjugated secondary antibody (GE Healthcare Bio‐Sciences, Uppsala, Sweden) at 1:3000 dilution for 1 h. ECL Plus Western Blotting detection reagent (GE Healthcare Bio‐Sciences) was used for detection of immunoreactive products. Protein bands were visualized using the Amersham Pharmacia Biotech Enhanced Chemiluminescence system and Kodak X‐OMAT film (Rochester, NY, USA). The same procedure was followed on reaction products of the following antibodies, including to VEGF (mouse monoclonal to VEGF, diluted to 1:1000 primary antibody and 1:3000 secondary antibody, ab46154; Abcam, Inc.), osteocalcin (OCN) (mouse monoclonal to OCN, diluted to 1:1500 primary antibody and 1:3000 secondary antibody, ab13418; Abcam, Inc.), bone sialoprotein (BSP) (rabbit polyclonal to BSP, diluted to 1:1500 primary antibody and 1:3000 secondary antibody, ab52128, Abcam, Inc.), and Cbfa1 (rabbit polyclonal to Cbfa1, diluted to 1:200 primary antibody and 1:3000 secondary antibody, SC‐10758, Santa Cruz Biotechnology Inc., Santa Cruz, CA, USA). Autoradiographs were quantified by densitometry using Scan Image software. Relative protein levels were calculated as ratio of level of protein of interest to level of β‐actin, in each sample.
Statistical analysis
All data are presented as mean ± SEM. Paired samples of groups were compared using Student’s t‐test. Multiple comparisons within and between groups were determined by one‐way ANOVA for multiple comparison. P‐value <0.05 was considered statistically significant (*P < 0.05 or **P < 0.01).
Results
Characterization of BMSCs
Mononuclear cells were isolated from rat bone marrow and cultured in uncoated dishes in DMEM with 10% FBS to isolate BMSCs. By passage 3, a homogenous population of rapidly dividing cells with fibroblastoid morphology was obtained. Analysis by flow cytometry confirmed high expression of CD90 (99.7%) and CD105 (98.7%) (Fig. 1A), as previously described for human MSCs (17), whereas myeloid/haematopoietic marker CD34 (16.9%) and endothelial cell marker CD31 (18.8%) were rarely detected (Fig. 1A).
Figure 1.
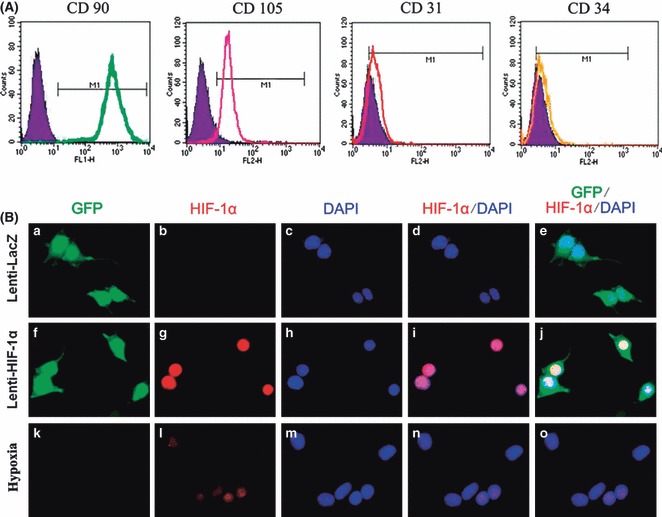
Characterization of F344 rat BMSCs and Lenti‐HIF‐1α‐ transduced BMSCs. (A) Flow cytometry analysis of cell surface markers CD90, CD105, CD31 and CD34. (B) a, f, k, detection of green fluorescent protein (GFP); b, g, l, detection of HIF‐1α; c, h, m, DAPI staining to locate the nucleus; d, I, n, detection of HIF‐1α + DAPI staining; e, j, o, detection of GFP and HIF‐1α + DAPI staining; hypoxia (0.5% oxygen for 24 h)‐treated BMSCs as positive control to indicate expression of endogenous HIF‐1α.
Gene transduction and HIF‐1α expression
Through a set of preliminary experiments using various doses of lentivirus, we found that MOI (multiplicity of infection) of 15 resulted in optimal transfection efficiency without excessive cell death in vitro. One day after transduction, observation using inverted fluorescence microscopy and analysis by flow cytometry showed that approximately 70% of BMSCs were green (data not shown). Overexpression of HIF‐1α was detected in the Lenti‐HIF‐1α group by immunofluorescence. Compared to Lenti‐LacZ and hypoxia‐treated BMSC groups, expression of HIF‐1α was significantly enhanced in the Lenti‐HIF‐1α‐transduced group (Fig. 1B).
Osteogenic differentiation of BMSCs
BMSCs transduced with Lenti‐HIF‐1α or Lenti‐LacZ were plated in six‐well plates (105 cells/well) and cultured in DMEM. On days 14 and 21 after gene transduction, ALP expression was significantly enhanced in the HIF‐1α‐transduced group (Fig. 2a). Semi‐quantitative analysis of ALP showed that ALP activity in BMSCs transduced with Lenti‐HIF‐1α was 2–3 fold higher than the other two groups, on days 14 and 21 respectively (Fig. 2b). In addition, alizarin red‐S staining on days 14 and 21 revealed a significant increase in calcium nodules (Fig. 2c). Furthermore, semi‐quantitative analysis confirmed the result on days 14 and 21 (Fig. 2d). These results show that HIF‐1α gene promoted differentiation of BMSCs into osteoblasts.
Figure 2.
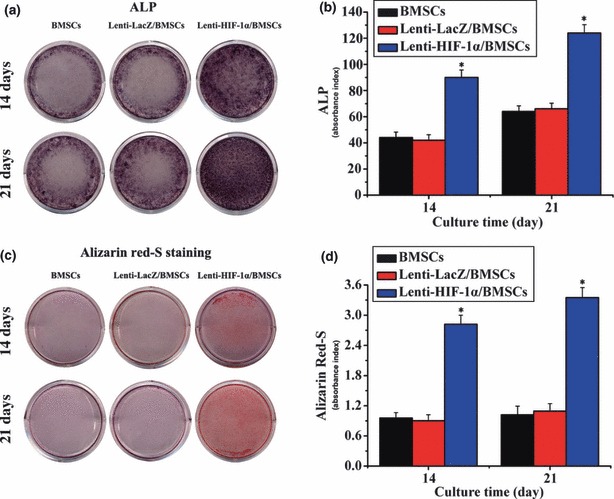
The expression of ALP and alizarin red‐S staining. (a) ALP expression in gene‐modified BMSCs. (b) ALP activity in BMSCs transduced with Lenti‐HIF‐1α was notably higher than that in control groups (*P < 0.05). (c) Result of alizarin red‐S staining was in accordance with ALP staining. (d) Results of semi‐quantitative analysis of ARS were in accordance with alizarin red‐S staining. Absorbance index in target gene group was significantly higher than in untransduced and LacZ groups (*P < 0.05).
RT‐qPCR analysis of gene expression induced by HIF‐1α
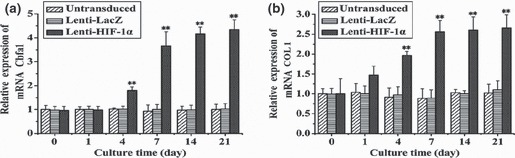
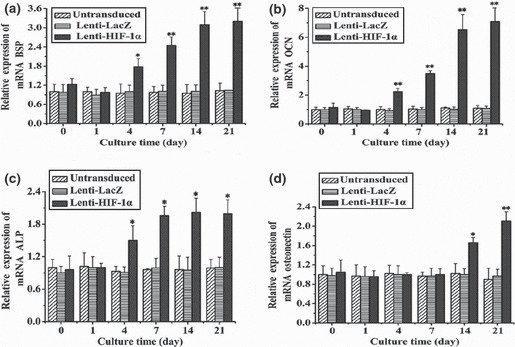
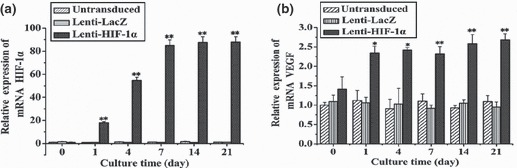
To detect expression of angiogenic and osteogenic genes in BMSCs, RT‐qPCR was carried out at defined time points (days 0, 1, 4, 7, 14 and 21). Levels of key angiogenic and osteogenic gene transcripts were dramatically different among the various groups. In HIF‐1α‐transduced BMSCs, transcript level for VEGF showed initial upregulation on day 1, and notable increase was observed from day 7 to day 21 (Fig. 3). Expression of Cbfa1 had marked enhancement on day 4 and a sustained increase from day 7 to day 21 (Fig. 4a). Type I collagen (COLI), whose expression promotes mineralization and reinforces bone strength in bone formation, demonstrated initial upregulation on day 1 that was markedly enhanced on day 4 (Fig. 4b). BSP showed a slight increase on day 4 that was markedly enhanced on day 7 (Fig. 5a). OCN, a mature‐stage bone marker, showed substantial upregulation on day 4, steadily increasing to more than 6‐fold increase by day 14 (Fig. 5b). ALP, another non‐specific bone marker, moderately increased from day 4 to day 21 (Fig. 5c). However, osteonectin, a glycoprotein of bone that binds calcium and initiates mineralization, was not upregulated until later, on day 14 (Fig. 5d). In comparison, transcripts of osteogenic markers in Lenti‐LacZ‐transduced and untransduced BMSCs remained at basal levels after 21 days. Taken together, these data support presence of an osteoinductive effect induced by HIF‐1α.
Figure 3.
Relative mRNA expression of HIF‐1α and VEGF in BMSCs (transduced with the target gene) at different time points. (a) Expression of HIF‐1α at different time points (0, 1, 4, 7, 14 and 21 days). (b) Expression change of VEGF in BMSCs was in a time‐dependent manner, which showed significant difference between days 1 and 4 (*P < 0.05) and extremely striking differences was observed after day 7 (**P < 0.01).
Figure 4.
mRNA expression of transcription factor and collagen fibre for bone formation in BMSCs transduced with the target gene, at different time points. (a) Cbfa1 gene expression at different time points. After day 7, expression of RNA was markedly enhanced (**P < 0.01). (b) After transduction with the target gene, RNA expression of COL1 was enhanced compared to cells transduced with LacZ or those that were untransduced (**P < 0.01).
Figure 5.
mRNA expression of osteogenic markers at different time points in BMSCs transduced with HIF‐1α gene. (a) BSP gene expression at different time points. After 7 days, expression of RNA was notably enhanced (**P < 0.01). (b) After transduction with the target gene, RNA expression levels of OCN were enhanced after 4 days (**P < 0.01). (c) ALP levels increased after 4 days (*P < 0.05). (d) Osteonectin was only overexpressed after 14 days in BMSCs transduced with the target gene (*P < 0.05). At day 21, osteonectin was strikingly upregulated (**P < 0.01).
Osteogenic protein expression in HIF‐1α‐induced BMSCs
Protein was obtained from gene‐modified BMSCs and results of analysing various protein levels were in accordance with the qPCR data. After gene transduction, HIF‐1α could be detected on days 0, 1, 4, 7, 14 and 21 in both HIF‐1α‐ and LacZ‐transduced groups. Quantitative analysis revealed 20‐ to 55‐fold increase in the HIF‐1α‐transfected group; this difference was significant (Fig. 6a). In addition, we investigated whether VEGF was also upregulated via the HIF‐1 pathway. Results showed that expression of VEGF was increased 2‐ to 7‐fold in HIF‐1α‐transfected group compared to LacZ group (Fig. 6b). Similar results were observed for Cbfa1, BSP, and OCN (Fig. 7a–c). These data indicated that HIF‐1α could enhance expression of osteogenic and angiogenic proteins in BMSCs in vitro.
Figure 6.
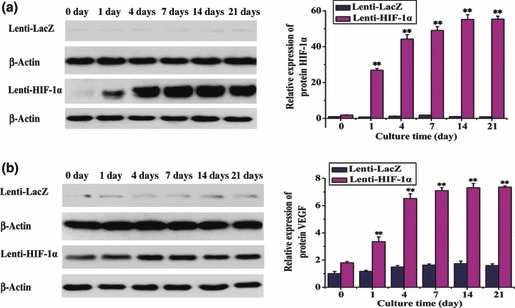
Protein expression of HIF‐1α and VEGF in BMSCs transduced with the target gene at different time points. (a) Protein expression of the target gene was markedly enhanced on day 1 in BMSCs transduced with Lenti‐HIF‐1α, and even more so after 4 days (**P < 0.01). (b) Similar to HIF‐1α, VEGF protein was overexpressed on day 1 after BMSCs were transduced with HIF‐1α (**P < 0.01).
Figure 7.
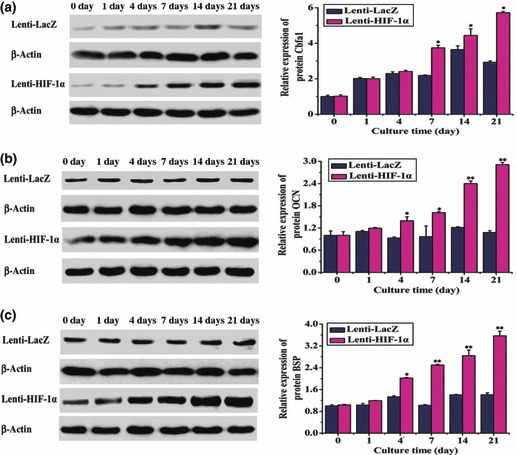
Protein expression levels of osteogenic factors in BMSCs (transduced with the target gene) at different time points (0, 1, 4, 7, 14 and 21 days). (a) Cbfa1 was overexpressed at day 4 after transduction with HIF‐1α, with the increase being statistically significant after day 7 (*P < 0.05). (b) OCN was expressed in BMSCs transduced with HIF‐1α, however, OCN was initially upregulated in BMSCs transduced with the target gene at day 4 (*P < 0.05) and was markedly overexpressed after day 14 (**P < 0.01). (c) BSP was overexpressed on day 4 (*P < 0.05) and was strikingly upregulated after day 7 in BMSCs transduced with HIF‐1α (**P < 0.01).
Discussion
In this study, evidence has been presented in terms of both mRNA and protein levels that show that enhanced angiogenesis and osteogenesis could be obtained by the presence of HIF‐1α under non‐hypoxic conditions in vitro. HIF‐1α is a transcription factor that regulates hundreds of genes in response to hypoxia, to maintain physiological oxygen homeostasis (3). Besides HIF‐1α, HIF‐2α and HIF‐3α have sequence similarity to HIF‐1α (9). HIF‐1α and HIF‐2α may be functionally redundant, at least in some settings, because of the similar protein structure and undergoing the same oxygen‐dependent proteolysis (18). However, HIF‐1α is expressed in almost all types of cells, while HIF‐2α is largely restricted to some certain tissue, such as blood vessels and neural crest. Moreover, HIF‐1α knockout mice die at early stages of embryonic development, while HIF‐2α‐gene deficient mice survive longer (19, 20, 21, 22, 23). These two isoforms therefore seem to have distinct developmental functions. HIF‐3α is not closely related to HIF‐1α and HIF‐2α (24), this protein acts as a negative regulator of HIF‐mediated gene expression (25). Under hypoxic conditions, HIF‐1α accumulates and translocates to the nucleus, where it promotes expression of hypoxia‐responsive genes (26). These genes include those involved in angiogenesis, maturation of red blood cells, energy metabolism, and cell proliferation and viability (27). Recently, one group has reported that expression of both HIF‐1α and HIF‐2α by osteoblasts is required for long bone development (28). HIF‐2α is also believed to be crucial for ossification and cartilage development, thus, it may represent a therapeutic target to alleviate osteoarthritis (29). Direct transcriptional targets of HIF‐2α include type X collagen (COL10A1), matrix metalloproteinase‐13 (MMP‐13) and (VEGF) (30).
In this study, characterization of BMSCs was confirmed by flow cytometry (Fig. 1A). Apart from CD‐markers, capacity to differentiate into chondrocytes, osteocytes and adipocytes is a typical standard for BMSC identification (not shown). Lenti‐HIF‐1α was transduced into BMSCs to maintain continuous expression of HIF‐1α under non‐hypoxic conditions (31). The main advantage of lentiviral delivery of the gene is efficient integration of this novel genetic material into the host genome. In addition, frequency of lentiviral transduction of target cells is far better than that using non‐viral vectors (32), data from this study showed that frequency of transduction could reach over 90%. Expression of endogenous HIF‐1α has been shown in hypoxia‐treated BMSCs (0.5% oxygen for 24 h), and overexpression of the target gene was observed in HIF‐1α‐transduced cells compared to Lenti‐LacZ and hypoxia‐treated groups (Fig. 1B); cell replication was not affected. ALP and alizarin red‐S staining indicated early osteogenic differentiation and production of mineralized matrix nodules. The results showed increased ALP activity and significant enhancement of mineralized matrix nodules in HIF‐1α‐ transduced cells compared to control cells on day 21. Furthermore, the results of semi‐quantitative analysis proved HIF‐1α could promote differentiation of the BMSCs into osteoblasts. These data are consistent with results obtained from analysis of mRNA and protein levels.
VEGF, which plays a critical role in angiogenesis, endochondral bone formation and bone repair, was upregulated in HIF‐1α‐transduced groups compared to control groups. In this study, mRNA and protein levels of Cbfa1 and COLI were remarkably increased (Fig. 3a,b). Cbfal is an essential transcription factor for bone formation and COLI is a major collagen of tendon and bone, and is essential for providing the tensile strength of bone. Final amounts and distribution of these collagen fibres determine size, shape and ultimate density of bone. Detection of other osteogenic markers, such as ALP, BSP, OCN and osteonectin, showed marked increase when BMSCs were transfected with the target gene. In contrast, in Lenti‐LacZ‐transduced or untransduced BMSCs, expression of the aforementioned genes was maintained at their typical low level. ALP is considered to be an early marker of osteoblast differentiation (33), and BSP is an acidic, secreted extracellular matrix glycoprotein that plays a vital role in bone mineralization, cell–matrix interactions and collagen binding (34). OCN is regarded as the most specific and latest described marker of osteogenic differentiation (35). However, mechanisms by which these osteogenic factors are overexpressed in HIF‐1α‐induced BMSCs are not currently clear and therefore require further investigation.
Based on the above data, HIF‐1α seems able to regulate expression of osteogenic and angiogenic factors under normoxic conditions in vitro. However, angiogenesis and osteogenesis are tightly coupled during bone development and regeneration (36). It has been confirmed that cells transfected with genes including those for VEGF, RUNX2, BMP‐2 and HO‐1 can repair blood and bone defects using tissue engineering approaches, in experimental and clinical studies (37, 38, 39). VEGF, Ang‐2 and HO‐1 genes are downstream of HIF‐1α, thus, transfection of HIF‐1α into BMSCs provides more advantages compared to transfection of any single downstream gene (18), currently, there are only few reports that involve this concept for therapy. However, based on our described results, we will continue our studies in vivo. It is not surprising that there is great interest in devising therapeutic strategies to increase HIF‐1α activity as a means of treating bone defects in the clinic; one tissue engineering approach involves genetic modification of cells that would subsequently be seeded on to (or into) scaffolds, prior to implantation. In this approach, genetic modification is achieved through gene delivery, which can utilize viral transduction. In treatment of bone defects, the strategy of using donor cells containing a target gene, that are able to rebuild blood and bone systems, is a favourable prospect that awaits further development in the field of biotherapy.
Acknowledgements
This research was supported by grants from the National Natural Science Foundation of China (81070806), the Shanghai Municipal Commission for Science and Technology (09411954800, 10JC1413300), the Shanghai Municipal Health Bureau for Youth Fund (2009Y082) and the Shanghai Key Laboratory of Oral Medicine Open Fund (S30206).
References
- 1. Rotter N, Haisch A, Bucheler M (2005) Cartilage and bone tissue engineering for reconstructive head and neck surgery. Eur. Arch. Otorhinolaryngol. 262, 539–545. [DOI] [PubMed] [Google Scholar]
- 2. Urist MR (1965) Bone: formation by autoinduction. Science 150, 893–899. [DOI] [PubMed] [Google Scholar]
- 3. Wang Y, Wan C, Deng L, Liu X, Cao X, Gilbert SR et al. (2007) The hypoxia‐inducible factor alpha pathway couples angiogenesis to osteogenesis during skeletal development. J. Clin. Invest. 117, 1616–1626. [DOI] [PMC free article] [PubMed] [Google Scholar]
- 4. Baek JH, Liu YV, McDonald KR, Wesley JB, Zhang H, Semenza GL (2007) Spermidine/spermine N(1)‐acetyltransferase‐1 binds to hypoxia‐inducible factor‐1alpha (HIF‐1alpha) and RACK1 and promotes ubiquitination and degradation of HIF‐1alpha. J. Biol. Chem. 282, 33358–33366. [DOI] [PubMed] [Google Scholar]
- 5. Liu YV, Baek JH, Zhang H, Diez R, Cole RN, Semenza GL (2007) RACK1 competes with HSP90 for binding to HIF‐1alpha and is required for O(2)‐independent and HSP90 inhibitor‐induced degradation of HIF‐1alpha. Mol. Cell 25, 207–217. [DOI] [PMC free article] [PubMed] [Google Scholar]
- 6. Boutin AT, Weidemann A, Fu Z, Mesropian L, Gradin K, Jamora C et al. (2008) Epidermal sensing of oxygen is essential for systemic hypoxic response. Cell 133, 223–234. [DOI] [PMC free article] [PubMed] [Google Scholar]
- 7. Gordon J, Simon M (2007) Hypoxia‐inducible factors: central regulators of the tumor phenotype. Curr. Opin. Genet. Dev. 17, 71–77. [DOI] [PMC free article] [PubMed] [Google Scholar]
- 8. Wiesener MS, Jurgensen JS, Rosenberger C, Scholze CK, Horstrup JH, Warnecke C et al. (2003) Widespread hypoxia‐ inducible expression of HIF‐2alpha in distinct cell populations of different organs. FASEB J. 17, 271–273. [DOI] [PubMed] [Google Scholar]
- 9. Bruder SP, Kraus KH, Goldberg VM, Kadiyala S (1998) The effect of implants loaded with autologous mesenchymal stem cells on the healing of canine segmental bone defects. J. Bone Joint Surg. Am. 80, 985–996. [DOI] [PubMed] [Google Scholar]
- 10. Bruder SP, Kurth AA, Shea M, Hayes WC, Jaiswal N, Kadiyala S (1998) Bone regeneration by implantation of purified, culture‐expanded human mesenchymal stem cells. J. Orthop. Res. 16, 155–162. [DOI] [PubMed] [Google Scholar]
- 11. Xu M, Uemura R, Dai Y, Wang Y, Pasha Z, Ashraf M (2007) In vitro and in vivo effects of bone marrow stem cells on cardiac structure and function. J. Mol. Cell. Cardiol. 42, 441–448. [DOI] [PMC free article] [PubMed] [Google Scholar]
- 12. Wan C, Shao J, Gilbert SR, Riddle RC, Long F, Johnson RS et al. (2010) Role of HIF‐1alpha in skeletal development. Ann. N Y Acad. Sci. 1192, 322–326. [DOI] [PMC free article] [PubMed] [Google Scholar]
- 13. Riddle RC, Khatri R, Schipani E, Clemens TL (2009) Role of hypoxia‐inducible factor‐1alpha in angiogenic‐osteogenic coupling. J. Mol. Med. 87, 583–590. [DOI] [PMC free article] [PubMed] [Google Scholar]
- 14. Maniatopoulos C, Sodek J, Melcher AH (1988) Bone formation in vitro by stromal cells obtained from bone marrow of young adult rats. Cell Tissue Res. 254, 317–330. [DOI] [PubMed] [Google Scholar]
- 15. Kasten P, Luginbuhl R, van Griensven M, Barkhausen T, Krettek C, Bohner M et al. (2003) Comparison of human bone marrow stromal cells seeded on calcium‐deficient hydroxyapatite, beta‐tricalcium phosphate and demineralized bone matrix. Biomaterials 24, 2593–2603. [DOI] [PubMed] [Google Scholar]
- 16. Park SK, Dadak AM, Haase VH, Fontana L, Giaccia AJ, Johnson RS (2003) Hypoxia‐induced gene expression occurs solely through the action of hypoxia‐inducible factor 1alpha (HIF‐1alpha): role of cytoplasmic trapping of HIF‐2alpha. Mol. Cell. Biol. 23, 4959–4971. [DOI] [PMC free article] [PubMed] [Google Scholar]
- 17. Compernolle V, Brusselmans K, Franco D, Moorman A, Dewerchin M, Collen D et al. (2003) Cardia bifida, defective heart development and abnormal neural crest migration in embryos lacking hypoxia‐inducible factor‐1alpha. Cardiovasc. Res. 60, 569–579. [DOI] [PubMed] [Google Scholar]
- 18. Carmeliet P, Dor Y, Herbert J, Fukumura D, Brusselmans K, Dewerchin M et al. (1998) Role of HIF‐1alpha in hypoxia mediated apoptosis, cell proliferation and tumour angiogenesis. Nature 394, 485–490. [DOI] [PubMed] [Google Scholar]
- 19. Compernolle V, Brusselmans K, Acker T, Hoet P, Tjwa M, Beck H et al. (2002) Loss of HIF‐2alpha and inhibition of VEGF impair fetal lung maturation, whereas treatment with VEGF prevents fatal respiratory distress in premature mice. Nat. Med. 8, 702–710. [DOI] [PubMed] [Google Scholar]
- 20. Peng J, Zhang L, Drysdale L, Fong GH (2000) The transcription factor EPAS‐1/hypoxia‐inducible factor 2alpha plays an important role in vascular remodeling. Proc. Natl. Acad. Sci. USA 97, 8386–8391. [DOI] [PMC free article] [PubMed] [Google Scholar]
- 21. Scortegagna M, Ding K, Oktay Y, Gaur A, Thurmond F, Yan LJ et al. (2003) Multiple organ pathology, metabolic abnormalities and impaired homeostasis of reactive oxygen species in Epas12/2 mice. Nat. Genet. 35, 331–340. [DOI] [PubMed] [Google Scholar]
- 22. Weidemann A, Johnson RS (2008) Biology of HIF‐1alpha. Cell Death Differ. 15, 621–627. [DOI] [PubMed] [Google Scholar]
- 23. Makino Y, Cao R, Svensson K, Bertilsson G, Asman M, Tanaka H et al. (2001) Inhibitory PAS domain protein is a negative regulator of hypoxia‐inducible gene expression. Nature 414, 550–554. [DOI] [PubMed] [Google Scholar]
- 24. Jiang X, Zhao J, Wang S, Sun X, Zhang X, Chen J et al. (2009) Mandibular repair in rats with premineralized silk scaffolds and BMP‐2‐modified bMSCs. Biomaterials 30, 4522–4532. [DOI] [PMC free article] [PubMed] [Google Scholar]
- 25. Wang GL, Semenza GL (1993) General involvement of hypoxia‐ inducible factor 1 in transcriptional response to hypoxia. Proc. Natl. Acad. Sci. USA 90, 4304–4308. [DOI] [PMC free article] [PubMed] [Google Scholar]
- 26. Maxwell PH, Wiesener MS, Chang GW, Clifford SC, Vaux EC, Cockman ME et al. (1999) The tumour suppressor protein VHL targets hypoxia‐inducible factors for oxygen‐dependent proteolysis. Nature 399, 271–275. [DOI] [PubMed] [Google Scholar]
- 27. Zhang X, Godbey WT (2006) Viral vectors for gene delivery in tissue engineering. Adv. Drug Deliv. Rev. 58, 515–534. [DOI] [PubMed] [Google Scholar]
- 28. Shomento SH, Wan C, Cao X, Faugere MC, Bouxsein ML, Clemens TL et al. (2010) Hypoxia‐inducible factors 1alpha and 2alpha exert both distinct and overlapping functions in long bone development. J. Cell. Biochem. 109, 196–204. [DOI] [PubMed] [Google Scholar]
- 29. Saito T, Fukai A, Mabuchi A, Ikeda T, Yano F, Ohba S et al. (2010) Transcriptional regulation of endochondral ossification by HIF‐2alpha during skeletal growth and osteoarthritis development. Nat. Med. 16, 678–686. [DOI] [PubMed] [Google Scholar]
- 30. Yang S, Kim J, Ryu JH, Oh H, Chun CH, Kim BJ et al. (2010) Hypoxia‐inducible factor‐2alpha is a catabolic regulator of osteoarthritic cartilage destruction. Nat. Med. 16, 687–693. [DOI] [PubMed] [Google Scholar]
- 31. Kootstra NA, Verma IM (2003) Gene therapy with viral vectors. Annu. Rev. Pharmacol. Toxicol. 43, 413–439. [DOI] [PubMed] [Google Scholar]
- 32. Roca H, Phimphilai M, Gopalakrishnan R, Xiao G, Franceschi RT (2005) Cooperative interactions between RUNX2 and homeodomain protein‐binding sites are critical for the osteoblast‐specific expression of the bone sialoprotein gene. J. Biol. Chem. 280, 30845–30855. [DOI] [PubMed] [Google Scholar]
- 33. Ferro F, Falini G, Spelat R, D’Aurizio F, Puppato E, Pandolfi M et al. (2010) Biochemical and biophysical analyses of tissue‐engineered bone obtained from three‐dimensional culture of a subset of bone marrow mesenchymal stem cells. Tissue Eng. Part A 12, 3657–3667. [DOI] [PubMed] [Google Scholar]
- 34. Freed LE, Guilak F, Guo XE, Gray ML, Tranquillo R, Holmes JW et al. (2006) Advanced tools for tissue engineering: scaffolds, bioreactors, and signaling. Tissue Eng. 12, 3285–3305. [DOI] [PubMed] [Google Scholar]
- 35. Bosch‐Marce M, Okuyama H, Wesley JB, Sarkar K, Kimura H, Liu YV et al. (2007) Effects of aging and hypoxia‐inducible factor‐1 activity on angiogenic cell mobilization and recovery of perfusion after limb ischemia. Circ. Res. 101, 1310–1318. [DOI] [PubMed] [Google Scholar]
- 36. Coolbaugh CC (1952) Effects of reduced blood supply on bone. Am. J. Physiol. 169, 26–33. [DOI] [PubMed] [Google Scholar]
- 37. Zhou J, Lin H, Fang T, Li X, Dai W, Uemura T et al. (2010) The repair of large segmental bone defects in the rabbit with vascularized tissue engineered bone. Biomaterials 31, 1171–1179. [DOI] [PubMed] [Google Scholar]
- 38. Tobita M, Uysal AC, Ogawa R, Hyakusoku H, Mizuno H (2008) Periodontal tissue regeneration with adipose‐derived stem cells. Tissue Eng. Part A 14, 945–953. [DOI] [PubMed] [Google Scholar]
- 39. Huang LE, Gu J, Schau M, Bunn HF (1998) Regulation of hypoxia‐inducible factor 1alpha is mediated by an O2‐dependent degradation domain via the ubiquitin‐proteasome pathway. Proc. Natl. Acad. Sci. USA 95, 7987–7992. [DOI] [PMC free article] [PubMed] [Google Scholar]