

Abstract
Abstract. Introduction: ID1, founding member of the inhibitor of differentiation (ID) family, is involved in cell population growth, apoptosis and tumourigenesis. Methods and Results: We investigated mRNA levels of ID1 in human myeloid leukaemic cell lines and in specimens of patients with acute myeloid leukaemia (AML), using semiquantitative reverse transcription‐polymerase chain reaction, and protein levels of ID1 in human myeloid leukaemic cell lines using Western blot analysis. Six of seven AML cell lines and 12 of 15 AML patient samples were found to have barely detectable ID1 mRNA. All of these cell lines showed the same levels of protein in proportion to levels of mRNA. Two of the AML cell lines with low ID1 expression, KG1 and KG‐1a, were chosen for treatment with either the DNA demethylation reagent, 5‐aza‐2′‐deoxycytidine (DAC), or the histone deacetylase (HDAC) inhibitor, trichostatin A (TSA). These treatments were alone or in combination, and ID1 expression was induced by both DAC and TSA. No hypermethylated ID1 gene promoter was detected in the majority of the cell lines and patient specimens, by methylation‐specific polymerase chain reaction, suggesting that induction of ID1 in KG1 and KG‐1a was not due to direct demethylation of the ID1 gene promoter. Chromatin immunoprecipitation showed that accumulation of acetyl‐histone H3 and release of HDAC1 were correlated with ID1 induction by these drugs. Flow cytometric assay demonstrated more apoptosis induced by TSA or TSA in combination with DAC, in both KG‐1 and KG‐1a cell lines. Increase of intracellular reactive oxygen species was observed when treated with TSA. Conclusion: Most AML cell lines and human AML samples have very low levels of expression of ID1. TSA or TSA in combination with DAC is able to restore ID1 expression in low ID1‐expressing AML cell lines by re‐activating the aberrantly deacetylated promoter, and this also results in more apoptotic cell death, in which ID1 and the redox pathway may be involved.
INTRODUCTION
Deregulation of the genes that modulate cell proliferation and induce differentiation plays a key role during development of leukaemia. New therapeutic approaches rely on re‐establishing the function of such genes (Sachs 1986). Members of the inhibitor of differentiation (ID) protein family, including ID1‐4, are largely considered to be dominant‐negative regulators of cell differentiation pathways, but positive regulators of cellular proliferation (Chaudhary et al. 2005). The most recent data on ID gene expression in primary human malignancies suggests that ID proteins, or their downstream effectors, may be bona fide molecular targets for therapeutics for a variety of human malignancies (Sikder et al. 2003). ID1 was the first member of the family and has been found to be involved in multiple cellular processes, including cell differentiation, cell population growth, apoptosis and tumourigenesis (Norton 2000; Sikder et al. 2003). Expression of ID1 has been shown to be elevated in a variety of primary human tumour tissues and cell lines, including those for melanoma (Straume & Akslen 2005), colorectal cancer (Wilson et al. 2001), breast cancer (Lin et al. 2000), gastric cancer (Han et al. 2004), thyroid cancer (Kebebew et al. 2000), ovarian cancer (Schindl et al. 2003), pancreatic cancer (Lee et al. 2004) and prostate cancer (Ouyang et al. 2002). Interestingly, it was reported that ID1 expression could be induced in human lung adenocarcinoma cells upon treatment with the histone deacetylase (HDAC) inhibitor trichostatin A (TSA) (Eickhoff et al. 2000), but inhibited in ovarian cancer cells upon the same treatment (Strait et al. 2002). HDAC inhibitors including TSA have been considered promising drugs for haematological malignancies and are already in clinical trials (Shaker et al. 2003; Acharya et al. 2005). If TSA can induce ID1 expression and the latter promotes leukaemogenesis, TSA therapy may pose a serious problem for its clinical use. To clarify this, we first determined ID1 expression in human myeloid leukaemic cell lines and in specimens from patients with acute myeloid leukaemia (AML). We then studied whether ID1 expression could be induced by treatment of these cells with the DNA‐demethylating agent 5‐aza‐2′‐deoxycytidine (DAC) and the HDAC inhibitor TSA, either alone or in combination, because the synergistic antileukaemic effect of DAC and TSA on leukaemic cells has been reported (Shaker et al. 2003). Third, to elucidate the mechanism by which ID1 expression was induced by the drugs, we studied DNA methylation and the histone acetylation status of the ID1 gene promoter. Finally, because both ID1 and TSA have been reported to induce apoptosis (Tanaka et al. 1998; Parrinello et al. 2001; Zhu et al. 2001; Qi & Sun 2004), and apoptosis induced by TSA was greatly enhanced in the presence of DAC in human lung cancer (Zhu et al. 2001), we investigated the apoptotic effect of both drugs on the leukaemic cells and the possible pathway for apoptosis.
MATERIALS AND METHODS
Cell lines and cell cultures
Human myeloid leukaemic cell lines KG‐1, KG1a, HL‐60, THP‐1, HEL, NB‐4 and K562 were purchased from the German Collection of Microorganisms and Cell Cultures (DSMZ, Braunschweig, Germany). AML193 cell line was obtained from the ATCC (Rockville, MD, USA). KG1, KG1a, HL‐60 and AML193 were cultured in Iscove's modified Dulbecco's medium (BioWhittaker, Verviers, Belgium) supplemented with 20% foetal bovine serum (FBS) (and 2 ng/mL granulocyte‐macrophage colony‐stimulating factor and 3 U/mL IL‐3: AML193 only). K562 was grown in Iscove's modified Dulbecco's medium supplemented with 10% FBS. HEL, THP‐1 and NB‐4 were grown in RPMI 1640 supplemented with 10% FBS (and 1 mm sodium pyruvate: HEL and THP‐1). To determine optimal DAC treatment conditions, KG1 cells underwent dose–response and time course assays. Cells were treated for 72 h with 1 µm DAC, or equivalent volume of a phosphate‐buffered saline vehicle control, and were harvested. For TSA experiments, cells were exposed to 1 µm TSA (or an ethanol vehicle control) for 18 h, alone, or during the final 18 h of a 72‐h treatment with DAC.
Patient specimens
Banked samples of marrow aspirate (n = 8) or peripheral blood (n = 7) were obtained from 15 adult AML patients (ages 22–65) at diagnosis. Their use in this study was approved by the local ethics committee and included the following French–American–British subtypes: M0 (n = 2), M1 (n = 3), M2 (n = 5), M3 (n = 3), M4 (n = 1) and M5 (n = 1) as assessed by light microscopy, cytochemical stains and multiparametric flow cytometry. Samples were prepared for banking as described previously (Scott et al. 2006). Control samples were bone marrow mononuclear cells from healthy donors.
Isolation of total RNA and DNA
Total RNA and DNA were extracted from the human myeloid leukaemic cell lines and patient specimens. Total RNA alone was extracted from control samples. Total RNA was isolated using the Trizol method (GibcoBRL, Invitrogen, Carlsbad, CA, USA), according to protocols provided by the manufacturer. RNA pellets were dissolved in nuclease‐free sterile water, and were quantified spectrophotometrically. DNA was isolated by standard phenol‐chloroform extraction.
Reverse transcription‐polymerase chain reaction analysis
One microgram aliquots of total RNA treated with DNaseI (Ambion, Austin, TX, USA) were used for first strand cDNA synthesis with 50 U Moloney murine leukaemia virus reverse transcriptase (M‐MLV RT; Promega, Medison, WI, USA) and random hexamer oligonucleotides as primers. The following polymerase chain reaction (PCR) primers were designed by the Primer Premier 5.0. ID1: forward: 5′‐TGGACGAGCAGCAGGTAAACG‐3′, reverse: 5′‐GCGCTGATCTCGCCGTTGAGG‐3′ (yielding 244 bp), located between positions 202 and 445 of ID1 cDNA sequence (GenBank accession, NM002165). β‐Actin: forward: 5′‐AGCGGGAAATCGTGCGTG‐3′, reverse: 5′‐CAGGGTACATGGTGGTGCC‐3′ (yielding 297 bp). PCR was performed in a GeneAmp PCR System 2400 (Applied Biosystems) using Red Taq polymerase (Sigma Company, St. Louis, MO, USA) for β‐actin and HotStar Taq polymerase (Qiagen Inc., Mississauga, ON, Canada) for expression analysis of the ID1 gene. Thirty amplification cycles were used for detection of both the ID1 and β‐actin. Annealing temperatures were at 55 °C for ID1 and 61 °C for β‐actin. Amplification of the RNAs without prior reverse transcription reaction was used as negative control to exclude possible DNA contamination. PCR products were electrophoresed in ethidium bromide stained 2% agarose gel and were visualized by ultraviolet illumination.
Methylation‐specific PCR analysis
Following sodium bisulphite treatment of isolated DNA, methylation status within the CpG island of the ID1 promoter was determined by methylation‐specific PCR, using primer sets designed to discriminate between methylated and unmethylated promoter alleles. Briefly, 10 µg of DNA was denatured in 0.3 N NaOH at 37 °C for 15 min and was incubated with sodium bisulphite reagent at 55 °C for 6 h. Following this, DNA was purified using Wizard DNA clean‐up columns (Promega), incubated in 0.3 N NaOH at 37 °C for 15 min, precipitated in ammonium acetate and ethanol, washed in 70% ethanol and was re‐suspended in water. PCR amplification of the ID1 promoter region was performed. Methylated: forward: 5′‐TAGCGATCGCGTTCGTAAGA‐3′, reverse: 5′‐ACGACGCGACAACTACGAAA‐3′ (yielding 270 bp). Unmethylated: forward: 5′‐TAGTGATTGTGTTTGTAAGAAA‐3′, reverse: 5′‐GAGAAGAGAAGAAGTAGAAA‐3′ (yielding 270 bp). PCR was performed in a final volume of 50 µL, containing 200–400 ng of bisulphite‐treated DNA, 1× Qiagen PCR buffer, 1.5 mm MgCl2, 0.4 mm of each dNTP, 0.2 µm of each primer set, and 0.2 units of HotStar Taq (Qiagen Inc.). Amplification consisted of an initial Taq activation step at 94 °C for 13 min followed by 35 amplification cycles (94 °C for 1 min, annealing temperature for 1 min, and 72 °C for 1 min). Annealing temperatures were set at 55 °C for detection of methylated ID1 promoter alleles and 48 °C for unmethylated alleles. PCR products were visualized by ethidium bromide staining of a 2% agarose gel. Methylation‐specific PCR positive controls for methylated ID1 promoter alleles were generated by bisulphite modifying CpGenome universal methylated DNA (Chemicon, Temecula, CA, USA).
Western blot analysis
For preparation of protein extracts from cell lines after incubation with or without drugs, approximately 1 × 10⁷ cells were collected, washed with ice‐cold phosphate‐buffered saline, re‐suspended and were sonicated in 1 mL RIPA lysis buffer (sc‐24948, Santa Cruz Biotechnology, Santa Cruz, CA, USA); then they were centrifuged at 10 000 g for 15 min at 4 °C and the supernatant was used as cell extract. Protein concentrations of samples were determined by Bradford's method (Bio‐Rad Laboratories, Hercules, CA, USA). For Western blot analysis, sodium dodecyl sulphate‐polyacrylamide gel electrophoresis (SDS‐PAGE) sample buffer [50 mm Tris‐HCl (pH 6.8), 100 mm DTT, 2% SDS, 0.1% bromphenol blue, 10% glycerol] was added and proteins were denatured by boiling for 5 min. Samples containing 20 µg of protein were analysed on 12% SDS‐PAGE gels and were electroblotted onto polyvinylidene fluoride membrane (Millipore Corporation, Billerica, MA, USA), probed with the rabbit anti‐ID1, polyclonal immunoglobulin G (IgG) (sc‐488, Santa Cruz Biotechnology), and were visualized using Immun‐StarTM HRP substrate kit (Bio‐Rad Laboratories). The secondary antibody was horseradish peroxidase (HRP)‐conjugated antirabbit IgG (170‐6515, Bio‐Rad Laboratories). To assure equal protein loading, blots were stripped and were reprobed with mouse anti‐β‐actin (sc‐1616, Santa Cruz Biotechnology) as primary antibody and HRP‐conjugated antimouse IgG as secondary antibody (170‐6516, Bio‐Rad Laboratories).
Chromatin immunoprecipitation assay
Precipitating anti‐acetyl‐H3 (K9/K14) and anti‐HDAC1 antibodies and all other required reagents were purchased from Upstate Biotechnology (Long Island, NY, USA) (Scott et al. 2006). Cells were treated with 1% formaldehyde at 37 °C for 10 min to form DNA‐protein cross‐links, were rinsed, collected by centrifugation, and were lysed in chromatin immunoprecipitation (ChIP) lysis buffer provided by the manufacturer. Nucleoprotein complexes were then sonicated to reduce DNA fragments to 200–1000 bp (as determined by gel electrophoresis), isolated by centrifugation and diluted in ChIP dilution buffer. Each sample was divided into thirds: input, +Ab, –Ab; +Ab and –Ab samples were pre‐cleared with salmon sperm DNA/protein A‐agarose beads. The +Ab sample was then exposed to precipitating antibody and samples were incubated overnight. After immunoprecipitation, immune complexes were collected by adding salmon sperm DNA/protein A‐agarose beads, were sequentially washed and eluted, and cross‐links were reversed by heating at 65 °C for 4 h. DNA was recovered by Proteinase K digestion, phenol extraction, and ethanol precipitation of the sample. PCR amplification of the ID1 promoter region was then performed on +Ab, –Ab and input DNA samples using primers ID1ChIP‐Fw (CCGCAAGAAACGCATTCCCA) and ID1ChIP‐Rev (TCTCAAAGACCTCAGAGCAG) (yielding 291 bp) located between positions –1018 and –727 of ID1 promoter DNA sequence (GenBank accession, U57645) relative to the transcriptional starting point. Amplifications were performed in 1× Qiagen PCR buffer, 1.5 mm MgCl2, 0.2 mm of each dNTP, 0.2 µm of each primer and 0.2 units of HotStar Taq (Qiagen Inc.) and consisted of initial Taq activation step at 95 °C for 15 min followed by 35 amplification cycles (94 °C × 1 min, 58 °C × 1 min, 72 °C × 1 min) and a final incubation at 72 °C for 6 min.
Assessment of induction of apoptosis
Annexin V‐FITC Apoptosis Detection Kit I was purchased from BD Biosciences PharMingen (San Diego, CA, USA). Cells were stained with annexin V/propidium iodide according to the manufacturer's protocol. Data were collected and analysed using an EPICS®XL flow cytometer (Beckman Coulter, Miami, FL, USA) using the EXPO 32 ADC Software (Beckman Coulter).
Detection of reactive oxygen species
2′,7′‐Dichlorodihydrofluorescein diacetate (DCFH‐DA, Molecular Probes Eugene, OR, USA), which has been shown to be relatively specific for hydrogen peroxide, was employed to measure reactive oxygen species (ROS). DCFH‐DA is oxidized to the fluorescent DCF by hydrogen peroxide (Lee et al. 2001). Cells were treated with 20 µm DCFH‐DA for 30 min at 37 °C and intensity of fluorescent was measured by flow cytometry using fluorescence‐activated cell‐sorting scanning and was analysed with EXPO 32 ADC Software (Beckman Coulter). In experiments involving examination of ROS, cells were pre‐treated with or without the free radical scavenger L‐N‐acetylcysteine (L‐NAC, Sigma Company) 1 h before the addition of TSA.
RESULTS
Expression levels of ID1 in human AML cells
Levels of ID1 mRNA and protein in seven AML cell lines (KG‐1, KG1a, HL‐60, THP‐1, HEL, NB‐4 and AML193) and one chronic myeloid leukaemic (CML at blast crisis) cell line (K562) were analysed. We found low levels of expression of ID1 mRNA in AML cell lines, three of them with undetectable levels, three of them very low, and only one of them, HEL, with moderate expression of ID1 compared to that of normal human specimens (Fig. 1a). Levels of protein were in proportion to levels of mRNA. Further analysis of adult AML patient specimens showed that mRNA of ID1 was undetectable in 9 of the 15 specimens, three had low to medium levels, and only three reached levels of normal humans (Fig. 1b). However, among eight normal human bone marrow specimens, five expressed high levels of ID1 mRNA and three had medium levels of expression (Fig. 1c). Owing to limited human specimens available, it was not possible to detect protein for ID1.
Figure 1.
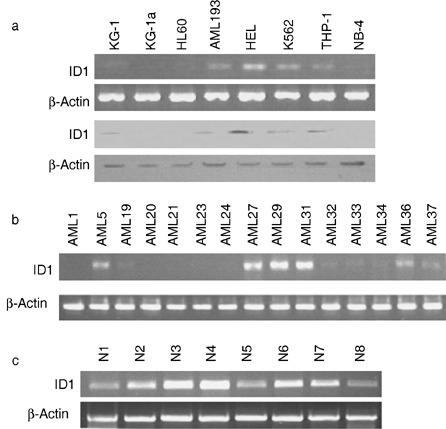
Expression of ID1 in the human myeloid leukaemic cell lines and AML patient samples. (a) Semiquantitative PCR (top panel) and Western blot analysis of ID1 expression in eight human myeloid leukaemic cell lines. (b) Semiquantitative PCR analysis of 15 AML patient specimens. (c) Semiquantitative PCR analysis of eight normal human bone marrow specimens.
Induction of ID1 by TSA and DAC in human AML cell lines with low levels of ID1
To investigate any effect of TSA and DAC on expression of ID1 in AML cell lines, we treated two AML cell lines with low ID1 expression, KG1 and KG‐1a, with these drugs. We found that both TSA and DAC or a combination of them were able to increase levels of ID1 mRNA around 5‐fold (Fig. 2a). DAC alone was able to increase ID1 protein only around 2‐fold, while TSA was able to increase it 3‐ to 4‐fold. Combination of TSA and DAC seemed to have no synergistic effect on induction of ID1 protein (Fig. 2b).
Figure 2.
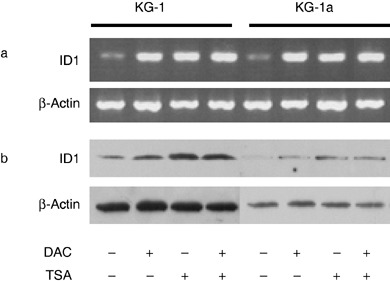
Induction of ID1 expression in the AML cell lines. (a) Semiquantitative PCR and (b) Western blot analysis of ID1 expression in KG‐1 and KG‐1a cells. β‐Actin was used as an internal control.
DNA methylation and histone acetylation status of the ID1 gene promoter in human AML cells
The ID1 gene promoter has been shown to be activated in metastatic breast cancers in association with loss of retinoblastoma/histone deacetylase transcriptional repressor complex (Singh et al. 2002). Because DAC activates genes mainly by demethylating the methylated promoters, we investigated methylation status of ID1 gene promoter using methylation‐specific PCR for all eight cell lines and 15 patient specimens. The ID1 gene promoter in nearly all of these cell lines and patient specimens provided unmethylated bands only (Fig. 3), one exception exhibiting negligible mRNA levels contained both unmethylated and lightly methylated bands in this region (data not shown). This result indicates that the ID1 gene promoter is of low methylation status. Therefore, low or undetectable ID1 expression in AML cells can not be explained by hypermethylation of the promoter, which is the case with many other genes, and induction of ID1 in KG1 and KG‐1a was not due to direct demethylation of the ID1 gene promoter.
Figure 3.
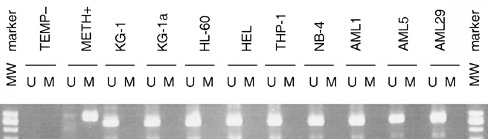
Methylation‐specific PCR analysis of the ID1 gene promoter AML cell lines and patient samples. DNA extracted from cells was treated with bisulphite and then was subjected to PCR using methylation‐specific primers for the ID1 promoter. U: unmethylated band amplified with primers recognizing unmethylated ID1 promoter; M: methylated band amplified with primers specific for methylated ID1 promoter. METH+: methylated DNA control provided by kit supplier; TEMP–: PCR amplification negative control without any template.
Histone modification has been shown to play an important role in regulation of transcription. We have previously observed frequent p21 inactivation in AML in the absence of the corresponding promoter DNA methylation, but this repression was associated with histone deacetylation (Scott et al. 2006). To determine whether histone deacetylation has a role to play in producing low or undetectable expression of ID1 in AML cells, we examined the histone acetylation status of the ID1 gene promoter. Chromatin immunoprecipitation (ChIP) assays using antibodies against acetyl‐H3 and HDAC1 were performed in both KG1 and KG‐1a cell lines. We found that here, the level of acetyl‐H3 was very low with no specific ID1 gene fragment precipitated by antiacetyl‐H3, while HDAC1 association was very high. Upon treatment of the cells with TSA, KG‐1 gained a detectable level of acetyl‐H3, and HDAC1 became undetectable, but KG‐1a cells produced no change in acetyl‐H3 and the HDAC1 level was reduced. Upon treatment of these cells with DAC, acetyl‐H3 increased in the KG‐1a cells but it was still undetectable in the KG‐1 cells. HDAC1 was reduced in KG‐1a cells but became undetectable in KG‐1s. Although the responses of these two cell lines to treatment with TSA or DAC varied slightly, treatment with a combination of TSA and DAC dramatically increased the level of acetyl‐H3 and completely abolished the association of HDAC1 in both (Fig. 4). This result indicates that treatment with both DAC and TSA affect histone H3 acetylation and its acetylation status may be a dominant factor in determining the level of expression of ID1.
Figure 4.
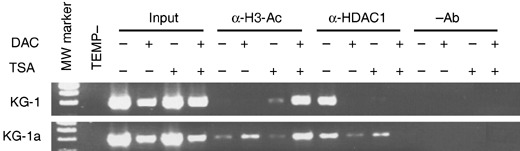
Chromatin immunoprecipitation (ChIP) assay of drug‐treated KG‐1 and KG‐1a cells. Chromatin immunoprecipitation was performed with antiacetyl‐H3 (α‐H3‐Ac) and anti‐HDAC1 (α‐HDAC1) antibodies, respectively. DNA was isolated from samples before addition of antibody (input) and DNA was precipitated in the absence of a precipitating antibody (–Ab) used as control templates for PCR amplification.
Induction of apoptosis by TSA and DAC in human AML cell lines with low levels of ID1
To characterize apoptosis induced in AML cells by the drug treatments, we performed flow cytometric analysis using FITC‐conjugated annexin V and propidium iodide to stain both KG1 and KG‐1a cells. DAC itself induced about 2‐fold increase in apoptosis in both cell lines in comparison with untreated cells (Student's t‐test P < 0.01 for KG‐1 and P < 0.05 for KG‐1a), while TSA showed a more potent apoptosis inducing ability, 3‐ to 4‐fold increase of apoptotic cells (Fig. 5a). Combined treatment with TSA and DAC showed a combined effect on induction of apoptosis, producing 4‐ to 5‐fold increases in apoptosis. Total fraction of apoptotic cells reached an average of 55% in the KG‐1 cells and an average of 42% in the KG‐1a cells (Fig. 5a). There was accumulation of free oxygen species in cells upon their treatment with TSA. Pre‐treatment with the antioxidant L‐NAC inhibited generation of ROS (Fig. 5b).
Figure 5.
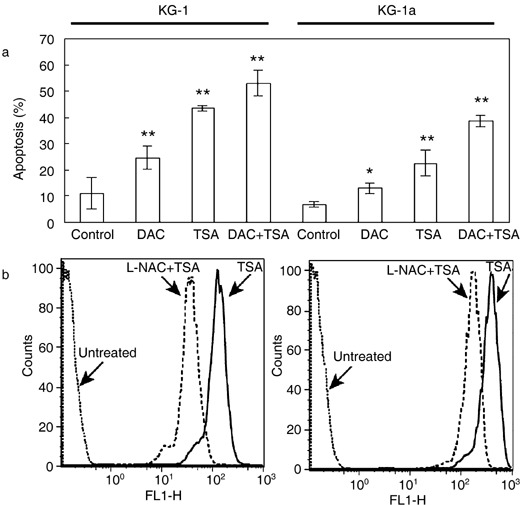
Generation of apoptosis and reactive oxygen species (ROS) by appropriate drugs. (a) FACS analysis of apoptosis in drug‐treated KG‐1 and KG‐1a cells. Results represent three independent experiments and error bars indicate standard error of the means. *P < 0.05; **P < 0.01; statistical significance determined using Student's t‐test. (b) FACS analysis of generation of ROS in KG‐1 and KG‐1a cells treated with TSA, and then blocked by L‐NAC. Cells were incubated with 1 µm TSA for 18 h, after which they were labelled with the oxidative‐sensitive dye, DCFH‐DA, and were analysed by flow cytometry. ROS production is reflected by the shift of peaks to the right in comparison with that of untreated cells. To test the effect of the antioxidizing agent, cells were pre‐treated with L‐NAC (15 mm) for 1 h prior to treatment with TSA and these cells were analysed in parallel. Data are representative of two separate experiments.
DISCUSSION
The gene encoding ID1 was cloned in 1990. Unlike other helix‐loop‐helix (HLH) proteins, ID1 lacks a basic DNA binding domain and forms, with other basic HLH transcription factors, transcriptionally inactive heterodimers, which are unable to bind to DNA, thereby inhibiting transcription of certain differentiation‐associated genes (Sikder et al. 2003). Overexpression of ID1 has been detected in the primary tumours of many human cancer types and in tumour‐derived cell lines (Kebebew et al. 2000; Ouyang et al. 2002; Han et al. 2004; Lee et al. 2004; Straume & Akslen 2005). High levels of ID1 expression are consistently associated with poorly differentiated tumours and with more aggressive tumour behaviour (Lin et al. 2000; Ouyang et al. 2002; Schindl et al. 2003; Han et al. 2004; , Straume & Akslen 2005). There is increasing evidence that deregulated ID1 expression may contribute to oncogenesis, not only by inhibiting the transcriptional activity of basic HLH transcription factors and thereby abrogating differentiation, but also by subverting centrosome duplication (Hasskarl et al. 2004). Thus, ID1 may function as a key mediator of cell population growth, differentiation, and tumourigenesis (Norton 2000; Sikder et al. 2003). However, our results indicate that up‐regulation of ID1 generally does not occur in AML cells (Fig. 1). This finding is consistent with a report on ID1 expression in AML (Ishiguro et al. 1996), that ID1 mRNA is not detected by PCR in leukaemic myeloid cells, with the exception of K562 cells. Moreover, we also found obvious ID1 mRNA expression in normal human bone marrow cells. Thus, ID1 expression in AML is quite different from that reported in other human malignancies where the ID1 expression is up‐regulated (Kebebew et al. 2000; Han et al. 2004; Lee et al. 2004; Straume & Akslen 2005).
Two groups have observed that ID1 can be modulated, by treatment of cells with TSA. One group reported that TSA induced ID1 expression in human lung cancer cells (Eickhoff et al. 2000), while the other group reported that TSA down‐regulated ID1 expression in ovarian cancer cells (Strait et al. 2002). A combination of TSA with the DNA demethylating agent DAC produced a synergistic antileukaemic effect (Shaker et al. 2003). Because we have shown that there were low to undetectable levels of expression of ID1 in most AML cell lines and patient specimens compared to their normal counterparts, we investigated whether DAC and TSA, alone or in combination, could induce expression of ID1 in AML cells with low levels of ID1. This is the first report to demonstrate that expression of ID1 can be re‐established by treatment with DAC and/or TSA in AML cells with low ID1 (Fig. 2).
Aberrant promoter hypermethylation and histone deacetylation are two epigenetic events that can lead to silencing of genes that suppress leukaemogenesis (Daskalakis et al. 2002; Shaker et al. 2004). DNA methylation is directly involved in recruitment of HDAC to chromosomes, which in turn reduces acetylation of histone H3 (Baylin 2005). Reversing these two epigenetic changes by inhibitors of DNA methylation and HDAC, such as DAC and TSA, may be a strategy to activate silent genes and may provide a novel mode of chemotherapy for patients with haematological malignancies (Daskalakis et al. 2002; Shaker et al. 2004). In our study, we have demonstrated the mechanism by which ID1 is regulated in AML cells with or without drug treatment, that is general low level expression of ID1 in AML cells, is due to inactive chromatin structure imposed by histone deacetylation, but not by DNA methylation (3, 4). Thus, it can easily explain the effect of TSA on re‐established ID1 expression in low ID1‐expressing AML cell lines, that is, TSA reverses the epigenetic change of ID1 gene promoter from the histone deacetylation to the histone acetylation, and activates ID1 expression. Given that DAC is a demethylating agent and that the ID1 gene promoter is unmethylated in almost all the samples in the study (Fig. 3), our finding of induction of ID1 by DAC raises the question of how DAC can work on unmethylated genes. The ChIP experiments revealed that in the KG‐1a cell line, DAC plays more of a role in reducing HDAC1 association and increasing acetylation of histone H3, than that of TSA (Fig. 4). The synergistic effect of DAC and TSA on reduction of HDAC1 association and histone H3 acetylation is also obvious (Fig. 4), suggesting that the mechanism by which DAC up‐regulates ID1 is mainly through increasing histone H3 acetylation rather than promoter demethylation. This result is similar to that described for the transcription of the p21 gene in AML cells (Scott et al. 2006). Although the promoter region we examined was hypomethylated, DAC may demethylate other regions of the ID1 gene or closely associated regions of the DNA. This demethylation could reduce association of HDAC1 and hence increase histone acetylation. A less likely possibility is that DAC may demethylate other gene(s) that are hypermethylated in AML and they, in turn, affect the expression of the ID1 gene. This possibility needs further investigation.
Although the majority of AML cell lines and patient specimens in our study had low to undetectable levels of ID1 expression, a minority of cell lines and patient specimens do possess detectable or high levels of expression (Fig. 1). This heterogeneity in expression suggests that the regulation of ID1 in AML is a complex process and it may involve more than one mechanism. For those cells with low to undetectable levels of ID1, treatment with TSA or DAC can induce ID1 expression. We have not tested induction of ID1 in those cells where the expression level is already high. TSA therapy may have different effects on these patients and therefore pre‐screening of patient cells may become necessary.
TSA has also been reported to induce apoptosis, which was seen to be greatly enhanced in the presence of DAC, in human lung cancer (Zhu et al. 2001). Nevertheless, which gene or genes are involved in this process is unknown (Zhu et al. 2001). Our study demonstrates that both TSA and DAC or a combination can induce apoptosis in the KG1 and KG‐1a cell lines. TSA or the combination of TSA and DAC had a more powerful effect on induction of apoptosis (Fig. 5a). We also found that TSA could induce apoptosis through the redox pathway (Fig. 5b); a similar mechanism reported for MS‐275, an HDAC inhibitor with a different structure from TSA (Rosato et al. 2003). Because KG‐1 and KG‐1a are p53‐null AML cell lines, apoptosis induced by TSA and DAC in these cells is most likely to be p53 independent.
Sun et al. have reported that ID1 expression targeted to thymocytes caused aberrant T‐cell development and massive apoptosis in target cells; while targeted expression of ID1 to B‐lymphocytes also resulted in aberrant B‐cell development (Sun 1994; Qi & Sun 2004). Tanaka et al. (1998) and Parrinello et al. (2001) also found that ID1 expression induced apoptosis in cardiac myocytes and mammary gland epithelial cells, respectively. After infection with recombinant adenovirus containing DNA for ID1 (Ad.Id1), neonatal and adult cardiac myocytes displayed a significant reduction in viability, which was proportional to the level of ID1 expression. Morphological and biochemical assays demonstrated that ID1 expression resulted in apoptosis of the myocytes (Tanaka et al. 1998). These results indicate that expression of ID1 may lead to induction of apoptosis, at least in this cell system.
There may be many genes involved in the process of apoptosis induced by TSA and DAC in AML cells. We speculate here that ID1 is one apoptosis‐promoting molecule up‐regulated by TSA, that according to this induction of apoptosis (Fig. 5a) is consistent with induction of ID1 expression (Fig. 2b) and the acetylation of histone H3 (Fig. 4) after the same drug treatment for the same cells. This speculation is supported by the observation that expression of ID1 in neonatal cardiac myocytes induces apoptosis in cardiac myocytes through a redox‐dependent mechanism (Tanaka et al. 1998). Our experiments demonstrate not only that TSA can induce both ID1 expression and apoptosis in low ID1‐expressing AML cells, but also that TSA‐induced apoptosis of such cells was also by a redox‐dependent mechanism. Our current findings have proposed a link between TSA, ID1 and apoptosis in this pathway. However, our study of mechanism(s) of apoptosis in AML cells induced by TSA is at present simplistic. Identification of detailed signalling pathways and the extent to which ID1 may contribute to TSA‐induced apoptosis in AML cells remains for future investigations. Although ID1 can act as an oncogene in many cancers, our study suggests that ID1 in AML plays a role more close to that of a tumour suppressor due to its pro‐apoptotic functions. To the best of our knowledge, this study is the first to indicate that ID1 is a molecular target of TSA in AML and that it may be an important mediator in TSA‐induced apoptosis.
ACKNOWLEDGEMENTS
We are grateful to Dr. John DeCoteau for providing laboratory space and reagents, to Mr. Mark Boyd and Mrs Susan Bergen for their technical assistance. This work was supported by Saskatchewan Health Research Foundation (SHRF). Weiping Yu is a recipient of Postdoctoral Fellowship of SHRF.
REFERENCES
- Acharya MR, Sparreboom A, Venitz J, Figg WD (2005) Rational development of histone deacetylase inhibitors as anticancer agents: a review. Mol. Pharmacol. 68, 917–932. [DOI] [PubMed] [Google Scholar]
- Baylin SB (2005) DNA methylation and gene silencing in cancer. A Review. Nat. Clin. Pract. Oncol. 2 (Suppl. 1), S4–S11. [DOI] [PubMed] [Google Scholar]
- Chaudhary J, Sadler‐Riggleman I, Ague JM, Skinner MK (2005) The helix‐loop‐helix inhibitor of differentiation (ID) proteins induce post‐mitotic terminally differentiated sertoli cells to re‐enter the cell cycle and proliferate. Biol. Reprod. 72, 1205–1217. [DOI] [PubMed] [Google Scholar]
- Daskalakis M, Nguyen TT, Nguyen C, Guldberg P, Kohler G, Wijermans P, Jones PA, Lubbert M (2002) Demethylation of a hypermethylated P15/INK4B gene in patients with myelodysplatic syndrome by 5‐aza‐2′‐deoxycytidine (decitabine) treatment. Blood 100, 2957–2964. [DOI] [PubMed] [Google Scholar]
- Eickhoff B, Ruller S, Laue T, Kohler G, Stahl C, Schlaak M, Van Der Bosch J (2000) Trichostatin A modulates expression of p21waf1/cip1, Bcl‐xL, ID1, ID2, ID3, CRAB2, GATA‐2, hsp86 and TFIID/TAFII31 mRNA in human lung adenocarcinoma cells. Biol. Chem. 381, 107–112. [DOI] [PubMed] [Google Scholar]
- Han S, Guo CC, Hong L, Liu J, Han ZY, Liu CJ, Wang J, Wu KC, Ding J, Fan DM (2004) Expression and significance of Id1 helix‐loop‐helix protein overexpression in gastric cancer. Cancer Lett. 216, 63–71. [DOI] [PubMed] [Google Scholar]
- Hasskarl J, Duensing S, Manuel E, Munger K (2004) The helix‐loop‐helix protein ID1 localizes to centrosomes and rapidly induces abnormal centrosome numbers. Oncogene 23, 1930–1938. [DOI] [PubMed] [Google Scholar]
- Ishiguro A, Spirin KS, Shiohara M, Tobler A, Gombart AF, Israel MA, Norton JD, Koeffler HP (1996) Id2 expression increases with differentiation of human myeloid cells. Blood 87, 5225–5231. [PubMed] [Google Scholar]
- Kebebew E, Treseler PA, Duh QY, Clark OH (2000) The helix‐loop‐helix transcription factor, Id‐1, is overexpressed in medullary thyroid cancer. Surgery 128, 952–957. [DOI] [PubMed] [Google Scholar]
- Lee MG, Lee KT, Chi SG, Park JH (2001) Costunolide induces apoptosis by ROS‐mediated mitochondrial permeability transition and cytochrome C release. Biol. Pharm. Bull. 24, 303–306. [DOI] [PubMed] [Google Scholar]
- Lee KT, Lee YW, Lee JK, Choi SH, Rhee JC, Paik SS, Kong G (2004) Overexpression of Id‐1 is significantly associated with tumour angiogenesis in human pancreas cancers. Br. J. Cancer 90, 1198–1203. [DOI] [PMC free article] [PubMed] [Google Scholar]
- Lin CQ, Singh J, Murata K, Itahana Y, Parrinello S, Liang SH, Gillett CE, Campisi J, Desprez PY (2000) A role for Id‐1 in the aggressive phenotype and steroid hormone response of human breast cancer cells. Cancer Res. 60, 1332–1340. [PubMed] [Google Scholar]
- Norton JD (2000) ID helix‐loop‐helix proteins in cell growth, differentiation and tumorigenesis. J. Cell Sci. 113, 3897–3905. [DOI] [PubMed] [Google Scholar]
- Ouyang XS, Wang X, Lee DT, Tsao SW, Wong YC (2002) Overexpression of ID‐1 in prostate cancer. J. Urol. 167, 2598–2602. [PubMed] [Google Scholar]
- Parrinello S, Lin CQ, Murata K, Itahana Y, Singh J, Krtolica A, Campisi J, Desprez PY (2001) Id‐1, ITF‐2, and Id‐2 comprise a network of helix‐loop‐helix proteins that regulate mammary epithelial cell proliferation, differentiation, and apoptosis. J. Biol. Chem. 276, 39213–39219. [DOI] [PubMed] [Google Scholar]
- Qi Z, Sun XH (2004) Hyperresponse to T‐cell receptor signaling and apoptosis of Id1 transgenic thymocytes. Mol. Cell. Biol. 24, 7313–7323. [DOI] [PMC free article] [PubMed] [Google Scholar]
- Rosato RR, Almenara JA, Grant S (2003) The histone deacetylase inhibitor MS‐275 promotes differentiation or apoptosis in human leukemia cells through a process regulated by generation of reactive oxygen species and induction of p21CIP1/WAF1 1 . Cancer Res. 63, 3637–3645. [PubMed] [Google Scholar]
- Sachs L (1986) Cell differentiation and malignancy. Cell Biophys. 9, 225–242. [DOI] [PubMed] [Google Scholar]
- Schindl M, Schoppmann SF, Strobel T, Heinzl H, Leisser C, Horvat R, Birner P (2003) Level of Id‐1 protein expression correlates with poor differentiation, enhanced malignant potential, and more aggressive clinical behavior of epithelial ovarian tumors. Clin. Cancer Res. 9, 779–785. [PubMed] [Google Scholar]
- Scott SA, Dong WF, Ichinohasama R, Hirsch C, Sheridan D, Sanche SE, Geyer CR, Decoteau JF (2006) 5‐Aza‐2′‐deoxycytidine (decitabine) can relieve p21WAF1 repression in human acute myeloid leukemia by a mechanism involving release of histone deacetylase 1 (HDAC1) without requiring p21WAF1 promoter demethylation. Leuk. Res. 30, 69–76. [DOI] [PubMed] [Google Scholar]
- Shaker S, Bernstein M, Momparler RL (2004) Antineoplastic action of 5‐aza‐2′‐deoxycytidine (dacogen) and depsipeptide on Raji lymphoma cells. Oncol. Rep. 11, 1253–1256. [PubMed] [Google Scholar]
- Shaker S, Bernstein M, Momparler LF, Momparler RL (2003) Preclinical evaluation of antineoplastic activity of inhibitors of DNA methylation (5‐aza‐2′‐deoxycytidine) and histone deacetylation (trichostatin A, depsipeptide) in combination against myeloid leukemic cells. Leuk. Res. 27, 437–444. [DOI] [PubMed] [Google Scholar]
- Sikder HA, Devlin MK, Dunlap S, Ryu B, Alani RM (2003) Id proteins in cell growth and tumorigenesis. Cancer Cell 3, 525–530. [DOI] [PubMed] [Google Scholar]
- Singh J, Murata K, Itahana Y, Desprez PY (2002) Constitutive expression of the Id‐1 promoter in human metastatic breast cancer cells is linked with the loss of NF‐1/Rb/HDAC‐1 transcription repressor complex. Oncogene 21, 1812–1822. [DOI] [PubMed] [Google Scholar]
- Strait KA, Dabbas B, Hammond EH, Warnick CT, Ilstrup SJ, Ford CD (2002) Cell cycle blockade and differentiation of ovarian cancer cells by the histone deacetylase inhibitor trichostatin A are associated with changes in p21, Rb, and Id proteins. Mol. Cancer Ther. 1, 1181–1190. [PubMed] [Google Scholar]
- Straume O, Akslen LA (2005) Strong expression of ID1 protein is associated with decreased survival, increased expression of ephrin‐A1/EPHA2, and reduced thrombospondin‐1 in malignant melanoma. Br. J. Cancer 93, 933–938. [DOI] [PMC free article] [PubMed] [Google Scholar]
- Sun XH (1994) Constitutive expression of the Id1 gene impairs mouse B‐cell development. Cell 79, 893–900. [DOI] [PubMed] [Google Scholar]
- Tanaka K, Pracyk JB, Takeda K, Yu ZX, Ferrans VJ, Deshpande SS, Ozaki M, Hwang PM, Lowenstein CJ, Irani K, Finkel T (1998) Expression of Id1 results in apoptosis of cardiac myocytes through a redox‐dependent mechanism. J. Biol. Chem. 273, 25922–25928. [DOI] [PubMed] [Google Scholar]
- Wilson JW, Deed RW, Inoue T, Balzi M, Becciolini A, Faraoni P, Potten CS, Norton JD (2001) Expression of Id helix‐loop‐helix proteins in colorectal adenocarcinoma correlates with p53 expression and mitotic index. Cancer Res. 61, 8803–8810. [PubMed] [Google Scholar]
- Zhu WG, Lakshmanan RR, Beal MD, Otterson GA (2001) DNA methyltransferase inhibition enhances apoptosis induced by histone deacetylase inhibitors. Cancer Res. 61, 1327–1333. [PubMed] [Google Scholar]