

Abstract
The microenvironmental changes in the bone marrow, spleen and liver during progression of the transplantable promyelocytic leukaemia in the Brown Norwegian rat (BNML) have been studied. We used flow cytometry to estimate cellular hypoxia and proliferation based on in vivo pulse‐labelling with a mixture of 2‐nitroimidazole linked to theophylline (NITP) and bromodeoxyuridine (BrdUrd). The leukaemic cells were identified with the RM124 antibody. In rats inoculated with leukaemic cells the fraction of RM124+ cells was significantly increased from day 20 onwards in the spleen and from day 27 in the bone marrow and liver, reaching a level of 65–87% in these organs at day 32. At day 32, the NITP+ fraction of RM124+ cells had increased significantly in the bone marrow and spleen to 88% and 90%, respectively. The corresponding fractions of NITP+ normal cells reached 63% and 65%, respectively. From day 13 to day 32, the DNA‐synthesizing (BrdUrd+) fraction of RM124+ cells in the bone marrow decreased significantly from 52% to 25%, and of normal cells from about 20% to 6%. In the bone marrow and spleen at day 27 and 32, the S‐phase and G2/M‐phase fractions according to DNA content were higher for the NITP+ than for the NITP− cells. This could partly be explained by an impaired cell cycle progression due to hypoxia. Nevertheless, we found indications of leukaemic cells that were simultaneously labelled with NITP and BrdUrd, in the bone marrow and spleen. These latter findings suggest that in contrast to normal cells some of the leukaemic cells can proliferate even during hypoxia, and this subpopulation may consequently renew and expand the leukaemic cell load.
INTRODUCTION
Blood flow to the bone marrow varies according to the marrow metabolism (reviewed in Iversen 1997). In a rat model of human acute myeloid leukaemia (BNML) ( Martens & Hagenbeek 1985) we found that the blood flow to the bone marrow was significantly decreased during leukaemic development ( Iversen, Nicolaysen & Benestad 1992; Iversen et al. 1993 ). This is probably caused by increased vascular resistance due to the accumulation of leukaemic cells in the noncompliant surroundings of the bone marrow, local thrombi or local vasoconstriction. As in solid tumours where vascularization and blood flow may be critical for development of hypoxia ( Denekamp 1992; Hodgkiss & Wardman 1992), changes in blood flow to the bone marrow would influence the oxygen supply, and thus it might be expected that hypoxia develops in the bone marrow as the leukaemia progresses. However, due to technical difficulties little is known about the oxygen supply to the bone marrow during leukaemic development, although hypoxia could have a major impact on cell proliferation and the effect of cytostatic drugs. We have observed that in the advanced stage of leukaemic progression the pH of the femoral bone marrow decreases to about 6.5, indicating microenvironmental hypoxic conditions ( Mortensen et al. 1998 ).
A specific method for estimating cellular hypoxia by flow cytometry has recently become available using the probe 7‐(4′‐(2‐nitroimidazole‐1‐yl)‐butyl)‐theophylline (NITP), of which the 2‐nitroimidazole component is bioreductively bound to cellular macromolecules at low oxygen concentration and the theophylline component is detectable by flow cytometry after immunochemical staining ( Hodgkiss et al. 1991 ). By combined in vivo labelling of murine anaplastic sarcomas with NITP and 5‐bromo‐2′‐deoxyuridine (BrdUrd), it has been shown by flow cytometry that even hypoxic cells may proliferate ( Webster, Hodgkiss & Wilson (1995), (1998)).
In the BNML model used in the present study the leukaemic cells are detectable with the RM124 monoclonal antibody ( Martens et al. 1984 ). In this study, we examined the differences between the leukaemic and normal cell subpopulations with respect to hypoxia and proliferation and compared the leukaemic progression in the bone marrow with that in the spleen and liver. Using multiparameter flow cytometry for combined measurement of RM124, NITP, and DNA, as well as of RM124 and BrdUrd, it was possible to estimate the cellular hypoxia and proliferation in the subpopulations of leukaemic (RM124+) and normal (RM124−) cells.
MATERIALS AND METHODS
Rats inoculated with leukaemic cells
The protocols were approved by the local ethical committee for animal experiments. Male Brown Norwegian rats were kept two in each cage and fed with standard pellets and water ad libitum. Fresh leukaemic cells were harvested from a terminal leukaemic rat, and a mixture of cells from its spleen and bone marrow was used for inoculation. We injected 107 leukaemic cells i.p. to each of 30 rats (200–250 g). At days 3, 13, 20 and 32, sets of six rats were investigated for leukaemic progression, the remaining six normal rats served as controls.
Each rat received a total dose of 58 mg NITP plus 8 mg BrdUrd, given by i.p. injection with 5 ml of an emulsion, composed of 420 mg NITP, 3 ml dimethylsulfoxide, 6 ml of 10 mg/ml BrdUrd (B5002, Sigma, St. Louis, MO, USA), and 27 ml peanut oil. After 1 h of labelling the rats were anesthetized by i.p. injection of 1 ml Equithesin (42.5 mg chloralhydrate, 9.7 mg pentobarbital, 21 mg magnesium sulphate, 428 mg propylenglycol and 76 mg ethanol), resulting in unconsciousness within 15 min. The rats were weighed, and the spleen was isolated and weighed. Finally, samples of femoral bones, spleen and liver were removed and kept on ice until further processing.
Bone marrow cells were flushed from the femur into PBS (Dulbecco’s phosphate buffered saline without calcium and magnesium, pH 7.2) and were washed once in PBS. The samples from the liver and spleen were minced with scalpels and placed in tubes with PBS, and rotated for 15 min. Pieces of tissue were allowed to settle and the cell‐containing medium was centrifuged at 300 g for 10 min. The sedimented cells were resupended in cold buffer (250 m m sucrose, 5% DMSO, 40 m m Na‐citrate, pH 7.6) in cryotubes (Nunc, Roskilde, Denmark), frozen and stored at −80 °C, until staining and analysis were convenient.
Normal rats exposed to low oxygen concentration
We used 15 male Wistar rats (350–430 g) that were fasted 24 h prior to the experiment, but given water ad libitum. During the experiments the rats were kept in a specially designed cage that was connected to a Douglas bag. The bag was filled with either air (21% oxygen) or nitrogen containing either 15% or 10% oxygen. The oxygen fractions in the cage were verified by sampling gas and analyzing it on a mass spectrometer. The animals could move freely around in the cage, and no signs of stress were noted. The rats were then anesthetized with pentobarbital (10 mg/kg, i.p.), and a PE 50 catheter implanted in one carotid artery. After awaking, the rats were placed in the cage and allowed a 3‐h stabilization period breathing air before injection of NITP (50 mg/rat i.p., dissolved in peanut oil with 10% DMSO). The cage, housing five animals at a time, was then supplied with either air (21% oxygen), or gas with either 15% oxygen, or 10% oxygen, and for 1 h. Finally, the rats were killed with an overdose of pentobarbital (i.p.), and then both femurs were immediately removed and the bone marrow cells harvested, as previously described ( Iversen et al. 1992 ).
Staining of cells for RM124, NITP, and DNA
The stored cells were thawed, washed in PBS and stained according to a modification of the method of Hodgkiss et al. 1991 . The cells were intially fixed in 70% ethanol at −20 °C. Samples of 5 × 10⁵ fixed cells were washed with PBS, suspended with 1 ml of 0.01% Nonidet P40 (BDH Chemicals, Poole, UK) and 1% normal swine serum (X‐901, DAKO, Glostup, Denmark) for 15 min at room temperature, and washed again in PBS. The samples were then incubated for 45 min on ice in 100 µl PBS, containing 10% rabbit antitheophylline antibody (T‐2524, Sigma), 10% mouse ascites anti‐RM124 antibody (supplied by Dr A.C.M. Martens), and 0.1% bovine serum albumin (BSA). After a wash in PBS with 0.01% BSA, the samples were incubated for 30 min at room temperature in 100 µl PBS, containing 5% fluorescein isothiocyanate (FITC)‐conjugated swine antirabbit F(ab′)2 fragment antibody (F‐054, DAKO), 5% R‐phycoerythrin (PE)‐conjugated goat antimouse F(ab′)2 fragment (R‐480, DAKO), 5% normal goat serum (X‐907, DAKO), 5% normal swine serum (X‐907, DAKO), 3% 7‐amino actinomycin D (2.5 mg/ml, 7‐AAD, A‐9400, Sigma), and 0.1% BSA. The cells were finally washed in PBS and resuspended in 0.3 ml PBS before flow cytometry.
Staining of cells for RM124 and BrdUrd
The stored cells were thawed, washed in PBS and stained according to a modification of the method of Carayon & Bord (1992). First, the leukaemic cells were stained by incubation with PBS containing 10% monoclonal mouse ascites anti‐RM124 antibody on ice for 30 min, followed by a wash in PBS. They were then incubated with PBS containing 5% PE‐conjugated goat antimouse antibody for 30 min, followed by a wash in PBS. The sedimented cells were simultaneously fixed and permeabilized by suspension with 1 ml of a mixture of 1% paraformaldehyde and 0.01% Tween 20 in PBS and kept at 5 °C over night. After one wash in PBS with 1% glycine and one wash in PBS, the fixed cells were suspended with 0.5 ml of 1 mg/ml DNase I (DN‐25, Sigma) in Dulbecco's PBS (with Ca and Mg) and incubated at 37 °C for 30 min. The reaction was terminated by washing in cold PBS, and the cells were stained by incubation for 45 min with 100 µl FITC‐conjugated rat anti‐BrdUrd antibody (FMAS 250p, Sera‐lab, Sussex, U.K.), diluted 1 : 10 in PBS with 0.01% Nonidet P40. After a wash in PBS and final resuspension in 0.3 ml PBS the samples were ready for flow cytometry.
Flow cytometry
In samples from rats inoculated with leukaemic cells, the fraction of hypoxic cells was estimated by simultaneous measurement of forward and orthogonal light scattering, FITC fluorescence (NITP), PE fluorescence (RM124), and 7‐AAD fluorescence (DNA), as illustrated in Fig. 1. Samples of 2 × 10⁴ cells were measured with a FACS Vantage (Becton Dickinson Immunocytometry Systems, San José, CA, USA), detecting FITC fluorescence at 515–545 nm, PE fluorescence at 562–588 nm, and 7‐AAD fluorescence at > 670 nm.
Figure 1.
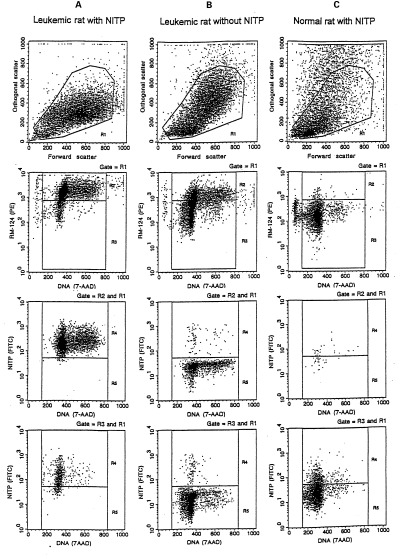
Examples of flow cytometric analysis of the hypoxic fraction of the leukaemic and normal cell subpopulations, showing spleen cells from (a) an NITP labelled, leukaemic rat at day 32 (b) an NITP unlabelled, leukaemic rat at day 27, as a control for the specificity of the hypoxic cell marker NITP, and (c) an NITP labelled, normal rat, as a control for the specificity of the leukaemic cell marker RM124. Within the mononuclear cells gated by region R1 in light scattering, the subpopulations of leukaemic and normal cells were contained in regions R2 (RM124+) and R3 (RM124−), respectively. For leukaemic cells (third row) and normal cells (bottom row), the fractions of hypoxic (NITP+) and normoxic (NITP−) cells were contained in regions R4 and R5, respectively.
The fraction of DNA synthesizing (BrdUrd labelled) cells in the subpopulations of normal and leukaemic cells was estimated by simultaneous measurement of forward and orthogonal light scattering, FITC fluorescence (BrdUrd), and PE fluorescence (RM124), as illustrated in Fig. 2. Samples of 104 cells were analyzed with a FACS IV (Becton Dickinson), detecting FITC fluorescence at 510–540 nm and PE fluorescence at 565–580 nm.
Figure 2.
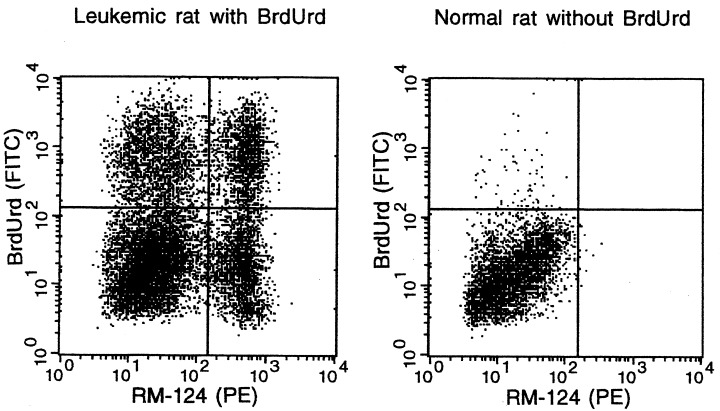
Examples of flow cytometric analysis of the DNA synthesizing fraction of the leukaemic and normal cell subpopulations, showing bone marrow cells from a BrdUrd labelled, leukaemic rat at day 27, and a BrdUrd unlabelled, normal rat, as a control for the specificity of the DNA synthesis marker BrdUrd and the leukaemic cell marker RM124. The quadrant display of cells, already gated by light scattering (cf. Figure 1), indicates the fractions of DNA synthesizing (BrdUrd+) and nonsynthesizing (BrdUrd−), leukaemic (RM124+) and normal (RM124−) cells, respectively.
With both instruments we used argon laser excitation at 488 nm, a trigger threshold by forward light scattering, a 70‐µm nozzle, and a sample flow rate of approximately 0.5 µl/sec. The instruments were calibrated using propidium iodide stained, unfixed trout erythrocyte nuclei. Electronic compensation was adjusted with Calibrite beads (Becton Dickinson) and 7‐AAD stained, unfixed trout erythrocyte nuclei. For discrimination of the RM124+ cells, criteria in PE fluorescence and orthogonal light scatter were adjusted by comparing samples of normal animals with samples of leukaemic animals at day 27, thus reducing the contamination from granulocytes, which also bind the RM124 antibody ( Martens et al. 1984 ). Correct fluorescence thresholds for NITP or BrdUrd positivity were ensured by comparison with measurements on cells from animals not labelled with NITP or BrdUrd. Thus, the reported BrdUrd positive fractions are net values, calculated by subtraction of the unspecific background fraction that was measured in similarly stained control samples from animals not labelled with BrdUrd. In the estimation of the fraction of hypoxic cells, bias from cellular debris and aggregates was avoided by exclusion criteria in 7‐AAD fluorescence.
In samples from normal rat exposed to various oxygen concentrations, the crude femoral bone marrow cells were stained with rabbit antitheophylline antibody, and after washing stained with FITC‐conjugated swine antirabbit F(ab′)2 fragment antibody, before FITC fluorescence of 50 000 cells were analyzed on a FACScan (Becton Dickinson).
Statistics
The means and the corresponding 95% confidence intervals were calculated. Tests of hypotheses for shift in the means were done using the paired t‐test. P‐values less than 5% were considered significant. The observed histograms of DNA content (7‐AAD) were deconvoluted by maximum likelihood using a first degree polynomial ( Vindeløv & Christensen 1990). The estimates of the coefficient of variation (CV) of the G1 peak and the cell cycle fractions were recorded.
RESULTS
Progression of leukaemia
In the bone marrow, as well as in the spleen and liver, a progression of the leukaemia was evidenced by a dramatic increase in the fraction of leukaemic cells, constituting the major subpopulation at day 32 after the inoculation ( Fig. 3). The fraction of leukaemic cells was significantly (P < 5%) larger in the spleen than in the bone marrow on days 13 and 20. It can be seen that the spleen weight is constant for leukaemic cell fractions up to approximately 20% and thereafter increases ( Fig. 3).
Figure 3.

The increase in the fraction of leukaemic cells (RM124+) in the bone marrow (a) , liver (b) , and spleen (c) with time after inoculation of leukaemic cells. Bars indicate ± 2 SEM. The relationship between the fraction of leukaemic cells (RM124+) in the bone marrow and the weight of the spleen (d). The spleen weight was corrected according to the increased body weight of the untreated rats during the experiment. The points represent the individual rats.
Cellular hypoxia in leukaemic rats
The change in the NITP+ fraction of cells with time is shown in Fig. 4. The NITP+ fraction of the leukaemic cells increased significantly from day 27 in the bone marrow and already from day 20 in the spleen, in both organs reaching a level of approximately 90% at day 32. The NITP+ fraction of the normal cells followed the same pattern, with a significant increase in the bone marrow from day 27 and in the spleen already from day 20, in both organs reaching a level of approximately 65% at day 32. The NITP+ fraction of leukaemic cells became significantly higher than that of normal cells at day 32 in the bone marrow, and at day 27 and 32 in the spleen. In the liver we found a high NITP+ fraction of leukaemic as well as normal cells at all time points.
Figure 4.

The hypoxic fraction (NITP+) of cells during progression of leukaemia in bone marrow, spleen and liver. Leukaemic cells (upper panel), normal cells (middle panel), and the difference between leukaemic and normal cells (lower panel) vs. time after inoculation of leukaemic cells. The curves are connecting the mean values, and the bars show the 95% confidence limits.
Cellular hypoxia after breathing at low oxygen concentration
Compared with rats breathing air, the five rats breathing 10% oxygen showed a clear hyperventilatory response to hypoxia, indicated by significantly decreased arterial PaCO2 (3.8 kPa vs. 5.4 kPa when breathing in normal atmosphere). Aditionally we found a significant decrease of arterial PaO2 (7.6 kPa vs. 12.4 kPa when breathing in normal atmosphere). When normal rats were breathing 15% or 10% oxygen, the NITP+ fraction of bone marrow cells increased to 55% and 80%, respectively, from a normal value of < 1%. Thus, the experiment demonstrated that NITP labelling is a sensitive parameter for cellular hypoxia in the bone marrow microenvironment.
Cell proliferation in leukaemic rats
The change in the BrdUrd+ fraction (DNA synthesizing cells) with time is shown in Fig. 5. In the bone marrow, we observed a significant decrease in the BrdUrd+ fraction for the normal as well as the leukaemic cells at the advanced stage of leukaemia. From a level of 52% until day 27 the BrdUrd+ fraction of leukaemic bone marrow cells decreased significantly to 25% at day 32. Simultaneously, the BrdUrd+ fraction of normal cells decreased significantly from a level of about 20% to 6%. The BrdUrd+ fraction of leukaemic cells in the spleen was in the range of 32–47%. In the normal spleen cells, the BrdUrd+ fraction was in the range of 5–10%. In the liver the BrdUrd+ fraction of leukaemic cells was in the range of 34–55%, whereas in the normal cells it increased significantly from 4% to 18% at day 32. In the period from day 13 to day 32, the BrdUrd+ fraction was significantly higher for the leukaemic cells than for the normal in the bone marrow as well as the spleen and liver.
Figure 5.
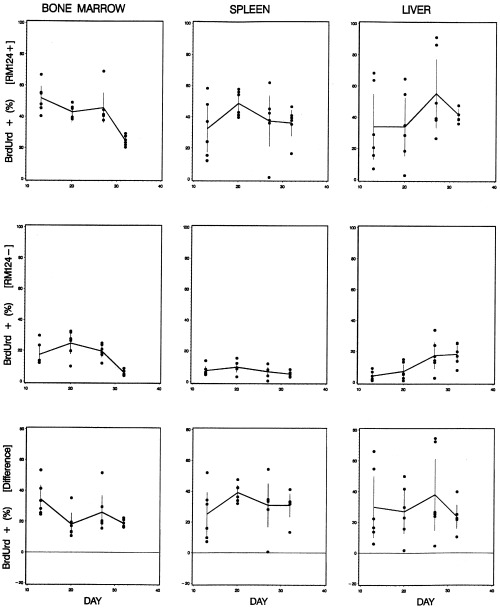
The DNA synthesizing fraction (BrdUrd+) of cells during progression of leukaemia in bone marrow, spleen and liver. Leukaemic cells (upper panel), normal cells (middle panel), and the difference between leukaemic and normal cells (lower panel) vs. time after inoculation of leukaemic cells. The curves are connecting the mean values, and the bars show the 95% confidence limits.
Association between cellular hypoxia and proliferation in leukaemic rats
It is demonstrated in Fig. 6 that there must be leukaemic cells in the bone marrow and the spleen that were both NITP+ and BrdUrd+, indicating that these cells were DNA synthesizing in the hypoxic state. However, this was not observed for normal cells.
Figure 6.
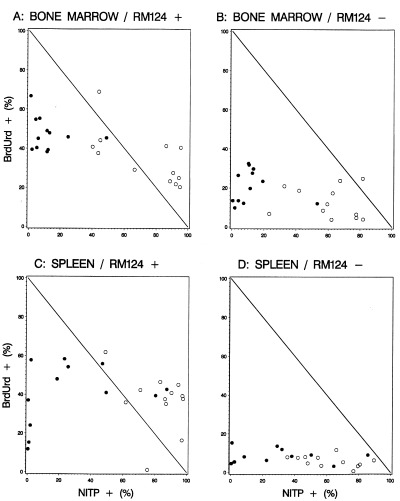
The correlation between the NITP+ fraction and the BrdUrd+ fraction in bone marrow and spleen. (a) Leukaemic cells and (b) normal cells in the bone marrow; (c) leukaemic cells and (d) normal cells in the spleen. Day 13 and 20 (●); day 27 and 32 (○). Data points in the upper right triangular regions represent a situation where some of the cells are both NITP+ and BrdUrd+, indicating that these cells were DNA synthesizing in the hypoxic state. This situation was observed only for the fraction of leukaemic (RM124+) cells.
By deconvolution of gated 7‐AAD fluorescence histograms we estimated the S‐phase fraction of the subpopulations that could be identified according to their RM124 and NITP staining, in the cell samples from bone marrow and spleen at day 27 and 32 ( Table 1, Fig. 7). For the leukaemic cells from the bone marrow as well as from the spleen, we found a significantly higher S‐phase fraction in the hypoxic subpopulations than in the normoxic subpopulations. This relationship was also found for normal cells. In the hypoxic subpopulation of the bone marrow as well as of the spleen, the S‐phase fraction was significantly higher in the leukaemic than in the normal cells. For the normoxic subpopulation in the spleen, we found a significantly higher S‐phase fraction in the leukaemic than in the normal cells. However, a corresponding difference was not found in the bone marrow. For the normal cells in the bone marrow as well as the spleen, the G2/M‐phase of the hypoxic subpopulation was significantly higher than for the normoxic subpopulation.
Table 1.
S‐phase and G2/M‐phase fractions of the hypoxic (NITP+) and normoxic (NITP−) subpopulations of leukaemic (RM124+) and normal (RM124−) cells in the bone marrow and spleen of leukaemic rats (pooled data from day 27 and 32)
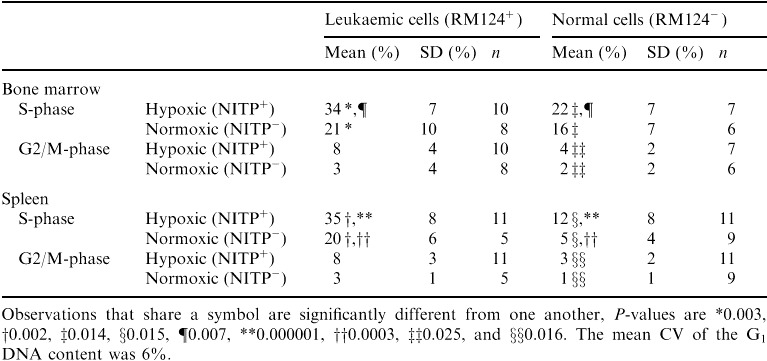
Figure 7.

Examples of DNA content distributions of bone marrow cells based on the 7‐AAD fluorescence distribution when gated according to the RM124 and NITP staining. (a) Hypoxic leukaemic cells (RM124+, NITP+); (b) hypoxic normal cells (RM124−, NITP+); (c) normoxic leukaemic cells (RM124+, NITP−); (d) normoxic normal cells (RM124−, NITP−). The figure indicates G0/1, S, and G2 + M fractions that were estimated by deconvolution of the 7‐AAD fluorescence histograms. The units of the y‐axis are fluorescence histogram channels.
DISCUSSION
In previous papers we have demonstrated blood flow to the bone marrow to decrease during leukaemic progression in rats resulting in hypoxic conditions and decreasing pH ( Iversen et al. 1993 ; Mortensen et al. 1998 ). In this paper it is one of the main findings that these hypoxic conditions are affecting normal cells more severely than the leukaemic cell population with respect to cellular proliferation.
Along with the progression of the leukaemia, producing a greater metabolic mass of cells using more oxygen, the tissues are expected to become more hypoxic, in particular if a compensatory angiogenesis fails as known from solid tumours ( Denekamp 1992; Hodgkiss & Wardman 1992). In the bone marrow, hypoxia might be related to a decreased blood flow ( Iversen et al. 1993 ), as a possible effect of an increased interstitial pressure due to the increased bulk of cells within more or less noncompliant boundaries.
The specificity of NITP labelling in vivo as a measure of cellular hypoxia in flow cytometry has previously been demonstrated by the suppression of the labelling of carcinoma and sarcoma cells in mice breathing carbogen ( Hodgkiss et al. 1991 ). Further evidence is added by this investigation, showing a dramatically increased NITP labelling of bone marrow cells in normal rats breathing at decreased ambient oxygen concentrations. However, in the liver this marker of hypoxia could not conclusively be related to leukaemic progression, because a relatively high and variable fraction of labelled cells was measured also in the control samples not inoculated with leukaemic cells. This finding may be related to the heterogeneous structure of this organ, including normally hypoxic regions with a high fraction of NITP+ cells close to the portal vein ( Arteel et al. 1995 ).
In rats with an advanced stage of the BNML leukaemia the blood flow to the femoral bone marrow is decreased ( Iversen et al. 1993 ), and the microenviroment is changed by a decrease in pH ( Mortensen et al. 1998 ). It must be expected that these changes will affect the normal regulation of the blood flow to the hematopoietic bone marrow ( Iversen 1997) and thereby the conditions for normal cell proliferation. The present investigation demonstrates that the above mentioned microenvironmental changes in the femoral bone marrow are parallelled by intracellular hypoxia in the majority of the normal as well as leukaemic bone marrow cells, and that the proliferation of the normal as well as leukaemic cells is suppressed. In the spleen a similarly increased hypoxia of the normal and leukaemic cells was found, however, without a decrease in cell proliferation.
Interestingly, the comparison between the fraction of hypoxic cells and the fraction of BrdUrd‐labelled, i.e. DNA replicating, cells indicated that the leukaemic cells in the bone marrow and the spleen, in contrast to the normal cells, were able to proliferate even in the unfavourable microenvironment conditioned by the advanced leukaemia. In addition, we found by DNA content analysis that the hypoxic subpopulations of normal as well as leukaemic cells had a higher S‐phase fraction than the normoxic cells, and that the hypoxic subpopulations of normal cells had a higher G2/M‐phase fraction. Because the BrdUrd‐labelled fractions were simultaneously decreasing, this might suggest that the proliferating cells are slowed down in the S‐phase and G2/M‐phase due to the hypoxia. These results are altogether in agreement with those of (1995), (1998) from studies of murine anaplastic sarcomas. Based on data from in vivo labelling with NITP and BrdUrd and using triple staining for hypoxia, proliferation and DNA content, they concluded that the malignant cells were able to proliferate in a hypoxic environment. They also observed a cell cycle arrest due to hypoxia, as an accumulation of hypoxic cells in G2/M‐phase, considered as possibly due to low fidelity of S‐phase DNA synthesis in hypoxia.
It has been reported that in soft tissue sarcomas the fastest proliferating cells were found in the most hypoxic tumours ( Nordsmark et al. 1996 ), and that hypoxic sarcomas are more likely to metastasize than better oxygenated tumours ( Brizel et al. 1996 ). It has been hypothesized that the effects of hypoxia in driving the tumours into a more aggressive mode is to promote apoptosis and therefore select against p53‐competent cells which are unable to follow this pathway. This could then drive genetic variability, as the integrity of the genome is no longer monitored ( Graeber et al. 1996 ; Webster et al. 1998 ). The arrest in S‐and G2/M‐phase could reflect hypoxic DNA‐synthesis with increased probability of faulty replication of DNA. A reservoir of delayed premitotic cells, from which the genetically most damaged cells are sorted out to undergo apoptosis or necrosis, may still present a pool of cells under postreplication repair, from which mutant malignant cells may repopulate, if more favourable conditions within the tumour were restored.
Our data on cellular hypoxia and proliferation are average values obtained by cellular sampling from the different organs. It is quite possible that large microenvironmental heterogeneity exists, as suggested for radiosensitivity to hypoxia in mouse bone marrow ( Allalunis‐Turner & Chapman 1986). Thus, the data from our investigation may not reflect the cell cycling status of normal stem cells that may be important with regard to therapeutic implications of the findings.
In further studies, it could be interesting to focus on microenvironmental conditions with potential for restoration of cellular proliferation, in particular with respect to normal haematopoietic stem cells, and on cell cycle dynamics, including double‐labelling with cell cycle markers.
Acknowledgements
We gratefully acknowledge Dr A.C.M. Martens for supplying the BNML leukaemic cells and RM 124 antibody, and Jette Christiansen for skilful assistance in flow cytometry.
This work was supported by grants from the Danish and the Norwegian Cancer Societies, Danish Medical Research Council, Simon Spies Foundation, Fabrikant Einar Willumsens Mindelegat and Buhl Olesen Foundation.
REFERENCES
- Allalunis‐Turner J & Chapman JD (1986). The in vitro sensitivities to radiation and misonidazole of mouse bone marrow cells derived from different microenvironments. Int. J. Radiat. Biol. Relat. Stud. Phys. Chem. Med. 49, 415. [DOI] [PubMed] [Google Scholar]
- Arteel GE, Thurman RG, Yates JM, Raleigh JA (1995). Evidence that hypoxia markers detect oxygen gradients in liver: pimonidiazole and retrograde perfusion of rat liver. Brit. J. Cancer 72, 889. [DOI] [PMC free article] [PubMed] [Google Scholar]
- Brizel DM, Scully SP, Harrelson JM et al. (1996). Tumour oxygenation predicts for the likelihood of distant metastases in human soft tissue sarcoma. Cancer Res. 56, 941. [PubMed] [Google Scholar]
- Carayon P & Bord A (1992). Identification of DNA‐replicating lymphocyte subsets using a new method to label the bromodeoxyuridine incorporated into the DNA. J. Immunol. Meth. 147, 225. [DOI] [PubMed] [Google Scholar]
- Denekamp J (1992). Inadequate vasculature in solid tumours: consequences for cancer research strategies. Brit. J. Radiol. Supplement 24, 111. [PubMed] [Google Scholar]
- Graeber TG, Osmanian C, Jacks T et al. (1996). Hypoxia‐mediated selection of cells with diminished apoptotic potential in solid tumours. Nature 379, 88. [DOI] [PubMed] [Google Scholar]
- Hodgkiss RJ, Jones G, Long A, Parrick J, Smith KA, Stratford MRL (1991). Flow cytometric evaluation of hypoxic cells in solid experimental tumours using fluorescence immunodetection. Brit. J. Cancer 63, 119. [DOI] [PMC free article] [PubMed] [Google Scholar]
- Hodgkiss RJ & Wardman P (1992). The measurement of hypoxia in tumours. Brit. J. Radiol. Supplement 24, 105. [PubMed] [Google Scholar]
- Iversen PO (1997). Blood flow to the haemopoietic bone marrow. Acta Physiol. Scand. 159, 269. [DOI] [PubMed] [Google Scholar]
- Iversen PO, Mortensen BT, Nicolaysen G, Benestad HB (1993). Decreased blood flow to rat bone marrow, bone, spleen, and liver in acute leukaemia. Leukaemia Res. 17, 663. [DOI] [PubMed] [Google Scholar]
- Iversen PO, Nicolaysen G, Benestad HB (1992). Blood flow to the bone marrow during development of anemia or polycythemia in the rat. Blood 79, 594. [PubMed] [Google Scholar]
- Martens ACM & Hagenbeek A (1985). Detection of minimal disease in acute leukaemia using flow cytometry: studies in a rat model for human acute leukaemia. Cytometry 6, 342. [DOI] [PubMed] [Google Scholar]
- Martens ACM, Johnson RJ, Kaizer H, Hagenbeek A (1984). Characteristics of a monoclonal antibody (RM124) against acute myelocytic leukaemia cells. Exp. Hematol. 12, 667. [PubMed] [Google Scholar]
- Mortensen BT, Jensen PØ, Helledie N, Iversen PO, Ralfkiær E, Larsen JK, Madsen MT (1998). Changing bone marrow micro‐environment during development of acute myeloid leukaemia in rats. Brit. J. Haematol. 102, 458. [DOI] [PubMed] [Google Scholar]
- Nordsmark M, Høyer M, Keller J, Nielsen OS, Jensen OM, Overgaard J (1996). The relationship between tumour oxygenation and cell proliferation in human soft tissue sarcomas. Int. J. Radiat. Oncol. Biol. Phys. 35, 701. [DOI] [PubMed] [Google Scholar]
- Vindeløv LL & Christensen IJ (1990). A review of techniques and results obtained in one laboratory by an integrated system of methods designed for routine clinical flow cytometric DNA analysis. Cytometry 11, 753. [DOI] [PubMed] [Google Scholar]
- Webster L, Hodgkiss RJ, Wilson GD (1995). Simultaneous triple staining for hypoxia, proliferation, and DNA content in murine tumours. Cytometry 21, 344. [DOI] [PubMed] [Google Scholar]
- Webster L, Hodgkiss RJ, Wilson GD (1998). Cell cycle distribution of hypoxia and progression of hypoxic tumour cells in vivo. Brit. J. Cancer 77, 227. [DOI] [PMC free article] [PubMed] [Google Scholar]