

Abstract
Abstract. Objective: The mechanisms of renewal of skin and mucosal epithelia in vivo are associated with hierarchies of stem and amplifying cells organized in distinct spatial patterns. Stem and amplifying characteristics persist after isolation and growth of human keratinocytes in vitro but the pattern for murine keratinocytes has been less clear. Materials and Methods: Murine keratinocytes were grown in low calcium media and examined for their patterns of colony morphologies. Results: We consistently identified three types of colonies, one of which contains concentric zones of amplifying and differentiated cells surrounding a central zone of cells that have patterns of expression and behavioural characteristic of stem cells. This zonal organization facilitated analysis of stem cell formation and loss. Cells in the central stem cell zone undergo rapid symmetric divisions but expansion of this population is partially limited by their peripheral transition into amplifying cells. A striking feature of central zone cells is their enhanced apoptotic susceptibility and stem cell expansion limited by consistently high background rates of apoptosis. This occasionally reaches catastrophic levels with elimination of the entire central zone. Conclusion: In vitro amplification of stem cells for the generation of engineered tissue has tended to focus on control of asymmetric division but these findings suggest that development of mechanisms protecting stem cells from apoptotic changes are also likely to be of particular value.
INTRODUCTION
Regeneration of the various self‐renewing tissues of the body depends ultimately on a subset of proliferative cells, described as somatic stem cells (SCs), that are characterized by their high capacity for self‐renewal and by their ability to generate cells that differentiate to maintain tissue function (Lajtha 1979; Potten 1983). In many continuously renewing tissues, the differentiating progeny of SCs undergo a limited number of divisions that amplify the maturing cell population (Potten 1981; Morrison et al. 1995) and such tissues therefore consist of a hierarchy of at least three cell types: SCs, transit amplifying cells and post‐mitotic differentiating or differentiated cells (Tudor et al. 2004). Epithelial SCs in murine and human tissues in vivo are usually distributed in relation to various regionally differing patterns of epithelial structure, such as the small columnar units and rete structures present in stratifying epithelia, the bulge regions of hair follicles, the limbal region of cornea and the crypts of the intestinal mucosa (Bickenbach 1981; Potten 1983; Mackenzie 1997; Cotsarelis et al. 1999). This patterning appears to be associated with the presence of ‘SC niches’, localized regions that have the ability to support SC survival (Watt & Hogan 2000; Fuchs et al. 2004). When isolated and grown in vitro, keratinocytes are removed from at least some of the tissue interactions that normally control in vivo patterns of SC behaviour (Fuchs et al. 2004; Tudor et al. 2004) and normal epithelial structure is lost. However, human keratinocytes generate a range of colony formations that have been classified morphologically as holoclones, meroclones and paraclones and these appear to contain cells corresponding, respectively, to stem and early and late amplifying cells (Barrandon & Green 1985; Barrandon & Green 1987). Generation of this range of colony forms is typical of cells isolated from many differing human epithelia and analysis of the clonal patterns generated by cells isolated from microdissected tissues has been used to determine the distribution of SCs in various epithelial structures (Rochat et al. 1994; Pellegrini et al. 2001). Such observations indicate that some aspects of SC behaviour persist in vitro (Tudor et al. 2004).
Cultures of epithelial cells can be generated from small biopsies and, even after extensive in vitro passage, a range of colony morphologies persists (Rheinwald & Green 1975; Barrandon & Green 1987). Sheets of epithelium formed by allowing such cultures to reach confluence can permanently re‐epithelialize burns and other wounds (Rheinwald & Green 1975; De Luca et al. 1990; Compton et al. 1998) indicating the in vitro persistence of SCs, or at least of cells able to re‐acquire SC properties when returned to in vivo conditions. However, clinical experience suggests less successful survival of grafts made from extensively passaged cells and experimental evidence indicates that with extended passage there is reduction in the proportion of holoclones and eventual exhaustion of the SC component of epithelial cultures (Mathor et al. 1996). Many of the proposed clinical procedures involving gene therapy and tissue engineering will depend on in vitro expansion of somatic SCs (Bickenbach & Chism 1998) and better information concerning their in vitro behaviour would therefore be valuable. So far, however, detailed analysis of possible mechanisms leading to loss of epithelial SCs in vitro has been hindered by a lack of methods for their consistent identification in living cultures (Bickenbach & Chism 1998; Tani et al. 2000).
Methods for consistent and expansive clonal growth of neonatal and adult murine keratinocytes have been reported (Morris et al. 1987; Bickenbach & Chism 1998; Hager et al. 1999; Caldelari et al. 2000; Kaur et al. 2004; Redvers & Kaur 2005) and in exploring methods to expand the small numbers of cells that can be isolated from murine oral mucosae, we have observed generation of a series of cell and colony morphologies that appears to allow direct in vitro visualization of stem and amplifying cell populations. Examination of such colonies suggests that murine epithelial SCs undergo symmetric divisions and proliferate quite rapidly in vitro. However, expansion of this population is limited partly by their continuous transition into transient amplifying cells and partly by their high, and occasionally catastrophic, levels of apoptosis.
MATERIALS AND METHODS
Preparation of tissues
Results reported are based on examination of a series of cultures derived from over 26 independent isolations of murine cells from the skin of ears and footpads, and from the mucosa of the lingual, palatal and buccal oral surfaces. Six‐week‐old C57BL/6 mice were purchased from Harland Laboratories (Oxford, UK) with appropriate ethical permission. Typically, tissues from each site were removed from six mice, pooled and processed at the same time. Ears were removed and shaved on both sides to remove hair, and other tissues were collected by sharp dissection. All tissues were immersed in 0.2% chlorhexidine for 5–10 min before transfer to tubes containing defined keratinocyte serum‐free medium (dK‐SFM). All media and adjuvants were purchased from Invitrogen (Paisley, UK) unless otherwise stated and media were supplemented with an antibiotic/antimycotic mixture containing 10 000 units/mL penicillin G sodium, 10 µg/mL streptomycin sulphate, 25 µg/mL amphotericin and 5 mL of Nystatin. After overnight incubation at 4 °C, tissues were vortexed to remove any potentially contaminated loose surface material and medium was changed three times with further vortexing.
Removal of epithelial sheets and isolation of keratinocytes
Groups of specimens were immersed in 2 mL of dispase II (1.2 units/mL from Roche, Lewes, UK) and were left to digest at 4 °C overnight. Epithelia were removed from the connective tissues as intact sheets and were further dissociated into a cell suspension by immersion in Trypsin‐EDTA (0.05% trypsin, 0.53 mm EDTA‐4Na) for 5–10 min at 37 °C. Trypsin was inactivated by addition of dK‐SFM medium containing 10% foetal bovine serum (FBS) and tissues were agitated to aid cell dissociation before passing through a 100 µm mesh cell strainer. Cells were spun down at 65 g for 5 min, pellets re‐suspended in dK‐SFM and the cells were counted. Typically cells were plated at 1 × 10⁵ per T25 flask for palate, tongue, footpad and buccal epithelia and at 3 × 10⁵ per T25 for ear epidermis. They were then cultured in 5% CO2 at 37 °C in dK‐SFM medium supplemented with 10 ng/mL epidermal growth factor (EGF), 1 × 10⁻¹⁰ m cholera toxin and the antibiotic/antimycotic described above, but without Nystatin. Culture media were re‐plenished every 2–3 days. Colonies formed from primary cultures, and from cultures up to passage 20, were monitored daily and cell population growth was recorded by phase‐contrast microscopy and by time‐lapse video recordings. For storage, cells were frozen in FBS/dimethyl sulfoxide (9 : 1) and held at –80 °C.
Cells were also cultured using two other media. The method described by Hager et al. (1999) involved growth of cells in a low calcium medium consisting of Eagle's minimal essential medium without calcium (Cambrex, Wokingham, UK) supplemented with 2 ng/mL EGF, 0.4 µg/mL hydrocortisone, 0.75 mm aminoguanidine nitrate and 10−10 m cholera toxin and 9% chelexed FBS (termed E medium). This medium was mixed with an equal part of the same medium pre‐conditioned by growth of fibroblasts isolated from murine ear dermis. Cells isolated from footpads were also grown in CnT‐07 medium (Chemicon, Chandlersford, UK) a formulation described by the manufacturer to support epithelial progenitor cells. For growth in either of these media, epithelial cells were isolated and cultured at 37 °C and 5% CO2 as described above.
Cell passage
For routine passage, cells were lifted before colonies became confluent, using pre‐warmed Trypsin‐EDTA at 37 °C, for 10–15 min. Trypsin was inactivated by the addition of dK‐SFM containing 10% FBS, cell suspensions were centrifuged, re‐suspended in a known volume of dK‐SFM, counted and aliquoted at the appropriate dilution into fresh culture flasks. For routine passage, cells were split at dilutions ranging from 1 : 2 to 1 : 20, and to examine colony morphologies cells were typically plated at 1 × 10⁵ cells/cm2. For comparison of the abilities of cells within colonies of different morphologies to initiate new cultures, individual colonies were isolated with cloning rings and their cells then isolated for passage as described above.
Immunofluorescent assessment of patterns of cell differentiation and apoptosis within colonies
To assess patterns of cell differentiation within and between colonies, cells were fixed in the culture flasks for 5 min in ice‐cold acetone/methanol (50/50), and were washed and blocked in phosphate‐buffered saline (PBS) containing 2% bovine serum albumin and 0.2% Triton‐X (PBSB) for 1 h at room temperature. Specimens were stained with a range of monoclonal antibodies (mAbs) against various cytokeratins 1, 6, 8, 10, 14, 15, 16, 18, 19 (respectively, mAbs LHK1, LHK6, LL001, LHP2, LL002, LHK15, LL025, LH18, LP2K, gifts of Professor Irene Leigh), and cytokeratins 4 and 13 (mAbs 6B10 and IC7, Abcam). Colonies were also stained for expression of other molecules reported to show differential staining of SCs including β1 integrin (Upstate, 05–232), E‐cadherin and connexins 43 and 26 (Zymed, 18–0223, 71–0700, 71–0500).
Laser capture, RNA isolation and Q‐PCR
Cells were plated at clonal density onto PEN membrane duplex dishes (Carl Zeiss, Thornwood, NY, USA). After 10–15 days when well‐formed Type III colonies were identifiable, a Palm Microbeam Laser Microdissection unit was used to cut free three concentric regions of the support membrane bearing zones of type 1, 2 or 3 cells. Each isolated cell sample was put individually into lysis buffer and total RNA generated using the CellsDirect One‐Step qRT‐PCR kit (Invitrogen) and quantified using a NanoDrop unit (Wilmington, Delaware, USA). Generation of cDNA used the SuperScript III first‐strand synthesis supermix for qRT‐PCR (Invitrogen) and SYBR Green Q‐PCR was carried out using the Brilliant SYBR Green kit (Stratagene, La Jolla, CA, USA) on an MX3005P Q‐PCR apparatus. Between 50 and 100 ng of cDNA was probed with gene‐specific primers designed by Primer 3 software with quantity and reaction efficiency determined by extrapolation from standard curves. The primers used were: mouse Oct‐4 – forward: CCAATCAGCTTGGGCTAGAG; reverse: CCTGGGAAAGGTGTCCTGTA (product length: 129 bp). Mouse c‐myc – forward: TCTCCATCCTATGTTGCGGTC; reverse: TCCAAGTAACTCGGTCATCATCT (product length: 114 bp)
Induced differentiation of cultured keratinocytes
To assess the ability of calcium to induce differentiation, freshly isolated keratinocytes and keratinocytes from passages 18, 19 and 20 were plated and, 2 days later, the calcium concentration of the culture medium was raised from < 0.06 mm to 1.2 mm by the addition of calcium chloride. After 3 days of further growth, the state of differentiation of treated and untreated control cells was assessed morphologically and by immunohistochemistry. Primary antibodies against involucrin (Lab Vision, Newmarket, UK; RB‐10288) and desmoplakins I and II (Cymbus Biotechnology, Eastleigh, UK), at dilutions of 1 : 500 and 1 : 100, respectively, were washed then incubated with FITC‐conjugated rabbit antimouse secondary antibody (DAKO, Ely, UK), diluted 1 : 80 in PBSB for 3 h at room temperature; cells were counterstained using Hoechst 33258 to enable visualization of cell nuclei, and then mounted in an antifade mountant (DAPI, Vectashield, Vector Laboratories, Burlingame, CA, USA).
Assessments of apoptosis and cell proliferation
To assess of the level and distribution of apoptosis in colonies, primary cultures and cultures at all subsequent stages were examined using high magnification phase contrast microscopy and primary cultures and cultures up to passage 5 also prepared, as described above, for staining with an antibody to localize cleaved caspase‐3 (New England Biolabs, Hitchin, UK).
For assays of proliferation, primary cell populations, and populations of cells up to passage 18, were allowed to grow to form morphologically distinct colonies; they were incubated with 50 µg/mL bromodeoxyuridine (BrdU; SigmaAldrich, Gillingham, UK), fixed in 70% ethanol and then treated with 4 m HCl before blocking endogenous peroxidase with 0.3% hydrogen peroxide. After overnight incubation at 4 °C with an anti‐BrdU primary antibody (1 : 100), cells were washed in PBS, incubated with a rabbit antimouse horseradish peroxidase‐conjugated secondary antibody (1 : 200) for 2 h, and reaction was visualized using a 3,3′‐diaminobenzidine Vectastain kit (Vector Laboratories, Peterborough, UK).
RESULTS
Culture and colony characteristics
The number of keratinocytes isolated from each tissue was approximately proportional to the size of the samples available with the average yields from six mice ranging between 0.4 and 2.2 × 10⁶ for all tissues except for ear (7.7 × 10⁶). Phase contrast microscopy indicated that cultures of cells from each type of tissue developed a similar range of morphologically differing colonies (Fig. 1a–f) and, in both early and late cultures, colonies could be classified into three types based on their cell content and general morphology. Type I colonies contained cells termed type 1 cells, which were irregularly sized, flattened or spindle shaped and loosely spaced. These colonies, despite some early growth, showed little further expansion. Type II colonies consisted of a peripheral zone of type 1 cells and a central zone of type 2 cells, which were smaller, more compact, and of more uniform size than those of type 1. Some Type II colonies grew to quite large sizes before becoming growth arrested. Type III colonies contained similar concentric zones of type 1 and 2 cells, but were characterized by an additional central zone of yet smaller and more closely packed type 3 cells. If these cultures were re‐fed without passaging, Type III colonies grew extensively and showed continuing expansion of the width of the zones of type 2 and 3 cells (Fig. 1g–i). Despite minor tissue‐specific differences, these three basic types of cell and colony morphologies were clearly recognizable for each type of tissue.
Figure 1.
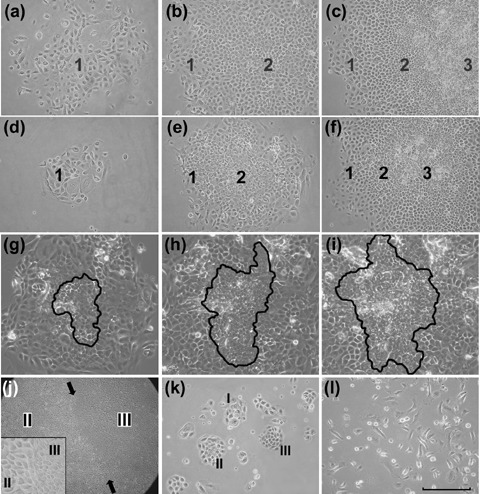
Colony formation in cultures of mouse epithelial cells. (a–c) Type I, II and III colonies in a culture of ear epidermal cells 14 days after plating. The type 1 colony consists only of large ovoid or flattened cells that are loosely scattered. The type 2 colony consists of a peripheral rim of type 1 cells enclosing a zone of type 2 cells that are smaller, rounded and closely packed together. The type 3 colony has a similar distribution of type 1 and 2 cells but has an additional central zone of smaller and more refractile type 3 cells. (d–e) Similar series of colonies in a culture of mucosal epithelial cells from tongue. (g–h) Images from a 48‐h time lapse video of a Type III colony in a culture of footpad epidermal cells. The zone of type 3 cells, which has been outlined, shows an approximate doubling of cells during both the first (g to h) and second (h to i) 24‐h periods. (j) Low power image of a large Type III colony (palatal epithelium) showing large zones of type 2 and 3 cells demarcated by a clear boundary (arrows). At higher magnification (inset) the abrupt change in cell size at this boundary is seen. (k) A primary culture of palatal epithelial cells 5 days after plating showing a mixture of early Type I, II and III colony forms. (l) A culture of ear epidermal cells grown in E medium lacks distinct colony formation but shows a spectrum of cells from small and rounded to large, flattened and elongated (scale bar; for a–f,k,l = 150 µm, g–i = 120 µm, for j = 600 µm).
Daily monitoring of individual colonies after plating indicated that early cell and colony morphologies were predictive of subsequent colony behaviour (Fig. 1k). Most cells in primary isolates of keratinocytes were adherent within 15–20 min of plating, after about 48 h cells had flattened and started to divide and by around 5 days, small colonies had formed. After in the region of 10 days, some colonies started to stratify and shed cells into the culture medium. Some keratinocytes were maintained continuously in culture and underwent up to 20 passages over a 6‐month period. Isolation of cells from individual colonies using cloning rings showed that colony development depended on the type of cells plated. Cells from Type I colonies generated few colonies consisting of flattened cells showing Type I colony morphology. Re‐plating cells from Type II colonies produced both Type I and Type II colonies. Re‐plating Type III colonies generated cultures that re‐developed all three colony types and could themselves be re‐passaged.
Cultures grown using the methods of Caldelari et al. (2000) and of Hager et al. (1999) could also be extensively passaged and continued to display a range of cell morphologies corresponding to type 1, 2 and 3 cells during expansion (Fig. 1l). Although typical Type I, II and III colony morphologies were formed when cells were grown in the medium described by Caldelari et al. (2000), cultures grown in E medium (Hager et al. 1999) formed less cohesive colonies. However, if cells that had been expanded in E medium were re‐plated in dK‐SFM, typical Type I, II and III colonies were formed.
Colony growth and cell proliferation
For each type of tissue cultured, staining to identify cells that had incorporated BrdU indicated that Type I colonies contained few labelled cells (Fig. 2a) and the large, flattened type 1 cells at the peripheries of Type II and III colonies were also infrequently labelled. However, the majority of type 2 cells in either Type II or III colonies showed labelling with BrdU indicating a high level of proliferation (Fig. 2b,c). The level of BrdU labelling was also typically high for the type 3 cells forming the central zone of Type III colonies but the presence of small central patches of unlabelled cells was an occasional finding (Fig. 2c).
Figure 2.
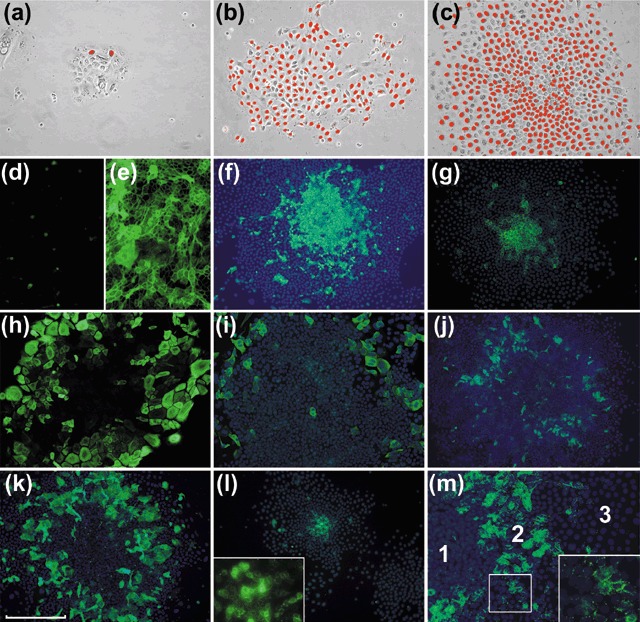
Proliferation and differentiation in murine colonies. Staining for BrdU cell labelling in Type I, II and III colonies (a–c, respectively) shows little labelling of flattened type 1 cells and high levels of labelling of type 2 and 3 cells. The Type III colony shown in (c) has a central area of lesser labelling, an appearance occasionally seen in large colonies. Panels d–m show IF staining of colonies with mAbs against various markers, with or without Hoechst nuclear counterstain. Cultures grown in low (< 0.06 mm) calcium media (d) show little staining for Dsg but there is marked expression after growth for 72 h (e) at a calcium concentration of 1.2 mm. Type III colonies in cultures of palatal keratinocytes stained for K15 (f) and footpad keratinocytes stained for E‐cadherin (g) with strong staining mainly restricted to the central zones of type 3 cells. A Type III colony of buccal keratinocytes (h) shows staining of large flattened peripheral cells for K18. A colony of palatal keratinocytes (i) shows a similar pattern for K19. Colonies of buccal keratinocytes stained for K4 (j) and K16 (k) show the presence of differentiated flattened suprabasal cells. A Type II colony stained for connexin 26 (l) shows staining of central type 2 cells which at higher magnification can be seen to be largely punctate and at the cell peripheries. A Type III colony shows similar staining of the zone of type 2 cells but not of type 1 and 3 cells (scale bar; for a–c = 150 µm, d–m = 250 µm).
Induced differentiation of cells
Raising calcium concentration of the culture medium from 0.06 mm to 1.2 mm resulted in several cellular changes. Within 24 h, typical high contrast of cell peripheries of type 3 cells growing in low calcium medium became less distinct under phase contrast microscopy and the level of proliferation of passage 20 cells, assessed by BrdU labelling, fell to 45% of control levels. By day 3, immunohistochemical staining of cells of all zones greatly increased for the differentiation markers desmoplakin and involucrin (Fig. 2d,e).
Patterns of cell differentiation within colonies
All cells in all types of colony stained for K5 and K14, indicating their common origin from stratifying epithelia. Cell staining patterns for other keratins varied depending on their epithelium of origin and their position within the colonies (Table 1, Fig. 2f–k). Type 1 cells did not stain consistently nor strongly for keratins normally associated with either epidermal (K1, K10) or mucosal (K4, K13) differentiation patterns but stained for expression of keratins typical of simple epithelia. Type II and III colonies in epidermal cultures stained for the differentiation markers K1 and K10 and in mucosal cultures for K4 and K13. Cell stratification in colonies was not clearly identified by phase contrast microscopy but staining epidermal cultures for K6, 16, 1 or 10 and mucosal colonies for K6, 16, 4 or 13, showed the presence of larger flattened suprabasal cells overlying zones of type 2 cells. Type 3 cells did not express keratins associated with differentiation but stained K15, a keratin expressed by some epidermal and mucosal SC zones. Strong staining for E‐cadherin and β1 integrin expression was restricted to type 3 cells but low levels were also present in type 2 cells. Immunohistochemical staining for Connexin 43 showed it to be absent but Connexin 26 was expressed, although restricted to type 2 cells (Fig. 2l,m).
Table 1.
Expression of differentiation‐related markers by cell type
| Cell type Marker | Epidermis | Mucosa | ||||
|---|---|---|---|---|---|---|
| Type 1 cells | Type 2 cells | Type 3 cells | Type 1 cells | Type 2 cells | Type 3 cells | |
| K5, K14 | +++ | +++ | +++ | +++ | +++ | +++ |
| K4, K13 | – | ± a | – | ± | +++ | – |
| K1, K10 | – | + | – | – | – | – |
| K6, K16 | + | ++ b | – | + | ++ b | – |
| K8, K18 | + c | – | – | ++ | ± | – |
| K15 | – | ± d | ++ | – | ± d | ++ |
| K19 | ++ | – | – | ++ | – | – |
| E‐cadherin | – | ± | ++ | – | ± | ++ |
Only a few K4+.
K16+ suprabasal only, K6+ suprabasal and basal.
Weakly K8+.
A few scattered positive cells.
Expression of Oct‐4 and c‐myc in relation to zones of type 1, 2 and 3 cells isolated by laser capture showed expression of Oct‐4 essentially restricted to type 3 cells, and of c‐myc to type 1 and 2 cells (Fig. 3).
Figure 3.
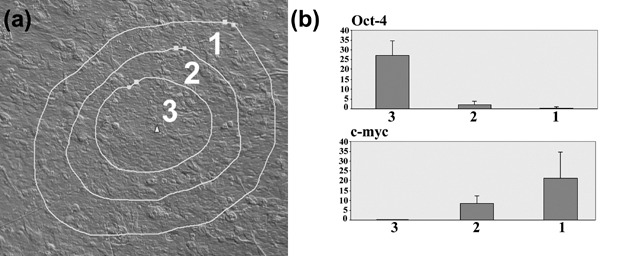
Expression of Oct‐4 and c‐myc in relation to cell zones. (a) Laser capture image showing the boundaries of the zones of cells collected from a Type III colony. (b) Q‐PCR data for Oct‐4 and c‐myc for type 1, 2 and 3 cells. Each bar represents the mean of five independent samples ± SD expressed as calculated copy number per cell.
Distribution of apoptosis
Phase contrast microscopy of colonies derived from all types of tissues, and in primary and all later passage cultures, identified the presence of small rounded cells that lay slightly above the plane of the neighbouring cells and showed the cell‐surface blebbing typical of apoptotic cells (Fig. 4a,b). These cells were found almost exclusively in the central region of Type III colonies. In addition, colonies up to passage 5 were stained for caspase‐3 expression. Central zones of type 3 cells showed a high proportion of cells with cleaved caspase‐3, a marker of apoptosis (Fig. 4c,d). Very few type 1 or type 2 cells exhibited expression of caspase‐3. Occasionally, massive apoptotic changes were seen in the central region of Type III colonies and during such changes, essentially all of the type 3 cells of the colony acquired strong caspase‐3 expression and an altered appearance in phase contrast microscopy (Fig. 4e,f). No marked differences in apoptotic patterns were found to be associated with culture age.
Figure 4.
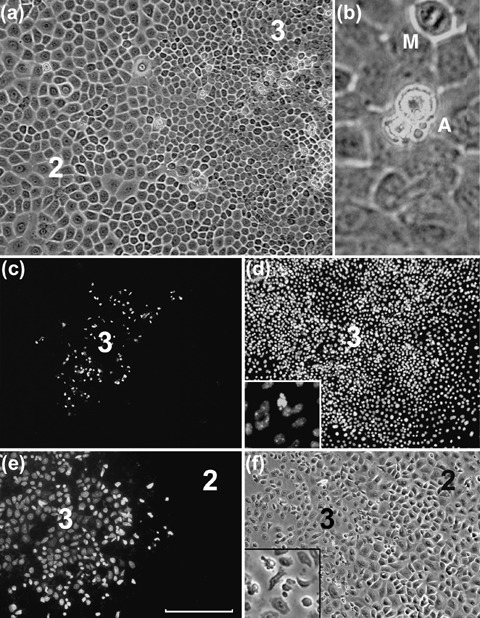
Apoptotic patterns in murine colonies. (a) The central region of a large colony of palatal epithelium showing the region of junction between zones of type 3 and type 2 cells. Some highly refractile cells are seen, almost entirely restricted to the zone of type 3 cells. At higher magnification (b) these cells are seen to have the characteristic fragmentation and blebbing of apoptotic cells (A). A mitotic figure (M) is also apparent. The central zone of a palatal epithelial colony stained for caspase‐3 (c) and with Hoechst stain (d) shows restriction of caspase‐3 staining to the zone of type 3 cells. At higher magnification (inset, d) Hoechst staining shows a blebbed appearance of caspase‐stained cells. (e,f) A colony of footpad keratinocytes shows caspase‐3 staining and altered morphology of almost the entire zone of type 3 cells (scale bar; for a = 100 µm, b = 25 µm, c,d = 300 µm, e,f = 150 µm).
DISCUSSION
Previous studies have indicated that murine epithelia contain a SC population that can be detected by label retention (Bickenbach 1981) and that label‐retaining cells behave as clonogenic SCs in vitro (Morris & Potten 1994). Populations of cells isolated by their adhesiveness (Bickenbach & Chism 1998) or higher expression of integrin α6 (Tani et al. 2000) are enriched with SCs, give rise to large colonies in standard cultures and to structurally complete epithelia in organ cultures (Bickenbach & Chism 1998; Kaur et al. 2004). Consistent with an identity as SCs, rapidly adherent epidermal cells are capable of 1000‐fold greater degree of in vitro expansion than other basal cells (Bickenbach & Chism 1998). Quantitative assays of the clonogenicity of keratinocytes derived from different strains of mouse have indicated that C57BL/6 mice produce markedly more expanding colonies than some other strains, a property associated with genetically differing SC loci (Popova et al. 2003; Popova & Morris 2004). In preliminary studies, we have found that cells isolated from C57BL/6 mice produced two to three times more Type III colonies than cells from BALB/c mice (data not shown) and the C57BL/6 strain was therefore chosen for subsequent studies.
With regard to several previous studies, the present results show that keratinocytes isolated from murine skin can be extensively expanded in vitro by growth in low calcium media and that they retain the capacity for differentiation, even after extensive passage and possible changes in ploidy (Hennings et al. 1980; Bickenbach & Chism 1998; Hager et al. 1999; Redvers & Kaur 2005; Redvers & Kaur 2005). An interesting novel observation is that keratinocytes of murine skin and mucosae developed a consistent spectrum of colony morphologies under some in vitro conditions. Colonies formed by human epidermal keratinocytes in vitro (Barrandon & Green 1987) are classified into three types. Holoclones are colonies of small tightly packed cells that have great growth potential and appear to include SCs. Paraclones are colonies of loosely distributed large cells that passage poorly and represent mainly late amplifying and post‐mitotic cells. Meroclones are colonies with intermediate morphological features and cellular growth potential that appear to consist mainly of early amplifying cells. Like human holoclone cells, murine type 3 cells are small, tightly packed and have the greatest replicative lifespan. As in human paraclones, type 1 cells are large and have limited growth potential. Like human meroclone cells, type 2 cells are proliferative but incapable of indefinite growth. The range of cell types found in murine epithelial cultures thus parallels the paraclone, meroclone and holoclone cells found in human cultures, but unlike human cultures, where each colony type consists mainly of similar cells, murine Type III colonies contain a full spectrum of cell types. Clusters of small cells may form in fibroblast‐conditioned Eagle's minimal essential medium (Dunnwald et al. 2001), but Type I, II and III colony patterns were found only with growth in dK‐SFM or CnT‐07 media. We have not found human keratinocytes to form murine‐type colonies in low‐calcium media (Costea et al. 2006) and we were unable to find it reported by others. However, staining human keratinocytes that have come to confluence indicates the presence of patches of cells staining more brightly for β1‐integrin, suggesting the establishment of patches of cells with stem cell characteristics (Jones et al. 1995).
Soon after plating murine keratinocytes, individual cells corresponding to type 1, 2 and 3 cells could be recognized and repeated observation of the same fields over time indicated that the larger type 1 cells seldom divided more than once or twice but that small individual type 3 cells generated clusters of tightly packed cells that continued to proliferate and expanded into large Type III colonies. Type II colonies seldom grew to greater than 5 mm in diameter before ceasing growth, whereas Type III colonies grew to 2–3 cm in diameter before being passaged. Cells isolated with cloning rings from Type III colonies could be passaged successfully to produce cultures containing all three colony types. Cells isolated from Type I or Type II colonies failed to generate expanding cultures, an outcome attributed to the lack of type 3 cells in the population of origin.
In addition to their clonogenic properties, murine cells differed in several other properties related to cell morphology. Type 1 cells showed low levels of labelling with BrdU and were rarely apoptotic. Type 2 cells showed high levels of BrdU labelling, very low‐background levels of apoptosis, and production of differentiating cells. Type 3 cells showed high levels of BrdU labelling and high‐background levels of apoptosis. Type 1, 2 and 3 cells also showed consistent differences in their patterns of marker expression. Type 1 cells expressed simple keratins, an atypical pattern not normally found in their stratifying epithelia of origin. Type 2 cells expressed keratins associated with epidermal hyperproliferation and with early differentiation. Type 3 cells expressed the basal markers K5 and K14 but lacked staining for differentiation markers. However, they stained for K15, E‐cadherin and β1‐integrin, markers that are more highly expressed by cells in the SC zones of some epithelial tissues (Moles & Watt 1997; Cotsarelis et al. 1999). Lack of connexin expression is reported to be characteristic of limbal and epidermal SCs (Matic et al. 2002). None of the murine colonies expressed connexin 43 but the position of cells expressing connexin 26 suggests that expression of this connexin is restricted to early differentiating cells. By Q‐PCR, expression of Oct‐4, a classical stem cell marker, was restricted to type 3 cells and of c‐myc, expression of which is associated with commitment of stem cells to differentiation (Waikel et al. 2001), was found in type 1 and type 2 cells only. These expression patterns, together with the high clonogenicity of type 3 cells, indicate that they represent the SC component of the cultures whereas type 2 cells have characteristics of amplifying cells, being larger, expressing early differentiation markers, showing rapid but unsustained proliferation, and acting as the immediate precursors of terminally differentiating cells.
Figure 5a represents stem and amplifying cell behaviour during homeostatic maintenance of stratifying epithelia in vivo (Potten 1974; Potten 1981). Cell renewal is thought to result from asymmetrical SC divisions, each of which generates one SC and one other cell that enters the differentiation pathway and undergoes a number of symmetrical divisions to amplify the terminally differentiating cell population. Lack of stem cell expansion in culture has been attributed to persistence of asymmetrical SC divisions (Merok & Sherley 2001), but without clear identifying markers (Dunnwald et al. 2001; Kaur et al. 2004) it has been difficult to determine whether SC loss under the non‐homeostatic condition of maintenance in vitro should alternatively be attributed to (i) differentially low rates of SC proliferation, (ii) shifts of SC division away from self‐renewal into differentiation or (iii) enhanced levels of apoptotic SC death. The murine system described here has the advantage that such events can be directly visualized within relevant zones of living cells. For example, the many mitotic cells visible in Zone III by phase contrast microscopy indicated that the level of proliferation of type 3 cells is high. It was also apparent that cells within Zone III undertake symmetrical divisions, each generating two new stem cells, except possibly at the periphery where transition of type 3 cells into type 2 cells occurred. Apoptotic cells visible by phase contrast microscopy showed that apoptotic cell death was essentially restricted to zones of type 3 cells and formed a significant additional mechanism of SC loss. However, the typically observed expansion of zones of type 3 cells (Fig. 1g–i) indicated that rates of SC production by symmetrical division usually exceeded the combined effects of loss by transition into differentiation and of apoptosis. Type 2 cells were seen to undergo symmetrical divisions prior to their transition from the proliferative pool into normal or abnormal pathways of terminal differentiation. This behaviour is represented diagrammatically in Fig. 5a,b.
Figure 5.
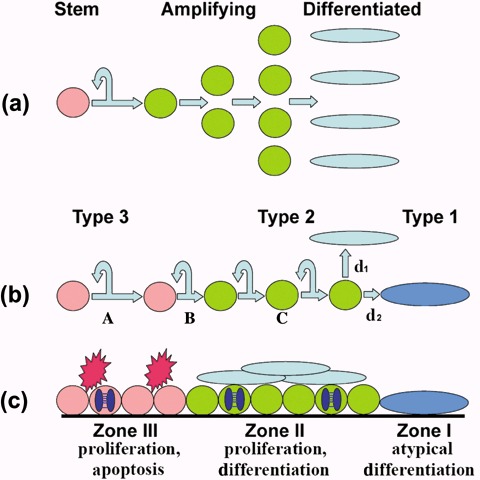
Diagrammatic representation of events in murine colonies. (a) Homeostatic maintenance of epidermis in vivo is thought to be associated with an asymmetric stem cell division pattern in which each division produce one stem cell and one differentiating cell that undergoes a series of amplification divisions before terminally differentiating. (b) Murine colonies in vitro differ in that SCs undergo a high proportion of symmetric divisions (A) that expand the SC population. Loss of SCs occurs by transition into amplifying cells. This transition may be associated with asymmetric divisions, as illustrated at (B), but is not necessarily so. The population of amplifying cells also expands by symmetrical divisions (C) before transition into appropriate (d1) or inappropriate (d2) differentiation pathways. (c) Each cell zone of Type III colonies is characterized by different activities and the occurrence of apoptosis in Zone III is an additional factor reducing of the rate of expansion of the SC population and may increase to such a level that all SCs are eliminated, generating a Type II colony that is no longer self‐renewing.
Details of niche structure differ regionally but features common to niches in various tissues include actions of extrinsic factors on cell fate and on division patterns, and these are often mediated by interactions with cells of other lineages (Watt & Hogan 2000; Arai et al. 2004; Tumbar et al. 2004; Li & Xie 2005). Maintenance of complex epithelial structures requires interactions with the mesenchyme (Watt & Hogan 2000; Tudor et al. 2004) but epithelial cells have a strong intrinsic ability to generate basic stem and amplifying cell patterns, both in vivo (Mackenzie 1997) and in vitro (Jones et al. 1995; Lowell et al. 2000; Locke et al. 2005). Such epithelial‐autonomous patterning may be associated with delta‐notch signalling (Lowell et al. 2000) but how such signalling influences division patterns is unclear. Inability to expand stem cell populations in vitro has been attributed to their maintenance of in vivo‐like asymmetric self‐renewal and slow division rates (Merok & Sherley 2001) but the asymmetric SC division pattern associated with normal tissue homeostasis is not invariable. For example, SC number can increase in vivo during growth and repair (Morrison & Kimble 2006) and in the in vitro conditions of the present study there was a marked shift away from asymmetry towards rapid symmetrical division with expansion of SC numbers. Medium additives such as cholera toxin and EGF may play some role in this change but the stem cell niche in vivo may possibly exert restrictive effects on SC expansion by imposition of asymmetrical division patterns (Tumbar et al. 2004).
For each of the epithelia examined, apoptotic cell death was a consistent feature of type 3 cells and this appeared to be the major factor limiting stem cell expansion. In some regions of the gut, epithelial SCs show low levels of apoptosis, possibly associated with normal control of cell number, but these cells are also exquisitely sensitive to apoptotic stimulation by radiation, possibly as a protective mechanism against accumulation of DNA damage (Potten 2001). Murine epidermal and oral mucosal keratinocytes show in vivo susceptibility to apoptotic induction with some observations suggesting that SCs are particularly sensitive to apoptosis‐resulting signals (Potten 1983; Potten 2001). In vivo, an intrinsically higher apoptotic sensitivity might be countered by pro‐survival properties of the SC niche (Li & Xie 2005) and absence of niche influences in vitro, together with other stresses, might be sufficient to produce the high‐background levels of apoptosis consistently seen among type 3 cells. Given intrinsic SC sensitivity to apoptosis, additional stress, perhaps associated with even minor changes in the culture environment, might be sufficient to trigger the catastrophic apoptotic responses occasionally observed for individual Type III colonies. These observations suggest that development of methods for in vitro amplification of epithelial stem cells, for tissue engineering or for other purposes, needs to focus not only on control of asymmetric division but also on mechanisms that protect SCs from apoptotic changes. The patterns of colony organization described here appear to provide a model that can aid both types of investigation.
ACKNOWLEDGEMENTS
This work was supported by grants (G14661, C20349) from the Biotechnology and Biological Sciences Research Council, UK.
REFERENCES
- Arai F, Hirao A, Ohmura M, Sato H, Matsuoka S, Takubo K, Ito K, Koh GY, Suda T (2004) Tie2/angiopoietin‐1 signaling regulates hematopoietic stem cell quiescence in the bone marrow niche. Cell 118, 149–161. [DOI] [PubMed] [Google Scholar]
- Barrandon Y, Green H (1985) Cell size as a determinant of the clone‐forming ability of human keratinocytes. Proc. Natl Acad. Sci. USA 82, 5390–5394. [DOI] [PMC free article] [PubMed] [Google Scholar]
- Barrandon Y, Green H (1987) Three clonal types of keratinocyte with different capacities for multiplication. Proc. Natl Acad. Sci. USA 84, 2302–2306. [DOI] [PMC free article] [PubMed] [Google Scholar]
- Bickenbach JR (1981) Identification and behavior of label‐retaining cells in oral mucosa and skin. J. Dent. Res. 60, 1611–1620. [DOI] [PubMed] [Google Scholar]
- Bickenbach JR, Chism E (1998) Selection and extended growth of murine epidermal stem cells in culture. Exp. Cell Res. 244, 184–195. [DOI] [PubMed] [Google Scholar]
- Caldelari R, Suter MM, Baumann D, De Bruin A, Muller E (2000) Long‐term culture of murine epidermal keratinocytes. J. Invest. Dermatol. 114, 1064–1065. [DOI] [PubMed] [Google Scholar]
- Compton CC, Nadire KB, Regauer S, Simon M, Warland G, O’Connor NE, Gallico GG, Landry DB (1998) Cultured human sole‐derived keratinocyte grafts re‐express site‐specific differentiation after transplantation. Differentiation 64, 45–53. [DOI] [PubMed] [Google Scholar]
- Costea DE, Tsinkalovsky O, Vintermyr OK, Johannessen AC, Mackenzie IC (2006) Cancer stem cells – new and potentially important targets for the therapy of oral squamous cell carcinoma. Oral Dis. 12, 443–454. [DOI] [PubMed] [Google Scholar]
- Cotsarelis G, Kaur P, Dhouailly D, Hengge U, Bickenbach J (1999) Epithelial stem cells in the skin: definition, markers, localization and functions. Exp. Dermatol. 8, 80–88. [DOI] [PubMed] [Google Scholar]
- De Luca M, Albanese E, Megna M, Cancedda R, Mangiante PE, Cadoni A, Franzi AT (1990) Evidence that human oral epithelium reconstituted in vitro and transplanted onto patients with defects in the oral mucosa retains properties of the original donor site. Transplantation 50, 454–459. [DOI] [PubMed] [Google Scholar]
- Dunnwald M, Tomanek‐Chalkley A, Alexandrunas D, Fishbaugh J, Bickenbach JR (2001) Isolating a pure population of epidermal stem cells for use in tissue engineering. Exp. Dermatol. 10, 45–54. [DOI] [PubMed] [Google Scholar]
- Fuchs E, Tumbar T, Guasch G (2004) Socializing with the neighbors: stem cells and their niche. Cell 19;116, 769–778. [DOI] [PubMed] [Google Scholar]
- Hager B, Bickenbach JR, Fleckman P (1999) Long‐term culture of murine epidermal keratinocytes. J. Invest. Dermatol. 112, 971–976. [DOI] [PubMed] [Google Scholar]
- Hennings H, Michael D, Cheng C, Steinert P, Holbrook K, Yuspa SH (1980) Calcium regulation of growth and differentiation of mouse epidermal cells in culture. Cell 19, 245–254. [DOI] [PubMed] [Google Scholar]
- Jones PH, Harper S, Watt FM (1995) Stem cell patterning and fate in human epidermis. Cell 80, 83–93. [DOI] [PubMed] [Google Scholar]
- Kaur P, Li A, Redvers R, Bertoncello I (2004) Keratinocyte stem cell assays: an evolving science. J. Investig. Dermatol. Symp. Proc. 9, 238–247. [DOI] [PubMed] [Google Scholar]
- Lajtha G (1979) Stem cell concepts. Differentiation 14, 23–34. [DOI] [PubMed] [Google Scholar]
- Li L, Xie T (2005) Stem cell niche: structure and function. Annu. Rev. Cell Dev. Biol. 21, 605–631. [DOI] [PubMed] [Google Scholar]
- Locke M, Heywood M, Fawell S, Mackenzie IC (2005) Retention of intrinsic stem cell hierarchies in carcinoma‐derived cell lines. Cancer Res. 65, 8944–8950. [DOI] [PubMed] [Google Scholar]
- Lowell S, Jones P, Le RI, Dunne J, Watt FM (2000) Stimulation of human epidermal differentiation by delta‐notch signalling at the boundaries of stem‐cell clusters. Curr. Biol. 10, 491–500. [DOI] [PubMed] [Google Scholar]
- Mackenzie IC (1997) Retroviral transduction of murine epidermal stem cells demonstrates clonal units of epidermal structure. J. Invest. Dermatol. 109, 377–383. [DOI] [PubMed] [Google Scholar]
- Mathor MB, Ferrari G, Dellambra E, Cilli M, Mavilio F, Cancedda R, De Luca M (1996) Clonal analysis of stably transduced human epidermal stem cells in culture. Proc. Natl Acad. Sci. USA 93, 10371–10376. [DOI] [PMC free article] [PubMed] [Google Scholar]
- Matic M, Evans WH, Brink PR, Simon M (2002) Epidermal stem cells do not communicate through gap junctions. J. Invest. Dermatol. 118, 110–116. [DOI] [PubMed] [Google Scholar]
- Merok JR, Sherley JL (2001) Breaching the kinetic barrier to in vitro somatic stem cell propagation. J. Biomed. Biotechnol. 1, 25–27. [DOI] [PMC free article] [PubMed] [Google Scholar]
- Moles JP, Watt FM (1997) The epidermal stem cell compartment: variation in expression levels of E‐cadherin and catenins within the basal layer of human epidermis. J. Histochem. Cytochem. 45, 867–874. [DOI] [PubMed] [Google Scholar]
- Morris RJ, Potten CS (1994) Slowly cycling (label‐retaining) epidermal cells behave like clonogenic stem cells in vitro . Cell Prolif. 27, 279–289. [DOI] [PubMed] [Google Scholar]
- Morris RJ, Tacker KC, Baldwin JK, Fischer SM, Slaga TJ (1987) A new medium for primary cultures of adult murine epidermal cells: application to experimental carcinogenesis. Cancer Lett. 34, 297–304. [DOI] [PubMed] [Google Scholar]
- Morrison SJ, Kimble J (2006) Asymmetric and symmetric stem‐cell divisions in development and cancer. Nature 441, 1068–1074. [DOI] [PubMed] [Google Scholar]
- Morrison SJ, Uchida N, Weissman IL (1995) The biology of hematopoietic stem cells. Annu. Rev. Cell Dev. Biol. 11, 35–71. [DOI] [PubMed] [Google Scholar]
- Pellegrini G, Dellambra E, Golisano O, Martinelli E, Fantozzi I, Bondanza S, Ponzin D, McKeon F, De LM (2001) p63 identifies keratinocyte stem cells. Proc. Natl Acad. Sci. USA 98, 3156–3161. [DOI] [PMC free article] [PubMed] [Google Scholar]
- Popova NV, Morris RJ (2004) Genetic regulation of mouse stem cells: identification of two keratinocyte stem cell regulatory loci. Curr. Top. Microbiol. Immunol. 280, 111–137. [DOI] [PubMed] [Google Scholar]
- Popova NV, Teti KA, Wu KQ, Morris RJ (2003) Identification of two keratinocyte stem cell regulatory loci implicated in skin carcinogenesis. Carcinogenesis 24, 417–425. [DOI] [PubMed] [Google Scholar]
- Potten CS (1974) The epidermal proliferative unit: the possible role of the central basal cell. Cell Tissue Kinet. 7, 77–78. [DOI] [PubMed] [Google Scholar]
- Potten CS (1981) Cell replacement in epidermis (keratopoiesis) via discrete units of proliferation. Int. Rev. Cytol. 69, 271–318. [DOI] [PubMed] [Google Scholar]
- Potten CS (1983) Stem Cells: Their Identification and Characterization. Cambridge, UK: Churchill Livingstone. [Google Scholar]
- Potten CS (2001) Apoptosis in oral mucosa: lessons from the crypt. A commentary. Oral Dis. 7, 81–85. [PubMed] [Google Scholar]
- Redvers RP, Kaur P (2005) Serial cultivation of primary adult murine keratinocytes. Methods Mol. Biol. 289, 15–22. [DOI] [PubMed] [Google Scholar]
- Rheinwald JG, Green H (1975) Serial cultivation of strains of human epidermal keratinocytes: the formation of keratinizing colonies from single cells. Cell 6, 331–343. [DOI] [PubMed] [Google Scholar]
- Rochat A, Kobayashi K, Barrandon Y (1994) Location of stem cells of human hair follicles by clonal analysis. Cell 76, 1063–1073. [DOI] [PubMed] [Google Scholar]
- Tani H, Morris RJ, Kaur P (2000) Enrichment for murine keratinocyte stem cells based on cell surface phenotype. Proc. Natl Acad. Sci. USA 97, 10960–10965. [DOI] [PMC free article] [PubMed] [Google Scholar]
- Tudor D, Locke M, Owen‐Jones E, Mackenzie IC (2004) Intrinsic patterns of behavior of epithelial stem cells. J. Investig. Dermatol. Symp. Proc. 9, 208–214. [DOI] [PubMed] [Google Scholar]
- Tumbar T, Guasch G, Greco V, Blanpain C, Lowry WE, Rendl M, Fuchs E (2004) Defining the epithelial stem cell niche in skin. Science 303, 359–363. [DOI] [PMC free article] [PubMed] [Google Scholar]
- Waikel RL, Kawachi Y, Waikel PA, Wang XJ, Roop DR (2001) Deregulated expression of c‐Myc depletes epidermal stem cells. Nat. Genet. 28, 165–168. [DOI] [PubMed] [Google Scholar]
- Watt FM, Hogan BL (2000) Out of Eden: stem cells and their niches. Science 287, 1427–1430. [DOI] [PubMed] [Google Scholar]