Abstract
Abstract. Both granulocyte colony‐stimulating factor (G‐CSF) and cyclophosphamide (CY) are employed in the clinic as mobilizing agents to stimulate the egress of haematopoietic stem/progenitor cells (HSPC) from bone marrow (BM) into peripheral blood (PB). However, although both compounds are effective, the simultaneous administration of G‐CSF + CY allows for optimal mobilization. The aim of this study was to compare morphological changes in major haematopoietic organs in mice mobilized by G‐CSF + CY. We employed the standard G‐CSF + CY mobilization protocol, in which mice were injected at day 0 with a single dose of CY followed by daily injection of G‐CSF for 6 consecutive days. We noticed that the cytoreductive effect of CY on BM and spleen tissue was compensated at day 2 by the pro‐proliferative effect of G‐CSF. Furthermore, as evidenced by histological examination of BM sections at day 4, egress of haematopoietic cells from BM was accelerated by 2 days as compared to mobilization by G‐CSF or CY alone; also, by day 6 there was accumulation of early haematopoietic (Thy‐1low c‐kit+) cells in the spleens and livers of mobilized animals. This implies that HSPC that are mobilized from BM and circulate in PB may ‘home’ to peripheral organs. We envision that such an accumulation of these cells in the spleen (which is a major haematopoietic organ in mouse) allows them to participate in haematopoietic reconstitution. Their homing to other sites (for example the liver) is evidence that BM‐derived stem cells are playing a pivotal role in organ/tissue regeneration. The potential involvement of major chemoattractants for stem cells, like stromal‐derived factor‐1 which is induced by CY in various regenerating organs such as the liver, requires further study. We conclude that inclusion of CY into mobilization protocols on the one hand efficiently increases the egress of HSPC from the BM, but on the other hand may lead to the relocation of BM stem cell pools to peripheral tissues.
INTRODUCTION
In physiological conditions, a very low number of immature haematopoietic stem cells (HSC) circulate in peripheral blood. They maintain an equilibrium between haematopoiesis in marrow tissue that is spread between distant bones (Lapidot & Petit 2002; Ratajczak et al. 2004a). However, the number of these cells in the peripheral blood can be increased by specific mobilization. Mobilization of haematopoietic stem and progenitor cells (HSPC) from the bone marrow into circulation can be induced in patients and animal models by a wide variety of molecules including cytoreductive drugs, such as cyclophosphamide (CY), chemokines, haematopoietic growth factors or haematopoietic cytokines, such as granulocyte colony‐stimulating factor (G‐CSF). G‐CSF is used clinically to mobilize HSPC for transplantation, alone or in combination with CY, which enhances the G‐CSF mobilizing ability.
It is known that during stem cell mobilization a high number of HSPC is released from the bone marrow into circulation (Caporali et al. 2001; Kozuka et al. 2002; Thomas et al. 2002). However, the morphology of bone marrow and other haematopoietic organs during this process is poorly appreciated. In our preliminary studies we decribed morphological changes in bone marrow after mobilization by single agents – cytoreductive CY (Karbicka et al. 2003) or the haematopoietic cytokine G‐CSF (Barcew et al. 2004). The aim of the present study was to evaluate the morphology of bone marrow, spleen and liver in mice during combined administration of both CY and G‐CSF.
MATERIALS AND METHODS
Mice
The experiment was performed on pathogen‐free, 5‐week‐old, mature female inbred BALB/c mice (Polish Academy of Sciences, Wroclaw, Poland). Animals were maintained under standard laboratory conditions in a 12 h/12 h light/dark cycle at 21 °C. Approval was obtained from the Local Ethical Committee. The animals were randomly divided into a control and three experimental groups. Mice from the experimental groups were injected intraperitoneally with a single dose (200 mg/kg bw) of CY (Endoxan, Asta Medica, Wangen, Switzerland) on day 0 of the experiment. CY was diluted in a saline solution according to the manufacturer's recommendations. In their categories, from day 1 to the end of the experiment, the mice were injected subcutaneously with 250 µg/kg bw of G‐CSF (Neupogen – F. Hoffmann‐La Roche, Basel, Switzerland). Mice from the first experimental group were injected with G‐CSF for 2 days, those from the second experimental group were given G‐CSF for 4 days, and those from the third experimental group received G‐CSF for 6 days. On day 0 the mice from the control group were injected intraperitoneally with phosphate‐buffered saline (PBS) at the same volume as CY in the mice in the experimental groups, and each day subsequently they were injected subcutaneously with PBS at the same volume as G‐CSF for the experimental mice. The experiment was terminated after 6 days. The mice from the control and experimental groups were killed by lethal anaesthesia with 90 mg/kg bw Thiopental (Biochemie GmbH, Kundl, Austria) after 2, 4 and 6 days of the experiment. Specimens of spleen and liver were harvested and fixed in Carnoy's solution (Bancroft & Gamble 2002). Femurs were decalcified and embedded in paraffin wax. For morphological studies, the specimens were stained with haematoxylin & eosin, and specimens of liver were stained with periodic acid Schiff. Additionally, a silver impregnation method was used to visualize reticular fibres in the spleen (Bancroft & Gamble 2002). Specimens of spleen and liver for immunostaining were fixed in freshly prepared 4% paraformaldehyde and embedded in paraffin wax.
Transmission electron microscopy (TEM)
For electron microscopy, the bone marrow of control and experimental mice was obtained (flushed from the femurs), using a syringe and Iscove's medium. The bone marrow was fixed in 0.25 m glutaraldehyde in 0.1 m cacodylate buffer pH 7.4 for 2 h at 4 °C, post‐fixed in 0.04 m OsO4, and dehydrated in ethyl alcohol (30–96%) and 100% acetone. They were subsequently embedded using a Spurr low‐viscosity embedding kit (Polysciences, Inc. Warrington, PA) (Spurr 1969). Ultrathin sections were cut on a Reichert OmU2 ultramicrotome (Leica Aktiengesellschaft, Vienna, Austria). Sections were contrasted with uranyl acetate and lead citrate (Reynolds 1963) and were viewed on a JEM‐1200 EX transmission electron microscope (JEOL Ltd Tokyo, Japan) at 80 kV.
Immunohistochemical staining
To identify early haematopoietic cells in the specimens of bone marrow, spleen and liver, immunohistochemical reactions were performed using the following antibodies: rabbit polyclonal anti‐Thy‐1 (H‐110) (Santa Cruz Biotechnology, Inc., Santa Cruz, CA, USA) – which reacts with Thy‐1 of mouse, rat and human origin and rabbit polyclonal antic‐Kit (C‐19) (Santa Cruz Biotechnology, Inc.) – which reacts with c‐Kit p145 (CD117) of mouse, rat and human origin.
To locate proliferating cells in the specimens of bone marrow in the femur and spleen of mice, rat monoclonal anti‐mouse Ki‐67 antigen (TEC‐3) antibody (DakoCytomation, Glostrup, Denmark) was used.
Briefly, for light microscopy, sections were cut at 5‐µm and were mounted on poly l‐lysine‐coated microscope slides. They were then deparaffinized, rinsed through graded alcohols, and washed with water. To reduce non‐specific staining, the specimens were immersed in 3% hydrogen peroxide for 30 min at room temperature to quench endogenous peroxidase activity. After having been washed in Tris–HCl‐buffered saline (TBS) twice for 5 min, the sections were submerged in 10 nm citric buffer, pH 6.0, and microwaved at high power twice, each time for 5 min. The specimens were then left to cool to room temperature in buffer solution (20 min). Specimens were again washed in TBS twice for 5 min, and non‐specific binding was blocked by incubation with 3% normal goat (polyclonal antibody) and horse (monoclonal antibody) sera for 30 min at room temperature. This was followed by incubation with the primary antibodies: anti‐Thy‐1 (1 : 500) or anti‐c‐Kit‐R (1 : 200), and anti‐Ki‐67 (1 : 50) as recommended in the manufacturers’ protocols at 22 °C. The specimens were subsequently washed twice with TBS for 5 min and incubated with biotinylated anti‐rabbit/mouse/goat immunoglobulins (as appropriate) (LSAB + AP Link, Universal, DAKO, Carpinteria, USA). Sections were washed in TBS and incubated for 30 min with streptavidin‐conjugated alkaline phosphatase (AP) (DAKO). Antibody binding was visualized with Fuchsin + chromogen (DAKO LSAB® + SYSTEM, AP) for c‐Kit‐R‐positive Thy‐1‐positive cells, and the ABComplex/HRP (DakoCytomation, Glostrup, Denmark) for Ki‐67‐positive cells. Sections were finally washed in TBS and counterstained with Mayer haematoxylin. Control specimens followed the same incubation procedure minus primary antibodies.
Ki‐67 labelling index
Ki‐67‐positive cells were counted in the bone marrow and spleen of control and experimental mouse samples on the 2nd, 4th and 6th days of mobilization, in each case from 10 randomly selected areas, with at least 100 cells in each. One thousand cells were screened from each specimen and the percentage of proliferating cells was calculated.
Flow cytometry
Six hours after G‐CSF injection on days 2, 4, and 6 peripheral blood was obtained in each case from the vena cava (with a 25‐gauge needle and 1‐mL syringe containing 250 U heparin) and enriched for light‐density mononuclear cells as described previously (Janowska‐Wieczorek et al. 2001). To determine the amount of c‐Kit‐R‐positive cells, flow cytometric analysis was performed. Briefly, 50 µL whole blood was stained with rat anti‐mouse c‐Kit‐R fluorescein isothiocyanate (FITC)‐conjugated monoclonal antibody (final concentration 1 µg/mL; BD Biosciences Pharmingen, San Diego, CA, USA). Samples stained with appropriate isotype controls (BD Biosciences Pharmingen) were also examined. After a 20‐min incubation on ice, 2 mL of FACS lysing solution (BD Biosciences Immunocytometry Systems, USA) was added to lyse the erythrocytes. The cells were washed twice in PBS, resuspended in 0.3 mL PBS, and analysed by FACScan using cellquest v.3.1 software (BD Biosciences Immunocytometry Systems, USA). Typically, 20 000 events were acquired and the percentage of c‐Kit‐R‐positive cells was determined for the whole leucocyte population.
Statistical analysis
Arithmetic mean and the standard deviation (mean ± SD) data were determined using the statgraphics v.5.0. package (Manugistic, Inc., Rockville, MD, USA). Statistical significance was defined as P < 0.05. Data were analysed using Student's t‐test for unpaired samples.
RESULTS
Morphology of bone marrow from mice mobilized with G‐CSF + CY
Light microscopy – control mice Haematopoietic cells were visible in bone marrow located in the so‐called haematopoietic cords. There were megakaryocytes visible with typical irregularly lobed nuclei. The lumina of sinusoidal capillaries were filled with single leucocytes.
Light microscopy – experimental group 1 The vascular compartment of the bone marrow (with dilated sinusoids filled with circulating erythrocytes) appeared normal compared to the haematopoietic compartment. Some erythrocytes and haemosiderin‐containing macrophages were however, visible outside the vessels in the haematopoietic compartment of bone marrow tissue (Fig. 1a and b).
Figure 1.
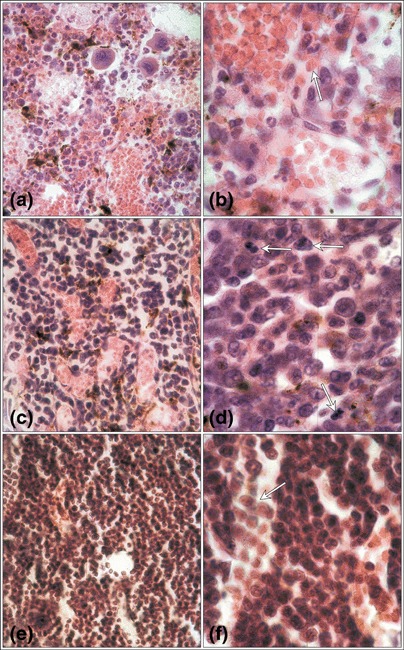
Mouse bone marrow mobilized with G‐CSF plus cyclophosphamide. Dilated sinusoid lumina filled with erythrocytes (a). Erythrocytes (arrow) and cells with haemosiderin among the cells of the haematopoietic compartment (b) on the 2nd day of mobilization. An increase in the haematopoietic cell number (c) and numerous proliferating cells (arrows) within the haematopoietic compartment (d) on the 4th day. The high cellularity of the bone marrow on the 6th day (e) and numerous leucocytes within the lumen of sinusoids (arrow) (f). Haematoxylin & eosin; (a,c,e) magnification × 670; (b,d,f) magnification × 1340 (magnifications at time of photography).
Light microscopy – experimental group 2 Sinusoids of the bone marrow were distinctly dilated but the area occupied by haematopoietic cells was larger and numerous proliferating cells were observed within the haematopoietic compartment. In the lumina of sinusoids single leucocytes were visible (Fig. 1c and d).
Light microscopy – experimental group 3 The number of haematopoietic cells, including numerous leucocytes, was higher in the lumina of the sinusoids (Fig. 1e and f).
Electron microscopy – control mice Capillaries, walls composed of a single layer of endothelial cells, were seen in the bone marrow and some erythrocytes were visible within the capillary lumina. Endothelial walls of the capillaries were discontinuous. The endothelial cells were clearly fenestrated and were resting on the equally discontinuous basal lamina (Fig. 2a).
Figure 2.
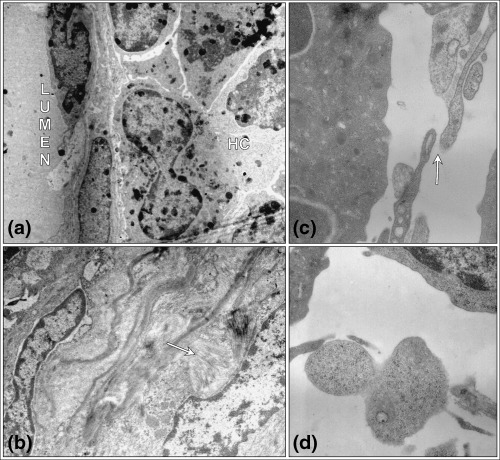
Ultrastructure of control mouse bone marrow on the days 2 and 4 of mobilization with G‐CSF plus CY. Endothelial cell resting on its discontinuous basement membrane, and cells of the haematopoietic compartment (HC) in the bone marrow (a). The destructive effect of cyclophosphamide on the 2nd day of mobilization – deposits of collagen fibres (arrow) are observed (b). Distance between endothelial cells (arrow) (c) and the passage of cells across the sinusoid fenestration (d) 4th day of mobilization. TEM (a) magnification × 4000; (b) magnification × 7500; (c) magnification × 20 000; (d) magnification × 15 000 (magnifications at time of photography).
Electron microscopy – experimental groups After two days of administering G‐CSF + CY, structure of the bone marrow was destroyed and symptoms of fibrosis were observed; collagen fibres were located near the sinusoids (Fig. 2b). After 4 days the ultrastructure of the tissue was similar to the bone marrow of the control group. Neutrophil polymorphs dominated the population of haematopoietic cells. Numerous leucocytes were located in the vicinity of the sinusoids. Enlarged spaces between the endothelial cells were evident (Fig. 2c). Cells traversing the endothelial wall were visible at several locations in the bone marrow as early as day 4 after treatment with CY + G‐CSF (Fig. 2d).
Immunolocalization of early haematopoietic cells in the bone marrow
Immunohistochemical labelling was found in the cytoplasm of bone marrow cells, identified with the two antibodies, anti‐c‐Kit‐R and anti‐Thy‐1. No reaction was indicated in the nuclei of these cells. These cells were at the same anatomical locations in the different specimens. Few haematopoietic cells displayed c‐kit‐R‐positive or Thy‐1‐positive reactivity (Fig. 3). To eliminate the possibility of this being non‐specific staining, the immunohistochemical reaction was carried out in control specimens with no primary antibody.
Figure 3.
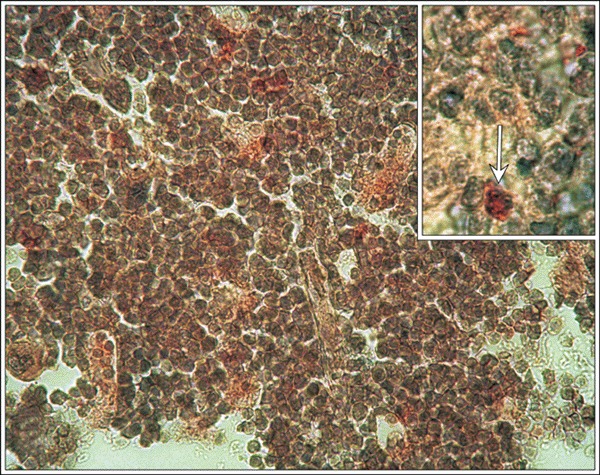
Individual c‐Kit‐R immunopositive early haematopoietic cells in the bone marrow. Control mice, (insert, arrow) c‐Kit‐R, magnification × 670; insert magnification × 1340 (magnifications at time of photography).
Immunolocalization of proliferating cells and the Ki‐67 labelling index in the bone marrow Ki‐67 expression was localized to the nuclei of bone marrow cells in control and experimental mice. The Ki‐67 labelling index indicated that higher numbers of proliferating cells were observed in the experimental group on day 4 (Fig. 4).
Figure 4.
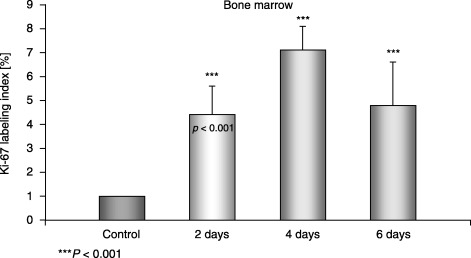
Ki‐67 labelling index in the bone marrow of control and experimental mice.
Morphology of the spleen of mice mobilized with CY and G‐CSF
Control mice The splenic pulp of control mice was composed of lymphoid nodules – that is part of the white pulp. This lymphoid tissue ensheathed the central arteries and lymph nodules. There was a marginal zone between the white pulp and red pulp. Red pulp was composed of elongated splenic cords that were located between the sinusoids. Megakaryocytes with typical irregularly lobed nuclei were visible in the red pulp. Silver staining revealed the presence of delicate reticular fibres within both the red and white pulp.
Experimental group 1 Spleens displayed elevated red pulp areas and smaller lymphoid nodules. Megakaryocytes and numerous cells containing haemosiderin granules were visible in the red pulp (Fig. 5a and b). Silver staining revealed prominent reticular fibres that were noticeably more dense than in control tissue.
Figure 5.
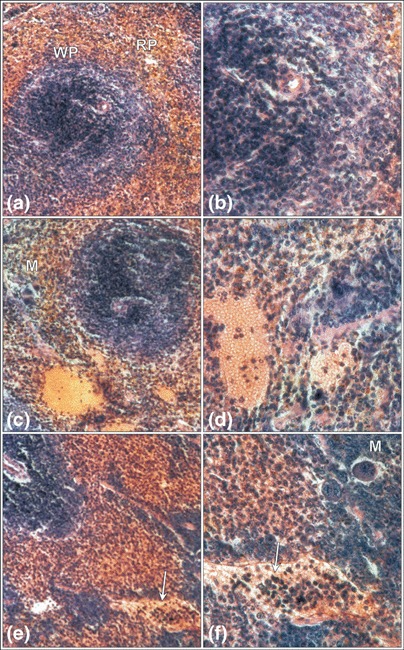
Mouse spleen after mobilization with G‐CSF plus Cy. The domination of the red pulp (RP) over the white pulp (WP) of spleen after 2 days (a,b) of mobilization, and dilated parenchymal vessels filled with erythrocytes and leukocytes on the 4th day (c,d). The parenchymal vessels filled with a higher number of leukocytes (arrow) on the 6th day of mobilization (e,f). Megakaryocytes (M) are visible. Haematoxylin & eosin (a,c,e) magnification × 330, (b,d,f) magnification × 670 (magnifications at time of photography).
Experimental group 2 In spleens of mice from this group the red pulp was more prominent than the white pulp. The lumina of trabecular vessels were considerably dilated and filled with erythrocytes plus a minor number of leucocytes. Single megakaryocytes and cells with haemosiderin granules were visible in the red pulp (Fig. 5c and d). Distribution and density of the reticular fibre network was similar to that of control spleens.
Experimental group 3 Red pulp continued to dominate over white pulp. However, a relative increase in white pulp was observed compared to the amount of white pulp observed in the spleens of the first and second experimental groups. Single megakaryocytes were present in the red pulp. The lumina of parenchymal vessels were filled with numerous leucocytes (Fig. 5e and f). Distribution and density of the reticular fibre network was similar to that of control spleens.
Immunolocalization of early haematopoietic cells in the spleen
Identification of early haematopoietic cells in the spleen of the control and experimental groups of mice was carried out with two different antibodies, which detected their respective antigens in the cytoplasm only, of cells proximal to each other. In the spleen of the control group, single Thy‐1‐positive or c‐Kit‐R‐positive cells were present in both white and red pulp (Fig. 6a). The highest number of immunoreactive cells was noted on day 6 and these were distributed both in the white and red pulp (Fig. 6b).
Figure 6.
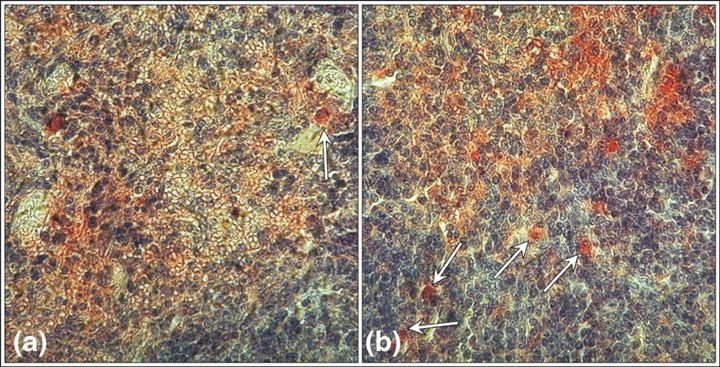
Individual Thy‐1 positive cells in the spleen of the mice from the control group (arrow) (a) and numerous positive cells in the spleen of mice after 6 days of mobilization (arrows) (b). Thy‐1, (a,b) magnification × 670 (magnifications at time of photography).
Immunolocalization of proliferating cells and the Ki‐67 labelling index in the spleen
Nuclei of cells from both red and white pulp in the spleen of both control and experimental groups of mice demonstrated immunohistochemical activity of Ki‐67. The Ki‐67 labelling index indicated that most of the proliferating cells were in the red pulp on day 4 of the experiment. The values were statistically significant (P < 0.001) (Fig. 7).
Figure 7.
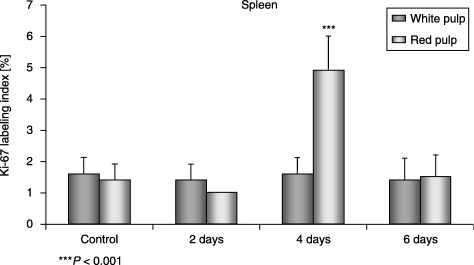
Ki‐67 labelling index in the white pulp and in the red pulp in spleens of control and experimental mice.
Liver morphology of mice mobilized with CY and G‐CSF
Control mice Classic liver lobules were clearly visible. At the apices of the lobules, portal spaces typically contained branches of the portal vein, hepatic artery and bile ducts and minor amounts of connective tissue. Hepatocytes were grouped in so‐called interconnecting plates. The radial disposition of the plates, forming a layer that was one or two cells thick, was visible within the lobule with the centrolobular vein at the middle. The plates of hepatocytes were separated by sinusoids containing Kupffer cells with prominent nuclei. The cytoplasm of hepatocytes stained with haematoxylin & eosin was eosinophilic and contained one or two nuclei with granular chromatin (not shown).
Experimental groups There were no distinct changes in liver morphology between the experimental groups of mice. However, on day 6 of the experiment numerous leucocytes were observed in the lumina of the central and lobular veins (not shown).
Immunolocalization of early haematopoietic cells in the liver
Both c‐Kit‐R‐positive and Thy‐1‐positive cells were observed in portal spaces and within the classic liver lobules of control mice. These cells were small and round in shape (not shown).
Percentage of c‐Kit‐R‐positive cells in peripheral blood
We found that the most significant increase in circulating c‐Kit‐R‐positive cells took place after the first 4 days of the experiment (P < 0.01) (Fig. 8).
Figure 8.
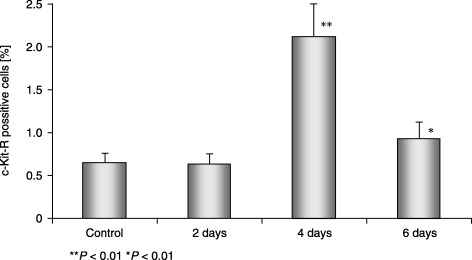
Percentage of c‐Kit‐R‐positive cells in MNC of control and experimental mice.
DISCUSSION
G‐CSF, which is produced by many types of cell, supports the proliferation and maturation of haematopoietic progenitors of the neutrophil lineage. Mobilization with G‐CSF is preceded by a prominent increase in the number of granulocytic precursors and mature granulocytes in the bone marrow (Levesque et al. 2002). CY is a DNA alkylating agent, with myelosuppressing and immunomodulatory properties, that is widely exploited in cancer immunotherapy, vaccination, tumour suppression and cytoreduction. The administration of CY in combination with G‐CSF augments the effect of stem cell mobilization.
In our study, we focused on the morphology of bone marrow. We also additionally studied the spleen and liver. Spleen is an active site of haematopoiesis in mice, not only in foetal life but also throughout adulthood (Yoder 2002). The liver, in contrast is a major haematopoietic organ only during embryogenesis. Haematopoiesis in the liver is first detected at 10.5 days post‐coitum in the mouse and remains the major site of haematopoiesis until the end of gestation (Chagraoui et al. 2003).
Administration of a single dose of CY followed by subsequent daily injections of G‐CSF caused morphological changes in the murine bone marrow, which were visible after the second day of mobilization. The presence of mature erythrocytes, normally confined to the vascular space, within the marrow environment implicate damage to the wall of the bone marrow sinusoids. This was further confirmed by ultrastructural examination by electron microscopy. Thus our observations are consistent with the study of Shirota & Tavassoli (1991) who reported damage of bone marrow endothelium after exposure to CY. We also observed the presence of macrophages loaded with haemosiderin, which indicates a role for macrophages in the removal of erythrocytes that may have leaked into bone marrow tissue.
Moreover, CY produced bone marrow fibrosis, as shown by synthesis and transient local deposition of collagen. The molecular basis of this process is unknown and seems to be multifactoral (Shivdasani 2002). Both in vivo and in vitro studies indicate the involvement of several cytokines such as transforming growth factor‐β1 (TGF‐β1; that is secreted by megakaryocytes and platelets), in the development of bone marrow fibrosis (Castro‐Malaspina 1984; Le Bousse‐Kerdiles & Martyre 1998; Chagraoui et al. 2002). TGF‐β1 stimulates bone marrow stromal cells to produce collagen and extracellular matrix proteins (Kimura et al. 1989; Chagraoui et al. 2002).
We noticed that the highest number of proliferating cells in bone marrow was present on the 4th day of mobilization. This indicates that the cytoreductive properties of CY was at this time compensated by the pro‐proliferative activity of G‐CSF. The histological changes in the bone marrow were more pronounced compared to the mobilization in mice given CY or G‐CSF alone (Karbicka et al. 2003). As shown by histological examination of bone marrow sections at day 4, the egress of haematopoietic cells from bone marrow was accelerated by 2 days as compared to mobilization by CY alone. Our previous study showed that the migration of HSC induced by CY started on the 6th day of mobilization (Karbicka et al. 2003).
The mechanistic aspect of G‐CSF‐induced mobilization of HSPC from the bone marrow has been widely studied. It is known that the location, survival, proliferation and differentiation of haematopoietic cells within bone marrow is based on the interactions of these cells with stromal cells and the components of the extracellular matrix within the specialized microenvironment of the bone marrow (Thomas et al. 2002; Papayannopoulou 2004). Interaction between stromal‐derived factor‐1 (SDF‐1) produced by bone marrow stromal cells and their receptor, CXCR4 expressed on HSPC, plays a crucial role here (Lapidot & Petit 2002; Petit et al. 2002). The chemotactic response of haematopoietic cells to SDF‐1 can be sensitized, for example with C3a anaphylatoxin (Reca et al. 2003), and egress of HSPC from bone marrow was accelerated by blocking the C3a–C3aR axis (Ratajczak et al. 2004b). Direct in vivo studies have demonstrated that mobilization with G‐CSF results in the activation of neutrophils to release the contents of specific or azurophilic granules and the accumulation of proteolytic enzymes within the bone marrow environment (Levesque et al. 2002), such as matrix metalloproteinase 9 (MMP‐9), lactoferrin, elastase, cathepsin G and proteinase. It has been documented that G‐CSF‐induced mobilization is associated with a dramatic reduction in SDF‐1 concentration in the bone marrow, caused directly by elastase activity (Petit et al. 2002). Other enzymes, for example MMP‐9 (McQuibban et al. 2001) and cathepsin G (Delgado et al. 2001), can also be involved in SDF‐1 degradation. Degradation performed by enzymes released by neutrophils inactivates SDF‐1, which in turn leads to a decrease of its chemoattractant activity for HSC in the bone marrow (Levesque et al. 2003). The process of G‐CSF mobilization is additionally facilitated by the cleavage of some adhesive molecules such as vascular cell adhesion molecule‐1 by proteases (Sudhoff & Sohnen 2002; Papayannopoulou 2004) or the modulation of their expression (Vermeulen et al. 1998; Carion et al. 2002). The mechanism of HSPC mobilization induced by G‐CSF or CY shows considerable similarity (2002, 2003). However, stem cell mobilization is most effective in patients receiving G‐CSF plus CY (Caporali et al. 2001; Kozuka et al. 2002).
Our histochemical observations indicate that the egress of HSPC from bone marrow starts between the 4th and 6th day after stimulation. Nevertheless, the most prominent egress of these cells during G‐CSF + CY‐induced mobilization was noticed on the 6th day. Thus, our findings are consistent with those of Levesque et al. (2003) who demonstrated that HPC are mobilized into the peripheral blood between days 2 and 5 for G‐CSF‐ and on day 6 for CY‐ or G‐CSF + CY‐induced mobilization (Levesque et al. 2003).
In our studies, we also examined the morphology of the spleen and liver during G‐CSF + CY‐induced mobilization. In the spleen, induced hyperplasia caused red pulp to dominate over white pulp. The Ki‐67 labelling index indicated that most of the proliferating cells were present in the red pulp of the spleen on day 4 of mobilization. As in the bone marrow, CY also induced subtle fibrosis in the spleen at day 2 of mobilization (Sefc et al. 2003). There was, however, no splenomegaly, which is a characteristic occurrence with mobilization by G‐CSF alone (Pojda et al. 1990; Roberts & Metcalf 1994). On day 6 of G‐CSF + CY‐induced mobilization, the lumina of splenic vessels were filled with numerous leucocytes. Notably, no major histological changes, however, were noticed in the liver of mice mobilized by G‐CSF + CY.
Generally, bone marrow‐derived HSPC mobilized by injury (for example CY administration) circulate in peripheral blood and are able to ‘home’ to organs other than the bone marrow (Ratajczak et al. 2004a). Furthermore, the study of Plett et al. (2003) shows that a considerable numbers of HSC after having been infused into the peripheral blood of mice home to the spleen. Therefore, we looked for the presence of c‐Kit‐R+ and Thy‐1low cells in the spleen and liver of G‐CSF + CY mobilized mice. We noticed that G‐CSF + CY‐induced mobilization resulted in the release of early haematopoietic c‐Kit‐R+ and Thy‐1low cells into the peripheral blood in normal mice, which was most evidently detected on day 4 of mobilization. These cells were subsequently found in the spleens and livers. The mechanism of re‐population of HSC in the spleen seems to be similar to the re‐homing of the cells in the bone marrow after mobilization. The mechanism is based on the change of adhesive molecules (Vermeulen et al. 1998) and the modulation of CXCR4 expression on the HSC surface as well as the chemotactic ability of the cells toward increasing levels of SDF‐1 (Kikuta et al. 2000; Lapidot 2001; Shen et al. 2001).
However, although there were no morphological changes in the murine liver during G‐CSF + CY‐induced mobilization, we noticed a slight activation of lymphoid tissue, including an increase in cellularity within the lumina of lobular vessels. The immunolocalization studies revealed the presence of c‐Kit‐R+ and Thy‐1low cells in areas usually occupied by liver oval (stem) cells (Forbes et al. 2002). Hepatic oval cells are thought to shuttle between the liver and bone marrow (Kollet et al. 2003; Ratajczak 2004a) and express many markers that are found on HSC, e.g. CD34, c‐kit and CXCR4 (Hatch et al. 2002; Fiegel et al. 2003; Grompe 2003) and that are thought to be activated to proliferate during an extensive or chronic liver injury (Grompe 2003; Zhang et al. 2003). We hypothesize that the presence of early stem cells expressing c‐Kit‐R may be a result of the translocation of oval cells from bone marrow into liver damaged by CY. The potential involvement of SDF‐1 induced in the liver by CY in allocation of these cells requires further study.
We conclude that mobilization of mouse HSPC with G‐CSF plus CY induces CY‐dependent transient destructive morphological changes in the bone marrow. These morphological changes were ameliorated by the pro‐regenerative potential of G‐CSF. The egress of haematopoietic cells from the bone marrow was accelerated by day 2 as compared to mobilization by CY alone. Furthermore, inclusion of CY into mobilization protocols on the one hand may efficiently increase the egress of HSPC from the bone marrow, but on the other hand it may allocate bone marrow‐derived stem cells to the peripheral tissues.
REFERENCES
- Bancroft JD, Gamble M (2002) Theory and Practice of Histological Techniques, p. 217 London: Churchill Livingstone. [Google Scholar]
- Barcew K, Kacińska E, Marchlewicz. M, Wiszniewska B, Machaliñski B (2004) Bone marrow morphology during hematopoietic stem cell mobilization with G‐CSF in mice. Folia Morph. 63, 87. [PubMed] [Google Scholar]
- Caporali R, Perotti C, Pedrazozoli P, De Prada GA, Bernuzzi S, Montecucco C (2001) Cyclophosphamide plus granulocyte colony stimulating factor (G‐CSF) is more effective than G‐CSF alone in mobilizing haematopoietic progenitor cells in severe, refractory rheumatoid arthritis. Hematologica 86, 106. [PubMed] [Google Scholar]
- Carion A, Domenech J, Herault O, Benboubker L, Clement N, Bernard MC, Desbois I, Colombat P, Binet C (2002) Decreased stroma adhesion capacity of CD34 progenitor cells from mobilized peripheral blood is not lineage‐ or stage‐specific and is associated with low beta 1 and beta 2 integrin expression. J. Hematother. Stem Cell Res. 11, 491. [DOI] [PubMed] [Google Scholar]
- Castro‐Malaspina H (1984) Pathogenesis of myelofibrosis: role of ineffective megakaryopoiesis and megakaryocyte components. Prog. Clin. Biol. Res. 154, 427. [PubMed] [Google Scholar]
- Chagraoui H, Komura E, Tulliez M, Girauder S, Vainchenker W, Wendling F (2002) Prominent role of TGF‐β1 in thrombopoietin‐induced myelofibrosis in mice. Blood 100, 3495. [DOI] [PubMed] [Google Scholar]
- Chagraoui J, Lepage‐Noll A, Anjo A, Uzan G, Charbord P (2003) Fetal liver stroma consists of cells in epithelial‐to‐mesenchymal transition. Blood 101, 2973. [DOI] [PubMed] [Google Scholar]
- Delgado MB, Clark‐Lewis I, Loetscher P, Langen H, Thelen M, Baggiolini M, Wolf M (2001) Rapid inactivation of stromal cell‐derived factor‐1 by cathepsin G associated with lymphocytes. Eur. J. Immunol. 31, 699. [DOI] [PubMed] [Google Scholar]
- Fiegel HC, Lioznov MV, Cortes‐Dericks L, Lange C, Kluth D, Fehse B, Zander AR (2003) Liver‐specific gene expression in cultured human haematopoietic stem cells. Stem Cells 21, 98. [DOI] [PubMed] [Google Scholar]
- Forbes S, Vig P, Poulsom R, Thomas H, Alison M (2002) Hepatic stem cells. J. Pathol. 197, 510. [DOI] [PubMed] [Google Scholar]
- Grompe M (2003) The role of bone marrow stem cells in liver regeneration. Semin. Liver Dis. 23, 363. [DOI] [PubMed] [Google Scholar]
- Hatch HM, Zheng D, Jorgensen ML, Petersen BE (2002) SDF‐1alpha/CXCR4: a mechanism for hepatic oval cell activation and bone marrow stem cell recruitment to the injured liver of rats. Cloning Stem Cells 4, 339. [DOI] [PubMed] [Google Scholar]
- Janowska‐Wieczorek A, Majka M, Kijowski J, Baj‐Krzyworzeka M, Reca R, Turner AR, Ratajczak J, Emerson SG, Kowalska MA, Ratajczak MZ (2001) Platelet‐derived microparticles bind to haematopoietic stem/progenitor cells and enhance their engraftment. Blood 98, 3143. [DOI] [PubMed] [Google Scholar]
- Karbicka A, Mrchlewicz M, Wiszniewska B, Machalinski B (2003) Bone marrow morphology during haematopoietic stem cell mobilization with cyclophosphamide in mice. Folia Morph. 62, 435. [PubMed] [Google Scholar]
- Kikuta T, Shimazaki C, Ashihara E, Sudo Y, Hirai H, Sumikuma T, Yamagata N, Inaba T, Fujita N, Kina T, Nakagawa M (2000) Mobilization of haematopoietic primitive and committed progenitor cells into blood in mice by anti‐vascular adhesion molecule‐1 antibody alone or in combination with granulocyte colony stimulating factor. Exp. Hematol. 28, 311. [DOI] [PubMed] [Google Scholar]
- Kimura A, Kotoh O, Hyodo H, Kuramoto A (1989) Transforming growth factor‐β regulates growth as well as collagen and fibronectin synthesis of human marrow fibroblasts. Br. J. Haematol. 72, 489. [DOI] [PubMed] [Google Scholar]
- Kollet O, Shivtiel S, Chen YQ, Suriawinata J, Thung SN, Dabeva MD, Kahn J, Spiegel A, Dar A, Samira S, Goichberg P, Kalinkovich A, Arenzana‐Seisdedos F, Nagler A, Hardan I, Revel M, Shafritz DA, Lapidot T (2003) HGF, SDF‐1, and MMP‐9 are involved in stress‐induced human CD34+ stem cell recruitment to the liver. J. Clin. Invest. 112, 160. [DOI] [PMC free article] [PubMed] [Google Scholar]
- Kozuka T, Ikeda K, Teshima T, Kojima K, Matsuo K, Bessho A, Sunami K, Hiramatsu Y, Maeda Y, Noguchi T, Yamamoto K, Fujii N, Imai T, Takenaka K, Shinagawa K, Ishimaru F, Niiya K, Koide N, Tanimoto M, Harada M (2002) Predictive value of circulating immature cell counts in peripheral blood for timing of peripheral blood progenitor cell collection after G‐CSF plus chemotherapy‐induced mobilization. Transfusion 42, 1514. [DOI] [PubMed] [Google Scholar]
- Lapidot T (2001) Mechanism of human stem cell migration and repopulation NOD/SCID and B2mnull NOD/SCID mice. The role of SDF‐1/CXCR4 interactions. Ann. NY Acad. Sci. 983, 83. [DOI] [PubMed] [Google Scholar]
- Lapidot T, Petit I (2002) Current understanding of stem cell mobilization: the roles of chemokines, proteolytic enzymes, adhesion molecules, cytokines, and stromal cells. Exp. Hematol. 30, 973. [DOI] [PubMed] [Google Scholar]
- Le Bousse‐Kerdiles MC, Martyre M (1998) Dual implication of fibrogenic cytokines in the pathogenesis of fibrosis and myeloproliferation in myeloid metaplasia with myelofibrosis. Ann. Hematol. 78, 437. [DOI] [PubMed] [Google Scholar]
- Levesque J‐P, Hendy J, Takamatsu Y, Wiliams B, Winkler IG, Simmons PJ (2002) Mobilization by either cyclophosphamide or granulocyte colony stimulating factor transforms the bone marrow into a highly proteolytic environment. Exp. Hematol. 30, 430. [DOI] [PubMed] [Google Scholar]
- Levesque J‐P, Hendy J, Takamatsu Y, Simmons PJ, Bendall LJ (2003) Disruption of the CXCR4/CXCL12 chemotactic interaction during haematopoietic stem cell mobilization induced by GCSF or cyclophosphamide. J. Clin. Invest. 110, 187. [DOI] [PMC free article] [PubMed] [Google Scholar]
- McQuibban GA, Butker GS, Gong JH, Bendal L, Power C, Clark‐Lewis I, Overall CM (2001) Matrix metalloproteinase activity inactivates the CXC chemokine stromal cell‐derived factor‐1. J. Biol. Chem. 276, 43503. [DOI] [PubMed] [Google Scholar]
- Papayannopoulou T (2004) Current mechanistic scenarios in haematopoietic stem/progenitor cell mobilization. Blood 103, 1580. [DOI] [PubMed] [Google Scholar]
- Petit I, Szyper‐Kravitz M, Nagler A, Lahav M, Peled A, Habler L, Ponomaryow T, Taichman RS, Arenzana‐Scidedos F, Fujii N, Sandbank J, Zipori D, Lapidot T (2002) G‐CSF induces stem cell mobilization by decreasing bone marrow SDF‐1 and upregulating CXCR4. Nature Immunol. 3, 687. [DOI] [PubMed] [Google Scholar]
- Plett PA, Frankovitz SM, Orschell CM (2003) Distribution of marrow repopulating cells between bone marrow and spleen early after transplantation. Blood 102, 2285. [DOI] [PubMed] [Google Scholar]
- Pojda Z, Molineux G, Dexter TM (1990) Hemopoietic effects of short‐term in vivo treatment of mice with various doses of rhG‐CSF. Exp. Hematol. 18, 27. [PubMed] [Google Scholar]
- Ratajczak MZ, Kucia M, Majka M, Reca R, Ratajczak J (2004a) Heterogeneous populations of bone marrow stem cells – are we spotting on the same cells from different angles? Folia Histochem. Cytobiol. 42, 139. [PubMed] [Google Scholar]
- Ratajczak J, Reca R, Kucia M, Majka M, Allendorf DJ, Baran JT, Janowska‐Wieczorek A, Wetsel RA, Ross GD, Ratajczak MZ (2004b) Mobilization studies in mice deficient in either C3 or C3a‐receptor (C3aR) reveal a novel role for complement in retention of haematopoietic stem/progenitor cells in bone marrow. Blood 103, 2071. [DOI] [PubMed] [Google Scholar]
- Reca R, Mastellos D, Majka M, Marquez L, Ratajczak J, Franchini S, Glodek A, Honczarenko M, Spruce LA, Janowska‐Wieczorek A, Lambris JD, Ratajczak MZ (2003) Functional receptor for C3 anaphylatoxin is expressed by normal haematopoietic stem/progenitor cells, and C3a enhances their homing‐related responses to SDF‐1. Blood 101, 3784. [DOI] [PubMed] [Google Scholar]
- Reynolds ES (1963) The use of lead citrate at high pH as an electron‐opaque stain in electron microscopy. J. Cell Biol. 17, 208. [DOI] [PMC free article] [PubMed] [Google Scholar]
- Roberts AW, Metcalf D (1994) Granulocyte colony stimulating factor induces selective elevations of progenitor cells in the peripheral blood of mice. Exp. Hematol. 22, 1156. [PubMed] [Google Scholar]
- Sefc L, Psenak O, Sykora V, Sulc K, Necas E (2003) Response of hematopoiesis to cyclophosphamide follows highly specific patterns in bone marrow in spleen. J. Hematother. Stem Cell Res. 12, 47. [DOI] [PubMed] [Google Scholar]
- Shen H, Cheng T, Olszak I, Garcia‐Zepeda E, Lu Z, Herrmann S, Fallon R, Luster AD, Scadden DT (2001) CXCR‐4 desensitization is associated with tissue localization of hemopoietic progenitor cells. J. Immunol. 166, 5027. [DOI] [PubMed] [Google Scholar]
- Shirota T, Tavassoli M (1991) Cyclophosphamide‐induced alterations of bone marrow endothelium: implications in homing of marrow cells after transplantation. Exp. Hematol. 19, 369. [PubMed] [Google Scholar]
- Shivdasani R (2002) An animal model for myelofibrosis. Blood 100, 1109. [DOI] [PubMed] [Google Scholar]
- Spurr AR (1969) A low‐viscosity epoxy resin embedding medium for electron microscopy. J. Ultrastr 26, 31. [DOI] [PubMed] [Google Scholar]
- Sudhoff T, Sohnen D (2002) Circulating endothelial adhesion molecules (sE‐selectin, sVCAM‐1 and sICAM‐1) during rHuG‐CSF‐stimulated stem cell mobilization. J. Hematother. Stem Cell Res. 11, 147. [DOI] [PubMed] [Google Scholar]
- Thomas J, Liu F, Link DC (2002) Mechanisms of mobilization of haematopoietic progenitors with granulocyte colony stimulating factor. Curr. Opin. Hematol. 9, 183. [DOI] [PubMed] [Google Scholar]
- Vermeulen M, Le Pesteur F, Gagnerault MC, Mary JY, Sainteny F, Lepault F (1998) Role of adhesion molecules in the homing and mobilization of murine haematopoietic stem and progenitor cells. Blood 92, 894. [PubMed] [Google Scholar]
- Yoder MC (2002) Embryonic hematopoiesis in mice and humans. Acta Paediat. Supplement 438, 5. [DOI] [PubMed] [Google Scholar]
- Zhang Y, Bai XF, Huang CX (2003) Hepatic stem cells: existence and origin. World J. Gastroenterol. 9, 201. [DOI] [PMC free article] [PubMed] [Google Scholar]


