

Abstract
Abstract. Objectives: The purpose of this study is to identify active components of PT involved in promoting proliferation of MSCs and to investigate its mechanism. PT was extracted with petroleum ether, ethyl acetate, ethanol and water respectively. Materials and methods: Evidence provided by MTT, HE stain, BrdUrd, PCNA immunoreactivity and cell cycle indicated that Plastrum Testudinis Extracted with ethyl acetate (PTE) is the only active components responsible for increasing MSCs proliferation. Results: This finding leads us to identify the chemical component of PTE. Steroid, fatty acids and their esters components in PTE were determined by GC‐MS and HPLC. The mechanism of PTE action may be associated with the up‐regulation of BMP4. Conclusions: Our findings give novel insights into the promoting effects of Plastrum Testudinis on proliferation of MSCs and help to identify the chemical component and to clarify the mechanism of its pharmacological activities.
INTRODUCTION
Mesenchymal stem cells (MSC) in adult bone marrow are capable of self‐renewal and differentiation into all mesodermal cell types and into neuro‐ectodermal cells, such as osteoblasts, chondrocytes, myoblasts, stromal cells, adipocytes, neurones and astrocytes or more (Prockop 1997; Ferrari et al. 1998; Pennisi 1998; Kopen & Phinney 1999; Orlic D et al. 2001). Their properties make them an excellent seed cell for transplantation, tissue engineering and gene therapy. Cell transplantation is a promising strategy for the treatment of neurotraumatic injuries, strokes, neurodegenerative and muscle‐degenerative diseases. Many kinds of cell, including embryonic stem cells and tissue stem cells, have been considered as candidates for transplantation therapy. MSCs have great potential as therapeutic agents because they are easy to isolate and can be expanded from patients, without involvement in serious ethical or technical problems.
Although MSCs have great potential for use in therapeutic applications, their response to their culture environment and control of their mechanisms over proliferation and differentiation remain unclear. It has been reported that the quantity of MSCs in adult bone marrow is small (Pittenger et al. 1999), thus it is most important to control or regulate the number of MSCs during cell culturing in order to induce them to perform desired functions or to differentiate into specific cell lineages. Current research in this field focuses particularly on the role of growth factors towards MSC proliferation, and fibroblast growth factor (FGF) has been shown to be effective in promoting growth of cell populations in vitro (Van den Bos et al. 1997).
Plastrum testudinis (PT) is an important traditional Chinese medicine often used clinically to treat bone diseases in China, based on its bone‐strengthening pharmacology (The State Pharmacopoeia Commission of the Peoples’ Republic of China 2000). It is an organic component that can be extracted from the carapace and plastron of the turtle Chinemys reevesii (Gray) (Fam. Emydidae), a turtle found in China. Turtles have a unique skeleton; the dorsal surface of the body is covered by the carapace, a fusion of about 50 bones, and on the ventral surface by the nine‐bone plastron. Neither body component has any counterpart among other vertebrate species. It is likely that turtle shell cells may all develop from the same stock of cells, derived from the embryonic neural crest. Signalling cascade proteins such as FGF and bone morphogenetic proteins (BMP) might guide the developmental process (Pennisi 2004). Our previous serum pharmacological studies have shown that PT has a strong effect on enhancing proliferation of MSCs in vitro (Chen et al. 2005), and this report is to further identify active components of PT involved in promoting proliferation of MSCs. PT was extracted from the shell components with petroleum ether, ethyl acetate, ethanol and water. Considering bFGF was the most effective agent in promoting growth of MSCs in vitro, this was used as the positive control through the present study. The possibility of PT increasing MSCs’ proliferation rate in vitro and in vivo has been investigated, evidence provided by tetrazolium (MTT), haematoxylin and eosin (H&E) staining, bromodeoxyuridine (BrdUrd) labelling, proliferating cell nuclear antigen (PCNA) immunoreactivity and cell cycle parameters, indicated that PT ethyl acetate extract (PTE) is the only active fraction in increasing proliferation of MSCs. This finding has led us to identify the chemical components of PTE, and steroids, fatty acids and their ester components were determined by gas chromatography‐mass spectrometry (GC‐MS) and high performance liquid chromatography (HPLC). Mechanism of PTE action may be associated with the up‐regulation of BMP4. Our findings provide novel insights into the promoting effects of PTE on proliferation of MSCs, contribute to identifying its chemical components and to clarifying the mechanism of its pharmacological activity.
MATERIALS AND METHODS
Animals and materials
Sprague–Dawley (SD) rats of 4 weeks of age were obtained from the animal centre of Guangzhou University of Traditional Chinese Medicine. Dulbecco's modified Eagle's medium (DMEM) and foetal bovine serum (FBS) were purchased from Gibco (Grand Island, NY, USA); MTT, BrdUrd, and propidium iodide (PI) were purchased from Sigma (St. Louis, MO, USA); BrdUrd, PCNA, BMP4 antibody, and fluorescein isothiocyanate (FITC)‐labelled monoclonal goat antibodies were provided by Santa Cruz Biotechnologies (Santa Cruz, CA, USA); a commercially available enzyme‐linked immunosorbent assay (ELISA) kit specific for rat BMP4 was purchased from Shanghai Shenergy Biocolor BioScience and Technology Co., Ltd. (Shanghai, China). CD44, probes of BMP4 mRNA, digoxigenin‐labelled probe detection kit, and diaminobenzidine were purchased from Wuhan Boster Biological Technology Co., Ltd. (Wuhan, China); chemicals such as dimethyl sulphoxide (DMSO) and other reagents were also obtained from Sigma.
Preparation of PT extracted with ethyl acetate (PTE)
Plastrum testudinis was purchased from Guangzhou Chinese Medicine Corporation (Guangzhou, China, website: http://www.gzycco.com). First, the PT was ground into a crude powder, then 1000 g of PT powder was put into the Soxhlet extractor and was extracted stepwise with solvent of petroleum ether, ethyl acetate, ethanol and water. Second, solvents were recovered to obtain different extraction fractions: petroleum ether (PTE1, 30 g), ethyl acetate (PTE, 10 g), ethanol (PTE2, 25 g), water (PTE3, 50 g). Hence, extraction efficiencies of PTE1, PTE, PTE2 and PTE3 were 3%, 1%, 2.5% and 5%, respectively. PTE1, PTE and PTE2 were all insoluble in water, thus were dissolved in DMSO. Addition of these solvents at various concentrations did not lead to any alteration in cell growth used in comparison to the non‐treated control group (data not shown). PTE3 samples were dissolved in distilled water.
Identification of chemical constituents of PTE
Gas chromatography‐mass spectrometry (GC‐MS) analysis was performed on a Finnigan Trace gas chromatograph equipped with mass‐selective detector. A DB‐5 MS fused‐silica capillary column (30 m × 0.25 mm × 0.25 µm) was employed for separation. Electron impact mass spectra were recorded at 70 eV. Ultra‐high purity (99.999%) helium was used as the carrier gas at flow rate of 1 ml/min. The injector and detector temperatures were set at 280 °C and injection volume was 10 µl; all injections were performed in a split ratio of 1 : 10. The column temperature was 60 °C for 0 min increasing to 280 °C in increments of 8 °C/min and remaining steady at 280 °C for 20 min. Data analyses were performed and controlled by an Xcalibur software (Xcalibur Software, Inc., Vienna, VA, USA) in a personal computer.
Liquid chromatography analysis with Supelco RP C‐18 (Bellefonte, PA, USA) (15 cm × 4.6 mm) was implemented by Dionex INC Summit 680 HPLC and was detected by Dionex UVD (Sunnyvale, CA, USA). The fatty acid esters were analysed by gradient elution in 210 nm. Acetonitrile and water as the mobile phase (V/V = 80/20 at the 0 min, then gradient change to 100% acetonitrile in 2 min) at the rate of 1.0 ml/min in 15 min, then was changed into 2.0 ml/min. Fatty acids were determined by isocratic elution (acetonitrile/water = 63/37) in 210 nm. Cholesterol myristate was determined by HPLC in 210 nm with silica column as fixed phase (Supelco 250 mm × 4.6 mm) and cyclohexane as mobile phase.
Culture of MSCs
Bone marrow was obtained from the femur and tibia of rat. The marrow samples were diluted with DMEM (LG: low glucose) containing 10% FBS. MSCs were prepared by gradient centrifugation at 900 g for 30 min on Percoll of a density of 1.073 g/ml. The cells were washed, counted and plated at 1 × 10⁶/cm2 on Petri dishes in DMEM‐LG supplemented with 10% FBS. Medium was replaced and the unattached cells were removed every 3 days. MSCs formed as confluent layers were detached by treatment with 0.25% trypsin and passaged into cultural flasks at 1 × 10⁴/cm2. MSCs at passage 3 were evaluated for cultured cell homogeneity using detection of CD44 by flow cytometry and were used for the described experiments. This method has been described previously (Conget & Minguell 1999).
Quantifying cell proliferation by MTT assay
Analysis of MTT was made on passage 3 cultures of MSCs. MSC suspensions (at a cell concentration of 1 × 10⁵/ml) were seeded at 500 cells per well in 96‐well plates and were incubated in 5% CO2, 37 °C for 24 h; then culture medium was replaced. Wells were washed twice with phosphate‐buffered saline (PBS). MSCs were divided into different groups for the dose–response and growth curve experiments in the presence or absence of PTE, respectively. In both experiments, culture with or without serum medium was used for the control group. In the dose–response experiment, sample groups with various PTE concentrations were incubated for 72 h. In the growth curve experiment, sample groups with various PTE concentrations were incubated for indicated intervals. Each sample test was repeated in five independent wells. After incubation, 20 µl MTT (5 mg/ml) was added and the culture was incubated for further 4 h. Culture medium was discarded and was replaced with 150 µl DMSO. Absorbance at 490 nm was measured by a Bio‐Kinetics reader (PE‐1420; Bio‐Kinetics Corporation, Sioux Center, IA, USA).
Effect of PTE on numbers of MSCs
Mesenchymal stem cell suspensions (at cell concentration of 1 × 10⁵/ml) were seeded at 1.2 × 10³ cells per well in 24‐well plates, culture without serum medium was used as the control group, and PTE at 30 µg/ml final concentration, with incubation of 4 consecutive days used for experimental groups. At the indicated time points after PTE treatment (1 day, 2 days, 3 days, 4 days), cells were trypsinized and absolute cell numbers were determined with the using a cell counter.
H&E staining
Cultured MSCs were fixed with 4% paraformaldehyde and then were stained with H&E.
Immunocytochemistry for BrdUrd and PCNA
Sixteen hours before cultured MSCs were fixed, 40 mm of BrdUrd was added into each well of 24‐well plates. Cells were immunostained with rat anti‐BrdUrd or PCNA antibody as primary antibody (1 : 200) overnight, respectively, according to the manufacture's instructions. The control was stained using the identical procedure with non‐immune serum replacing the primary antibody. Brown‐coloured cell nuclei represented positivity, that is, replicating cells. The percentage of positive cells was assessed as percentage of positive cells to total number of cells each field.
Cell cycle analysis
Mesenchymal stem cells’ function was assessed by both in vitro and in vivo experiments. In vitro, MSCs cultured with serum were used as the control group; PTE was added at various final concentrations and the cells were incubated for 1 or 3 days. After culture for different periods of time, cells were harvested from tissue culture flasks by trypsin (0.05%) digestion in PBS. For in vivo evaluation of PTE's effect on promoting cell cycle progression of MSCs, cells were isolated at 1 day after PTE administration with a different dose (3 mg/kg per day and 30 mg/kg per day) for 1 and 3 days. PTE was administered by intraperitoneal injection at indicated time point to SD rats, each group having five SD rats (all experimental procedures were approved by the Care of Experimental Animals Committee of Guangzhou University of Traditional Chinese Medicine). MSCs obtained from bone marrows of femurs and tibias of the above‐treated rats were prepared by gradient centrifugation at 900 g for 30 min on Percoll with a density of 1.073 g/ml.
Obtained cells were incubated for 30 min at room temperature with monoclonal antibody against CD44 (1 : 200), after being washed twice in PBS, cells were reacted in the dark with secondary antibody conjugated with FITC for 15 min. Cells were washed and were re‐suspended in PBS, fixed in 70% ethanol, were washed in PBS, labelled with 50 µg/ml PI and RNase (10 µg/ml) and then were incubated at 37 °C for 45 min. Fluorescence (DNA content) was measured by flow cytometry (Coulter EPICS XL) using standard software, then the PI was calculated with the following formula: PI = (S + G 2/M)/(G 0/G + S + G 2/M) × 100%.
In situ hybridization for BMP4 mRNA
Cultured MSCs were fixed with 4% paraformaldehyde, and underwent pre‐hybridization and hybridization. Briefly, probes for BMP4 mRNA (sequence of the probes for BMP4 mRNA: (i) 5′‐GACTT CGAGG CGACA CTTCT GCAGA TGTTT‐3′; (ii) 5′‐CGAAG AACAT CTGGA GAACA TCCCA GGGAC‐3′; and (iii) 5′‐CACAA TGTGA CACGG TGGGA AACTT TTGAT‐3′) were heated to 95–98 °C for denaturation for 5–10 min, and were then placed into cold water for 5 min. Probes were mixed with hybridization solution, and were then transferred into the sample to allow hybridization at 42 °C overnight. After hybridization, a digoxigenin‐labelled probe detection kit was used and diaminobenzidine staining was used to detect the expression of BMP4 mRNA. Subsequently, haematoxylin was used as a counterstain; the positive signal appeared as deep brown colour within cytoplasm. The control was stained by the same procedure with PBS replacing the probes of BMP4 mRNA.
Quantitative real‐time reverse transcription‐polymerase chain reaction analysis for BMP4 mRNA
RNA was isolated as a standard protocol for quantitative real‐time reverse transcription‐polymerase chain reaction (RT‐PCR) analysis. Cells were synchronized overnight in DMEM without FBS (serum starvation) and then were stimulated with a different dose of PTE, range 0–300 µg/ml. After stimulation (0–5 days), cells were washed with PBS and total cellular RNA was extracted using Trizol reagent (Invitrogen, Carlsbad, CA, USA) according to the manufacturer's recommendation. This method has been described previously (Bustin 2000). Briefly, total RNA was extracted from the cells with Trizol according to the manufacturer's protocol. Five microlitre of the total RNA was reverse‐transcribed into cDNA (RT‐PCR reagent, QIAGEN, Hilden, Germany), and was amplified by fluorescent quantity PCR using the ABI PRISM 7900HT Sequence Detection System (Applied Biosystems, Foster City, CA, USA) with the BMP4 primers: forward primer 5′‐TTACCTCAAGGGAGTGGAAATTG‐3′; reverse primer 5′‐CCATCGTGGCCAAAAGTGA‐3′; TaqMan probe 5′‐FAM‐CCCAACTCCGGC CCCTCCTG‐TAMRA‐3′. The fluorescent quantity PCR condition was a pre‐denaturation at 93 °C for 2 min, then 40–45 cycles of 93 °C for 45 s and 55 °C for 1 min.
Immunofluorescence staining for BMP4
Mesenchymal stem cells were cultured in 24‐well plates on glass cover slips and were treated with PTE at a variety of concentrations (30, 300 µg/ml) for 1 or 3 days. Cell samples were fixed, and then were incubated with the anti‐BMP4 primary antibody (1 : 200) at 37 °C for 30 min, followed by incubation with the secondary antibody conjugated with FITC for 30 min at 37 °C. Subsequently, counterstaining cells with PI (PI is a nucleic acid dye that stains all cell nuclei regardless of the cell cycle stage), PI diluted in methanol at a concentration of 20 mg/ml was added to the wells for 5 min at 37 °C. The control was stained in the identical procedure, with non‐immune serum replacing the primary antibody. Samples were embedded into mounting medium and were observed by fluorescence microscopy. BMP4‐positive cell cytoplasm was stained green and nuclei labelled with PI (total cell population) were red. Percentage of BMP4‐positive cells was assessed as percentage of positive cells to total cells in fields counted.
ELISA for BMP4
Cultured MSCs were collected and washed with PBS, lysed and were centrifuged at 10 000 g for 20 min at 4 °C, then the supernatant was collected. ELISA for BMP4 in the supernatant was performed using a commercially available kit specific for rat BMP4, according to the manufacturer's instructions.
Data analysis
All data results were expressed as mean ± standard deviation (SD). One‐way analysis of variance was carried out using SPSS version 10.0 for windows software (Chicago, IL, USA). Effects were considered to be significant at P values less than 0.05.
RESULTS
Effect of different doses of PTE on MSC proliferation
To investigate which fraction of the various extracts from PT has the promoting effect on MSC proliferation, all extracts were subject to dose–response experiments. Addition of PTE (Fig. 1a and b) could increase MSCs in a dose‐dependent manner, regardless of the presence or absence of 10% FBS. This increase was only observed in PTE, and it was independent of serum presence. The other extracts showed no effect on MSC proliferation. The effective dose of PTE is between 0.01 and 3 mg/ml, bFGF also showed an effect on promoting MSC's growth in vitro. PTE at the concentration of 0.01 mg/ml was as effective as bFGF in promoting MSC proliferation but 10% FBS had no influence on PTE function. The above observation demonstrated that PTE has the effect of promoting proliferation of rat MSCs in a dose‐dependent manner, thus we concentrated on further confirmation of its effects on MSC proliferation in vitro and in vivo.
Figure 1.
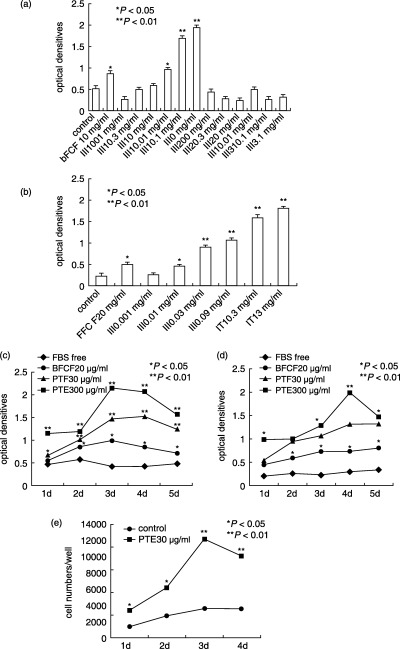
Effect of different doses of PTE on MSC proliferation. Dose‐dependent stimulation of optical densities of MSCs cultured by different extracts with 10% FBS (a), by PTE without 10% FBS (b) and growth curves of MSCs expanded by PTE with 10% FBS (c) or without FBS (d). Reported values are the optical densities obtained by the MTT procedure. Data represent the mean ± SD of values of two independent experiments in duplicate. *P < 0.05; **P < 0.01 compared to control. (e) Effect of PTE on cell numbers of MSCs. The third passage MSCs were plated in each well of a 24‐well plate, cell number was then evaluated at different times with the aid of a cell counter. A strong increase in the number of cells of PTE‐treated groups in comparison to control groups was observed at all examined time points.
Growth curves of PTE‐treating MSCs, which were cultured both with and without 10% FBS, were constructed (Fig. 1c and d). PTE dramatically increased MSC's growth rate. During the presence of 10% FBS in the culture medium, MSC proliferation was enhanced by PTE for up to 3 days (Fig. 1c; P < 0.01, compared to control). bFGF‐treated cell proliferation was significantly enhanced. In contrast, during the absence of 10% FBS in culture medium, the PTE increased MSC proliferation significantly from day 1 to day 3, compared to control values. The rate of increase reached a plateau from 4 days (Fig. 1d). Both PTE and bFGF treatment resulted in MSC proliferation promoting activity within the first 3 days. Thus, we determined to use the first 3 days as the time to provide as proliferation study results.
Cell numbers in PTE groups increased continuously from day 1 to day 4. A considerable increase in cell numbers was seen in treated groups compared to control groups at all examined time points (Fig. 1e).
Effect of PTE on morphology of MSCs
Morphological differences were evident in the third MSC cultures between control cells and MSCs treated with PTE (Fig. 2). The original fibroblast‐like phenotype of the MSCs was gradually lost in the control group and changed into a more flattened cell phenotype (Fig. 2a), whereas it maintained as previous when PTE was present in the culture medium (Fig. 2b). H&E staining clearly showed that in control groups, the round or round‐to‐flat‐like nuclei of MSCs were large, nucleoli were predominant and the ratio of nucleus to cytoplasm was high (Fig. 2c). Generally, MSCs exhibited characteristics of primitive, non‐differentiated phenotype. Meanwhile, PTE‐treated cells appeared as dividing cells with double nuclei (Fig. 2d). This has suggested the effect of PTE on promoting proliferation of MSCs.
Figure 2.
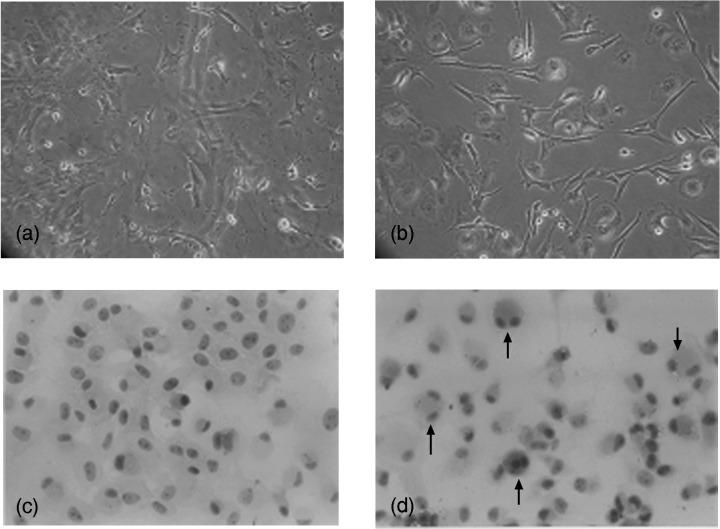
Comparative morphology of the third passage MSCs cultured either with or without PTE. (a) Control MSCs in 10% FBS progressively assumed a larger, more flattened phenotype. (b) MSCs cultured with PTE (30 µg/ml) in the presence of fibroblastic phenotype. (c) H&E stain of control cultures of MSCs. (d) H&E stain of MSCs with PTE (arrow, dividing cell with double nucleus, original magnification ×200).
Effect of PTE on BrdUrd and PCNA‐labelled cell numbers of MSCs
BrdUrd‐positive cell nuclei were diffuse across the culture plate and labelled cell density was relatively uniform among the other condition cells (Fig. 3). Control cells had very faint BrdUrd immunoreactivity, indicating low cell proliferation in the control cells. Control samples stained without primary antibody or non‐immune serum revealed no immunoreactivity for BrdUrd. Meanwhile, BrdUrd incorporation was widely observed in nuclei of PTE‐treated cells. Control cells also had sparse expression of PCNA, whereas PTE‐treated cells expressed abundant PCNA final reaction product. The PCNA protein is synthesized during late G1 to S phase and PCNA augmentation indicates progression of a cell through the replicative pathway (Woods et al. 1991). Consequently, PTE appeared capable of promoting proliferation of MSCs.
Figure 3.
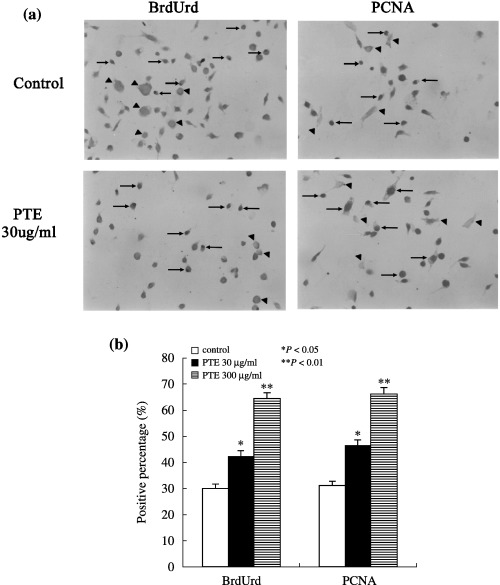
Effect of PTE on BrdUrd and PCNA‐positive cell numbers of MSCs. (a) BrdUrd and PCNA immunocytochemistry (arrow, position where brown final reaction product, expression in positively stained cell nuclei; arrow head, position where brown final reaction product was not expressed in negative cell nuclei, original magnification ×200). (b) Comparison of percentages of BrdUrd and PCNA‐positive cells among experimental groups after PTE treatment for 3 days. *P < 0.05; **P < 0.01 compared to control.
Effect of PTE on the cell cycle of MSCs in vitro and in vivo
PTE treatment for 1 day did not demonstrate any significant effect of PI in MSCs treated with a low dose of PTE (30 µg/ml), in contrast, when MSCs were incubated with a high dose of PTE (300 µg/ml), it strongly increased PI of MSCs. After PTE treatment for 3 days, PI levels in PTE‐treated MSCs were remarkably higher than those of control cells at the same time point, in dose‐ and temporal‐dependent manner, and bFGF‐treated cells also showed a similar profile. Moreover, PI levels of day 3 with PTE exposure were higher than those at day 1. Values between the two time points were statistically significant (Fig. 4a).
Figure 4.
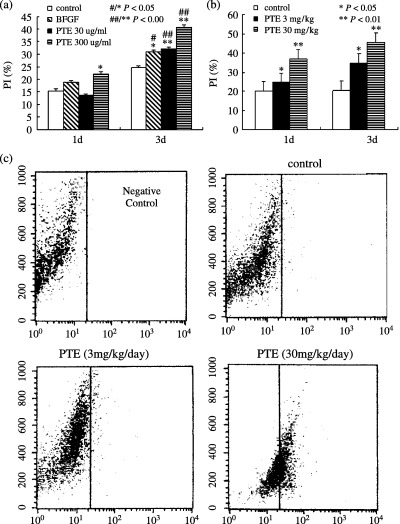
Effect of PTE on the cell cycle of MSCs in vitro and in vivo. (a) Representative cell cycle analysis for PI of MSCs cultured treatment with a different dose of PTE (30 µg/ml, 300 µg/ml) for 1 day and 3 days. PI levels of MSCs cultured increased with increasing dose and time of PTE. (b) Representative cell cycle analysis for PI of MSCs isolated from rats that were administered with different dose of PTE (3 mg/kg/day, 30 mg/kg/day) for 1 and 3 days in vivo. The PT levels of MSCs cultured increased with increasing dose and time of PTE. PTE strongly promoted increasing of PI of MSCs in vivo in time‐ and dose‐dependent manner. *P < 0.05; **P < 0.01 compared to control at the same time point. ***P < 0.05; ****P < 0.01 PI levels from 3 days MSCs cultured with and without PTE were compared to those from 1 day MSCs cultured with or without PTE. (c) Detection of CD44 expression by flow cytometry. MSCs isolated from rats that were administered with and without PTE for 3 days in vivo were analysed for expression of CD44 by flow cytometry, negative control represent MSCs incubated with FITC‐conjugated antibody alone. Vertical lines represent maximum fluorescence intensity for FITC‐conjugated antibody. CD44 expression of MSCs isolated from rats that were administered with PTE increased in dose‐dependent manner.
The effect of PTE on the cycle of MSCs isolated in vivo at 1 day after PTE and administered with a different dose for 1 day and 3 days, respectively, are described below. After PTE administration for 1 day, MSC treatment of high dose of PTE resulted in increasing PI significantly when compared to control values; however, when MSCs were treated with a low dose of PTE, significant PI level alteration was not observed. After PTE treatment for 3 days, however, MSCs treated with low dose of PTE exhibited values remarkably higher in PI than that of controls, suggesting that increasing PI of MSCs treated with low dose of PTE was in a time‐dependent manner, MSCs treated with high dose of PTE also resulted in increasing PI of MSCs in vivo. Our methods indicate that cells labelled with CD44 prior to cell cycle analysis, CD44‐positive cells had been sorted/gated specifically for this analysis, the number of CD44‐positive cells in rat administered without PTE was very small, however, the number of CD44‐positive cells in rat administered with PTE was increased in dose‐dependent manner (Fig. 4c), it was indicated that PTE treatments induced significant proliferation of MSCs.
Effect of PTE on the BMP4 mRNA expression of MSCs
PTE stimulation of cultured MSCs increases BMP4 mRNA expression in a time‐ and dose‐dependent manner. In a series of experiments paralleling those described above, the time and dose effect of PTE stimulation on BMP4 mRNA expression in proliferation of MSCs were studied in vitro. To examine effects of PTE stimulation on BMP4 mRNA expression over time, MSCs at passage 3 were stimulated with a single dose of PTE (30, 300 µg/ml culture media) for 0, 1, 3 and 5 days. Cellular RNA was examined for BMP4 mRNA by quantitative real‐time RT‐PCR (Fig. 5a–c). It was demonstrated that BMP4 mRNA expression increased with elapsed time after PTE stimulation.
Figure 5.
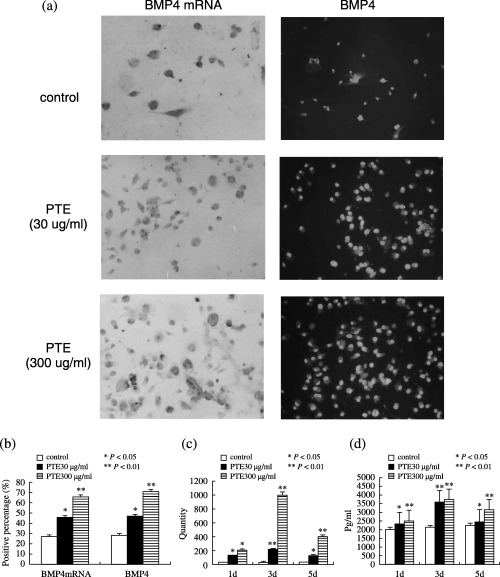
Effect of PTE on the BMP4 mRNA and BMP4 expression of MSCs in vitro. (a) Photomicrograph showing positive signal of hybridization is shown as deep brown colour within the cytoplasm in situ hybridization for BMP4 mRNA (arrow, the position where brown colour was expressed at cell cytoplasm was positive, and with haematoxylin counter stain, original magnification ×200) and BMP4‐positive cell cytoplasm were in green (white arrow, the position where green colour was expressed at cell cytoplasm was positive, the position where green colour was not expressed at cell cytoplasm was negative, and with PI counter stain, original magnification ×200), MSCs in control group showed a little BMP4 mRNA and BMP4‐positive staining, PTE treated MSCs show more strong BMP4 mRNA and BMP4‐positive staining. (b) Comparison of the percentages of BMP4 mRNA and BMP4‐positive cell among the four experimental groups after PTE treatment of 3 days. (c) Representative real‐time reverse transcription‐polymerase chain reaction demonstrating an increase in BMP4 mRNA isolated from MSC in response to a different dose of PTE (30 and 300 µg/ml culture media) for 1, 3 and 5 days. (d) Representative ELISA for BMP4 of MSCs cultured increased with increasing time and dose of PTE. *P < 0.05; **P < 0.01 compared to control.
To evaluate the effect of PTE dose on BMP4 mRNA expression, the third passage MSCs were stimulated with different doses of PTE (0, 30 and 300 µg/ml culture media); 3 days later, cellular RNA was examined for BMP4 mRNA by in situ hybridization and quantitative real‐time RT‐PCR (Fig. 5a–c). Both analyses demonstrated an increase in BMP4 mRNA expression with increasing PTE concentrations (Fig. 5c), resulting in an 8.7 ± 0.5‐fold increase in BMP4 mRNA over baseline (P < 0.01).
Effect of PTE on BMP4 expression in MSCs
PTE stimulation of cultured MSCs increased BMP4 expression in a time‐ and dose‐dependent manner (Fig. 5). BMP4‐positive cell cytoplasm was labelled green and positive cells were diffuse across the culture plate; intensity of reaction was relatively uniform among the different cells. Control cells showed very faint BMP4 immunoreactivity and sparse expression of BMP4‐positive cells, suggesting low cell expression of BMP4 in the controls. The staining control (without primary antibody or using non‐immune serum) revealed no immunoreactivity for BMP4, while PTE‐treated cells showed strong BMP4 immunoreactivity and abundant BMP4‐positive cells. An increase of BMP4 was observed after treatment with PTE (Fig. 5a–b). PTE did not alter the distribution of BMP4 around the cytoplasm, but changes in nuclear morphology were seen. Thus, PTE appeared capable of inducing up‐regulation of BMP4 during cell proliferation.
Effects of PTE on levels of BMP4 of MSCs in vitro
To examine whether treatment PTE increased levels of BMP4 in MSCs in vitro ELISAs were performed for endogenous BMP4 in vitro. ELISA measurements revealed that treatment with PTE significantly (P < 0.05) increased BMP4 levels. It was suggested that BMP4 might be involved in mediating the effects of PTE on proliferation of MSCs (Fig. 5d).
Analysis of chemical components in PTE
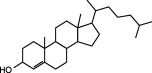
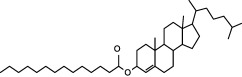
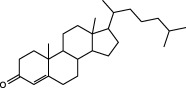
In order to investigate the chemical components in PTE, we compared and analysed the chromatographic peaks and spectral information provided by GC‐MS. The result showed that there are fatty acid esters, cholesterol and cholesterol myristate fatty acids in PTE. In accordance with GC‐MS analysis, we purchased standard materials: palmitic methyl ester, palmitic acid, palmitic ethyl ester, stearic methyl ester, stearic acid, stearic ethyl ester and cholesterol, cholesterol myristate and cholestenone from Tokyo Chemical Industry Co., Ltd. (TCI; Tokyo, Japan) to investigate these substances in PTE by HPLC. In the HPLC system, it was found that some peaks in standard materials can be identified in PTE. Results showed that this extract contained nine compounds including four esters, two carboxylic acids, three steroids (Table 1).
Table 1.
Chemical component in PTE
| Types | Name | Structure | |
|---|---|---|---|
| Fatty acids | Palmitic Acid |
|
|
| Stearic Acid |
|
||
| Fatty acid esters | Palmitic Acid Methyl Ester |
|
|
| Ethyl Palmitate |
|
||
| Methyl Stearate |
|
||
| Stearic Acid Ethyl Ester |
|
||
| Steroid | Cholesterol |
|
|
| Cholesterol Myristate |
|
||
| (+)4‐cholesten‐3‐one |
|
DISCUSSION
Evidence provided by MTT, H&E staining, BrdUrd and PCNA immunoreactivity, and cell cycle parameters indicated that PTE is the only active fraction of PT involved in promoting proliferation MSCs. MTT data suggested that PTE is the most active component increasing in optical density values of MSCs; bFGF is also the active in this assay; these results were similar to those from other authors (Tsutsumi et al. 2001; Takagi et al. 2003). The apparent absence of effect of other PTEs tested may be explained by presence in the serum using the same PTE in already maximally stimulatory concentrations. Being active in promoting MSCs growth, PTE has been the only PTE selected for further studies. We noted that the addition of PTE to the MSCs culture medium in the presence and absence of serum yield a reproducible and constant level of cell proliferation. MSC cultures treated with PTE yielded higher amounts of BrdUrd, and PCNA‐positive cell and S‐phase cell percentages in the cell cycle as compared to control cultures. Together with fluorescence‐activated cell sorting findings, PTE‐treated and bFGF‐treated cells exhibited very similar cell cycle kinetics at 1 day and 3 days compared to the cells in the serum‐free medium with respect to cell cycle progression and cell proliferation. The present PTE‐treated MSCs showed marked nuclear changes as seen by H&E staining at day 3 compared to control cells. Furthermore, pure MSC characteristics in the early growing phase were elucidated, and PTE was verified to activate proliferation in the serum‐deprived medium. It is very important for a cell culture processes aimed at clinical transplantation, that FBS must be completely removed from the medium used, as calf serum is not only animal‐derived but also may be contaminated with agents causing diseases. In addition, cells were cultured in the presence of FBS from highly selected lots, making it necessary to perform laborious serum testing before its use. It would be interesting to speculate that, in our system, PTE can be used to maintain bone marrow cells in a stem cell state. Further studies in vivo are in progress to understand whether in the presence of PTE certain MSCs are stimulated to proliferate. Cell cycle analysis showed that PTE increased the percentage of CD44 cells in S‐phase. So, it is suggested that PTE can promote proliferation of MSCs in vivo. Results in vivo were consistent with those determined in vitro.
However, the mechanism by which PTE promotes the proliferation of MSCs is unknown. This may be explained either by a direct effect of PTE on proliferation of these cells, or by PTE stimulation of the synthesis and/or organization of cellular components, which would induce an alteration in the cell growth factor levels. BMPs are multifunctional growth factors that belong to the transforming growth factor beta superfamily (Hogan 1996). They were originally identified by their capacity to induce bone and cartilage formation and regeneration. They regulate a myriad of cellular processes such as differentiation, proliferation, apoptosis, adhesion and migration, based on response to BMP concentration gradient. At low concentrations, they promote cell proliferation, whereas at higher concentrations they favour cellular differentiation and bone formation (Urist 1997). BMPs cannot only promote osteogenic differentiation of MSCs (in a variety of animals) but also have been reported to be essential for this process. In addition, they have been reported to directly regulate proliferation of human MSCs (Akino et al. 2003) and to be critical in controlling cell proliferation by regulating certain gene expression (Ogata et al. 1993). MSCs can respond to stimulation by different kinds of BMP (Diefenderfer et al. 2003), thus we have hypothesized that the proliferation induced by PTE may be mediated by alterations in expression of BMP4 with its known roles in the regulation of cell proliferation.
In order to confirm this hypothesis, we tested the expression of BMP4 using in situ hybridization, quantitative real‐time RT‐PCR analysis, immunofluorescence staining and ELISAs during MSC proliferation induced by PTE. Interestingly, PTE expanded MSCs expression of high levels of BMP4 activity and displayed a higher proliferative potential in vitro. By in situ hybridization, we observed that MSCs containing BMP4 mRNA seemed to play a direct role in the functioning of these cells. In MSCs, BMP4 mRNA was highly expressed during the early stages of cell proliferation, and BMP4 protein levels also increased during the same stages. This observation may provide a proliferative window during which PTE's effect on MSCs may be particularly pronounced. These results confirmed our hypothesis that effect of PTE on proliferation may be related to up‐regulation of BMP4.
The effect of PTE on proliferation of MSCs may be mediated by their chemical constituents. Evidence provided by GS‐MS and HPLC indicated that PTE consists of steroid, fatty acid and fatty acid esters; these are important constituents in a variety of pharmaceutically important compound classes for their regulating effects on cell proliferation. Our result is similar to osteo‐differentiation elicited by dexamethasone that has also induced mild cell proliferation, which did not occur in control MSCs. Dexamethasone modulates proliferation of MSCs (Cornet et al. 2004; Li et al. 2005), several authors have emphasize its proliferative effects in bone precursor cells such as osteoblasts (Atmani et al. 2003; Yang et al. 2003), but high concentrations of dexamethasone are inhibitory to bone marrow cell proliferation in vitro (Walsh et al. 2001). In chemical structure, PTE and dexamethasone possess a similar steroid structure, but the precise steroid components of PET are different from those of dexamethasone. Second, fatty acids play a crucial role in regulating cell proliferation. Fatty acid synthase is necessary for cell proliferation (Almeida et al. 2005); however, some proliferation‐related genes are affected by fatty acids (Bousserouel et al. 2004; Rocchi et al. 2005), and provide a variety of effects on proliferation in various cells. It has been demonstrated that fatty acids promote growth and survival in erythroid progenitor cells and in lymphocyte proliferation (Castaneda et al. 2005; Nugent et al. 2005); these findings were in accordance with the results of our study. In contrast, results of a number of other authors have indicated that fatty acids have inhibitory effects on tumour cell behaviour, lymphocytes and smooth muscle cells (Abeywardena & Head 2001; Cavaglieri et al. 2003; Nano et al. 2003; Roynette et al. 2004). Finally, there is a common link between steroids and fatty acids that have similar actions, interaction with each other and benefits in cell proliferation (Das 2002). MSC proliferation is controlled by both intrinsic regulators and the extracellular environment and is typically controlled ex vivo by cell culture manipulation with appropriate cocktails of growth factors, signalling molecules and/or by genetic manipulation (Long et al. 2001), and ratio of BMP‐2 and bFGF are known to stimulate MSC proliferation synergistically in rats (Hanada et al. 1997). Interaction among the multi‐components of PTE may be also pre‐disposed to cell proliferation.
In this study, it was found that ranges of effective doses of PTE were large. This may be due to three factors. First, doses of PT are high when clinically treating bone diseases in China. In traditional Chinese medicines, bone disease is thought to be a consequence of imbalances in the body, and it is often considered necessary to incorporate multiple components into a therapeutic approach to restore bone balance. PT is a typical example of such a combination based on its bone‐strengthening pharmacological properties. Because combinations of PT with quite different components of apparently similar function are often used in traditional Chinese medicines, doses of PT are typically high. Second, PTE contains multiple components and the results described here demonstrate that PTE is thought to be the primary active constituent of PT; along with this it may contain non‐effective components. However, large doses of PTE may be sufficient to induce proliferation of MSCs. Third, PT is safe and traditionally is used to strengthen bones and nourish the body.
Recognition of the proliferation potential of MSCs by PTE has opened the door to at least three classes of clinical application. First, PTE is easy to obtain as the active ingredient, thus it can be applied to promote MSC population growth. The most readily implemented use of the proliferative potential of MSCs treated with PTE involves reconstructing localized skeletal defects. Second, up‐regulation of BMP4 of MSCs by PTE may provide a new concept for the treatment of bone diseases, for controlling fracture repair and osteoporosis, and in particular, may be used in gene therapeutic protocols, because as yet MSCs can not be transduced with high enough efficiency to generate a therapeutically required number of engineered cells. Furthermore, proper regulation of expression of a desired gene in these cells appears to be problematic. Finally, the most ambitious use for these cells treated with PTE would be to reconstitute some or all of the skeletal system to treat systemic diseases of bone.
Our future work will focus on culturing MSC populations committed to multiple differentiation lineages with PTE, when provided with the appropriate inductive agents. Currently, bone marrow represents the main source of MSCs for both experimental and clinical studies (Deans & Moseley 2000). MSCs are generally considered a highly promising cell source for tissue engineering application because of their multi‐differentiation capabilities and their expandability. Structural and functional tissue engineering requires that cells be seeded within biomaterial scaffolds that permit specific cellular differentiation and expression of specific cellular phenotypes. Therefore, it will be important that future experiments will examine the possible role of PTE in mediating differentiation of MSCs in vitro and in vivo.
ACKNOWLEDGEMENTS
The project was supported by National Natural Science Foundation of China, Grant nos. 30371837, 30472272, 20671036 and 20471020.
REFERENCES
- Abeywardena MY, Head RJ (2001) Long chain n‐3 polyunsaturated fatty acids and blood vessel function. Cardiovasc. Res. 52, 361–371. [DOI] [PubMed] [Google Scholar]
- Akino K, Mineta T, Fukui M, Fujii T, Akita S (2003) Bone morphogenetic protein‐2 regulates proliferation of human mesenchymal stem cells. Wound Repair Regen. 11, 354–360. [DOI] [PubMed] [Google Scholar]
- Almeida JP, Coletta RD, Silva SD, Agostini M, Vargas PA, Bozzo L, Graner E (2005) Proliferation of fibroblasts cultured from normal gingiva and hereditary gingival fibromatosis is dependent on fatty acid synthase activity. J. Periodontol. 76, 272–278. [DOI] [PubMed] [Google Scholar]
- Atmani H, Chappar D, Basle MF (2003) Proliferation and differentiation of osteoblasts and adipocytes in rat bone marrow stromal cell culture: effects of dexamethasone and calcitriol. J. Cell. Biochem. 89, 364–372. [DOI] [PubMed] [Google Scholar]
- Bousserouel S, Raymondjean M, Brouillet A, Bereziat G, Andreani M (2004) Modulation of cyclin D1 and early growth response factor‐1 gene expression in interleukin‐1β‐treated rat smooth muscle cells by n‐6 and n‐3 polyunsaturated fatty acids. Eur. J. Biochem. 271, 4462–4473. [DOI] [PubMed] [Google Scholar]
- Bustin SA (2000) Absolute quantification of mRNA using real‐time reverse transcription polymerase chain reaction assays. J. Mol. Endocrinol. 25, 169–193. [DOI] [PubMed] [Google Scholar]
- Castaneda S, Boosalis MS, Emery D, Thies A, Faller DV, Perrine SP (2005) Enhancement of growth and survival and alterations in Bcl‐family proteins in β‐thalassemic erythroid progenitors by novel short‐chain fatty acid derivatives. Blood Cells Mol. Dis. 35, 217–226. [DOI] [PMC free article] [PubMed] [Google Scholar]
- Cavaglieri CR, Nishiyama A, Fernandes LC, Curi R, Miles EA, Calder PC (2003) Differential effects of short‐chain fatty acids on proliferation and production of pro‐ and anti‐inflammatory cytokines by cultured lymphocytes. Life Sci. 73, 1683–1690. [DOI] [PubMed] [Google Scholar]
- Chen DF, Zhou JH, Du Li HSH, Li YW, Deng YD, Zhang SX (2005) Effects of seropharmacological traditional Chinese drug on proliferation of rat mesenchymal stem cell in vitro . FEBS 272 (Suppl. 1), 141. [Google Scholar]
- Conget PA, Minguell JJ (1999) Phenotypical and functional properties of human bone marrow mesenchymal progenitor cell. J. Cell Physiol. 181, 67–73. [DOI] [PubMed] [Google Scholar]
- Cornet F, Broux O, Anselme K, Hardouin P, Jeanfils J (2004) Effect of dexamethasone on moesin gene expression in rabbit bone marrow stromal cells. Mol. Cell. Biochem. 265, 79–83. [DOI] [PubMed] [Google Scholar]
- Das UN (2002) Estrogen, statins, and polyunsaturated fatty acids: similarities in their actions and benefits – is there a common link. Nutrition 18, 178–188. [DOI] [PubMed] [Google Scholar]
- Deans RJ, Moseley AB (2000) Mesenchymal stem cell: biology and potential clinical uses. Exp. Hematol. 28, 875–884. [DOI] [PubMed] [Google Scholar]
- Diefenderfer DL, Osylzka AM, Reilly GC, Leboy PS (2003) BMP responsiveness in human mesenchymal stem cells. Connect. Tissue Res. 44 (Suppl. 1), 305–311. [PubMed] [Google Scholar]
- Ferrari G, Cusella‐De Angelis G, Coletta M, Paolucci E, Stornaiuolo A, Cossu G, Mavilio F (1998) Muscle regeneration by bone marrow‐derived myogenic progenitors. Science 279, 1528–1530. [DOI] [PubMed] [Google Scholar]
- Hanada K, Dennis JE, Caplan AI (1997) Stimulatory effects of basic fibroblast growth factor and bone morphogenetic protein‐2 on osteogenic differentiation of rat bone marrow‐derived mesenchymal stem cells. J. Bone Miner Res. 12, 1606–1614. [DOI] [PubMed] [Google Scholar]
- Hogan BL (1996) Bone morphogenetic proteins: multifunctional regulators of vertebrate development. Genes Dev. 10, 1580–1594. [DOI] [PubMed] [Google Scholar]
- Kopen. Gc Prockop DJ, Phinney DG (1999) Marrow stromal cells migrate throughout forebrain and cerebellum, and they differentiate into astrocytes after injection into neonatal mouse brains. Proc. Natl. Acad. Sci. USA 96, 10 711–10 716. [DOI] [PMC free article] [PubMed] [Google Scholar]
- Li X, Jin L, Cui Q, Wang GJ, Balian G (2005) Steroid effects on osteogenesis through mesenchymal cell gene expression. Osteoporos Int. 16, 101–108. [DOI] [PubMed] [Google Scholar]
- Long F, Zhang XM, Karp S, Yang Y, Mcmahon AP (2001) Genetic manipulation of hedgehog signaling in the endochondral skeleton reveals a direct role in the regulation of chondrocyte proliferation. Development 128, 5099–5108. [DOI] [PubMed] [Google Scholar]
- Nano JL, Nobili C, Girard‐Pipau F, Rampal P (2003) Effects of fatty acids on the growth of Caco‐2 cells. Prostaglandins Leukot. Essent. Fatty Acids 69, 207–215. [DOI] [PubMed] [Google Scholar]
- Nugent AP, Roche HM, Noone EJ, Long A, Kelleher DK, Gibney MJ (2005) The effects of conjugated linoleic acid supplementation on immune function in healthy volunteers. Eur. J. Clin. Nutr. 59, 742–750. [DOI] [PubMed] [Google Scholar]
- Ogata T, Wozney JM, Benezra R, Noda M (1993) Bone morphogenetic protein 2 transiently enhances expression of a gene, Id (inhibitor of differentiation or inhibitor of DNA binding), encoding a helix‐loop‐helix molecule in osteoblast‐like cells. Proc. Natl. Acad. Sci. USA 90, 19–22. [DOI] [PMC free article] [PubMed] [Google Scholar]
- Orlic D, Kajstura J, Chimenti S, Jakoniuk I, Anderson SM, Li BS, Pickel J, Mckay R, Nadal‐Ginard B, Bodine DM, Leri A, Anversa P (2001) Bone marrow cells regenerate infarcted myocardium. Nature 410, 701–705. [DOI] [PubMed] [Google Scholar]
- Pennisi E (1998) Bone marrow may provide muscle power. Science 279, 72–77. [DOI] [PubMed] [Google Scholar]
- Pennisi E (2004) Neural beginnings for the turtle's shell. Science 303, 951. [DOI] [PubMed] [Google Scholar]
- Pittenger MF, Mackay AM, Beck SC, Jaiswal RK, Douglas R, Mosca JD, Moorman MA, Simonetti DW, Craig S, Marshak DR (1999) Multilineage potential of adult human mesenchymal stem cells. Science 284, 143–147. [DOI] [PubMed] [Google Scholar]
- Prockop DJ (1997) Marrow stromal cells as stem cells for nonhematopoietic tissues. Science 276, 71–74. [DOI] [PubMed] [Google Scholar]
- Rocchi P, Tonelli R, Camerin C, Purgato S, Fronza R, Bianucci F, Guerra F, Pession A, Ferreri AM (2005) Waf1/Cip1 is a common target induced by short‐chain fatty acid HDAC inhibitors (valproic acid, tributyrin and sodium butyrate) in neuroblastoma cells. Oncol. Rep. 13, 1139–1144. [PubMed] [Google Scholar]
- Roynette CE, Calder PC, Dupertuis YM, Pichard C (2004) n‐3 Polyunsaturated fatty acids and colon cancer prevention. Clin. Nutrition 23, 139–151. [DOI] [PubMed] [Google Scholar]
- State Pharmacopoeia Commission of the People's Republic of China (2000) Carapax et plastrum testudinis. Pharmacopoeia People's Republic China. English edn. 1, 15–16. [Google Scholar]
- Takagi M, Nakamura T, Matsuda C, Hattori T, Wakitani S, Yoshida T (2003) In vitro proliferation of human bone marrow mesenchymal stem cells employing donor serum and basic fibroblast growth factor. Cytotechnology 43, 89–96. [DOI] [PMC free article] [PubMed] [Google Scholar]
- Tsutsumi S, Shimazu A, Miyazaki K, Pan H, Koike C, Yoshida E, Takagishi K, Kato Y (2001) Retention of multilineage differentiation potential of mesenchymal cells during proliferation in response to FGF. Biochem. Biophys. Res. Commun. 288, 413–419. [DOI] [PubMed] [Google Scholar]
- Urist MR (1997) Bone morphogenetic protein: the molecularization of skeletal system development. J. Bone Miner. Res. 12, 343–346. [DOI] [PubMed] [Google Scholar]
- Van den Bos C, Mosca JD, Winkles J, Kerrigan L, Burgess WH, Marshak DR (1997) Human mesenchymal stem cells respond to fibroblast growth factors. Hum. Cell 10, 45–50. [PubMed] [Google Scholar]
- Walsh S, Jordan GR, Jefferiss C, Stewart K, Beresford JN (2001) High concentrations of dexamethasone suppress the proliferation but not the differentiation or further maturation of human osteoblast precursors in vitro: relevance to glucocorticoid‐induced osteoporosis. Rheumatology (Oxford) 40, 74–83. [DOI] [PubMed] [Google Scholar]
- Woods AL, Hall PA, Shepherd NA, Hanby AM, Waseem NH, Lane DP, Levison DA (1991) The assessment of proliferating cell nuclear antigen (PCNA) immunostaining in primary gastrointestinal lymphomas and its relationship to histological grade, S + G2 + M phase fraction (flow cytometric analysis) and prognosis. Histopathology 19, 21–27. [DOI] [PubMed] [Google Scholar]
- Yang L, Tao T, Du Wang XN, Chen W, Tao S, Wang Z, Wu L (2003) Effects of dexamethasone on proliferation, differentiation and apoptosis of adult human osteoblasts in vitro . Chin. Med. J. (Engl.) 116, 1357–1360. [PubMed] [Google Scholar]