

Abstract
Objective
Chromatin texture patterns of tumour cell nuclei can serve as cancer biomarkers, either to define diagnostic classifications or to obtain relevant prognostic information, in a large number of human tumours. Epigenetic mechanisms, mainly DNA methylation and histone post‐translational modification, have been shown to influence chromatin packing states, and therefore nuclear texture. The aim of this study was to analyse effects of these two mechanisms on chromatin texture, and also on correlation with gelatinase expression, in human fibrosarcoma tumour cells.
Materials and methods
We investigated effects of DNA hypomethylating agent 5‐aza‐2′‐deoxycytidine (5‐azadC) and histone deacetylase inhibitor trichostatin A (TSA) on nuclear textural characteristics of human HT1080 fibrosarcoma cells, evaluated by image cytometry, and expression of gelatinases MMP‐2 and MMP‐9, two metalloproteinases implicated in cancer progression and metastasis.
Results
5‐azadC induced significant variation in chromatin higher order organization, particularly chromatin decondensation, associated with reduction in global DNA methylation, concomitantly with increase in MMP‐9, and to a lesser extent, MMP‐2 expression. TSA alone did not have any effect on HT1080 cells, but exhibited differential activity when added to cells treated with 5‐azadC. When treated with both drugs, nuclei had higher texture abnormalities. In this setting, reduction in MMP‐9 expression was observed, whereas MMP‐2 expression remained unaffected.
Conclusions
These data show that hypomethylating drug 5‐azadC and histone deacetylase inhibitor TSA were able to induce modulation of higher order chromatin organization and gelatinase expression in human HT1080 fibrosarcoma cells.
Introduction
Over the past decade, computerized microscopic image analysis has widely been used in pathology and cytology, either for identification of benign or malignant tumour cells, evaluation of subtle morphological cell changes [which cannot be recognized by conventional microscopy, that is, malignancy‐associated changes (MACs)], or for detection of relevant tumour prognostic markers 1, 2, 3, 4. Moreover, this technique has proven to be efficient for investigation of chromatin remodelling induced by various drugs and therapeutic agents 5, 6, 7. Chromatin remodelling appears, at least in part, to be controlled by two key epigenetic mechanisms, DNA methylation, and post‐translational modifications of histones, which both regulate accessibility of transcriptional machinery to DNA 8. These can result in modifications of chromatin texture as evaluated by image cytometry. For instance, DNA methylation level has been associated with chromatin reorganization, including changes in distribution of regions of heterochromatin 9, 10, 11 and histone acetylation, with interphase chromatin decondensation 12, 13. Numerous data now have strengthened the major role of these epigenetic mechanisms in regulation of expression of various genes, particularly in neoplastic diseases 14. Indeed, abnormal methylation profile of cytosine residues at gene promoters within CpG‐rich regions, termed ‘CpG islands’, is frequently observed in tumours, and contributes to the malignant phenotype by silencing tumour suppressor genes 15, 16, 17. Post‐translational modifications of nucleosome core histones H3, H4, H2A and H2B consist of addition of different chemical groups on their N‐terminal tails. One of the most characterized modifications is an acetylation/deacetylation process mediated by histone acetyl transferases (HATs) and histone deacetylases (HDACs) enzymes. These histone N‐terminal tail modifications change binding affinity between DNA and histones, thereby modulating chromatin condensation. Thus, histone acetylation may induce activation of gene transcription 18, 19.
In cancer, matrix metalloproteinases (MMPs) are involved in formation of a microenvironment that contributes to tumour cell progression 20. Among these MMPs, gelatinases (gelatinase A or MMP‐2 and gelatinase B or MMP‐9) play a major role, mainly by controlling activity of molecules that target specific receptors that regulate cell proliferation, migration, inflammation and angiogenesis 21. MMP‐2 and ‐9 expressions are deregulated in a variety of malignancies, and increase in their expression and activity are generally associated with poor prognosis 22, 23. Such overexpression correlates with elevated invasive potential of tumour cells, indicating the crucial role of these MMPs in the metastatic process 20. MMP‐2 and ‐9 activities are regulated by interleukins, growth factors and tumour necrosis factor‐α at different levels, including gene transcription 20. Besides classical transcription factors such as AP‐1, recent studies have demonstrated involvement of other transcriptional regulators, for example, MMP‐2 has been described as a target for FoxO3 24 and Runx2 25, whereas MMP‐9 can be regulated by Reck 26 and SMYD3 27. Epigenetic mechanisms such as DNA methylation, histone acetylation and methylation at the MMP promoter could also be implicated in this regulation 28. Furthermore, there is evidence of crosstalk between DNA methylation and histone post‐translational modifications. In this case, histone modifications provide labile transcriptional repression, and DNA methylation results in highly stable gene silencing 29, 30. It has been previously reported that hypomethylating agent 5‐aza‐2′‐deoxycytidine (5‐azadC) and histone deacetylase inhibitor (HDI) trichostatin A (TSA) can act in synergy to induce gene re‐expression in leukaemic cells 31. Thus, in this study, we have analysed effects of these drugs on higher order chromatin organization, evaluated by image cytometry and on expression of gelatinase genes in the invasive HT1080 fibrosarcoma tumour cell line.
Material and methods
Cell culture and treatments
Highly invasive human fibrosarcoma HT1080 cells (ATCC, CCL‐121) were grown at 37 °C in RMPI medium supplemented with 10% foetal calf serum (FCS), 100 U/ml penicillin and 100 μg/ml streptomycin. All cultures were maintained in a humidified atmosphere of 95% air/5% CO2 at 37 °C. Cultures were subcultured twice weekly. Exponentially expanding cell populations were used in all experiments. Cell viability was assessed by trypan blue exclusion assay. Prior to experiments, cells were washed twice in PBS then incubated in serum‐free medium for 24 h. Cells were treated/not treated with up to 5 μm of 5‐aza‐2′‐deoxycytidine (5‐azadC, Sigma‐Aldrich, Saint‐Quentin Fallavier, France) and/or 100 ng/ml of trichostatin A (TSA; Sigma‐Aldrich) for indicated periods of time.
Image cytometry
Cells were cultured and treated with 5‐azadC and/or TSA in LabTek chambered slides (Nunc, Roskilde, Denmark). Nuclear texture analysis was performed as reported 12. Briefly, cells were air‐dried and fixed in alcohol‐formalin mixture (95% ethanol, 3% formaldehyde in saline; 3:1) for 10 min. After hydrolysis with 5N HCl for 30 min, cells were stained using the Feulgen method with freshly prepared Schiff's reagent (pararosanilin chloride, CI 42500, 0.5% in sulphite water) for 2 h in the dark at 22 °C. Image cytometry was performed using an image analysis system (SAMBA 2005, Samba Technologies, Meylan, France) coupled to colour 3CCD camera (Sony Corp., Tokyo, Japan; 752 × 582 pixels) and a microscope (Axioscop; Karl Zeiss, Oberkochen, Germany). Measurements were made using plan‐achromat ×40 objective. Effective pixel sampling space within the plane of the sample was 0.20 μm. For each nuclear image, ten parameters were computed: one densitometric feature, integrated optical density (IOD) and nine textural features. IOD is summation of all pixels in the image of the nucleus and quantitatively measures total intensity of staining by the DNA‐binding dye. As DNA staining in the Feulgen reaction is specific and stoichiometric, IOD is directly related to total nuclear DNA content. Distribution of nuclei according to IOD was plotted to provide cell cycle distribution. Textural features observed by image cytometry are closely related to location of a given cell in the cell cycle. Comparisons of textures should therefore be performed on cells selected within a specific cycle phase. For this purpose, G0/G1 nuclei were isolated on the basis of their IOD value, as previously reported 12. A minimum of 200 G0/G1 nuclei were extracted for each cell population. Nine texture parameters were computed from these nuclei. Four features were calculated using grey level co‐occurrence matrix: local mean of grey levels (LM), energy (E), entropy (ENT) and inertia (I). Five parameters were calculated on the run‐length matrix: short run‐length emphasis (SRE), long run‐length emphasis (LRE), grey level distribution (GLD), run‐length distribution (RLD) and run‐length percentage (RPC) 32. It has been previously reported that variations in these parameters could be related to chromatin condensation, distribution or organization 32, 33.
MMP‐1, ‐2 and ‐9 gene expression analyses
After drug treatments, cells were washed twice in ice‐cold PBS and total RNAs were isolated using NucleoSpin RNA II kit (Macherey Nagel, Hoerdt, France). For quantitative RT‐PCR, 1 μg of RNA was reverse transcribed using M‐MLV reverse transcriptase (Invitrogen, Fisher Scientific, Illkirch, France), and each cDNA sample was analysed by real‐time PCR, using Platinum SYBR Green qPCR SuperMix‐UDG kit (Invitrogen) on the LightCycler system (Roche Diagnostics, Meylan, France). MMP‐1, MMP‐2 and MMP‐9 transcripts were amplified using primers described in Table 1. MMP‐1 was used as control gene, as we have shown previously that this gene expression is induced by 5‐azadC 34. Relative quantification was performed by using housekeeping gene β2microglobulin as internal control.
Table 1.
PCR Primer sequences
| Target | Forward and reverse primer sequences |
|---|---|
| MMP‐1 | F: 5′‐GAGCAAACACATCTGACCTACAGGA‐3′ |
| R: 5′‐TTGTCCCGATGATCTCCCCTGACA‐3′ | |
| MMP‐2 | F: 5′‐TCTTCCCCTTCACTTTCCTG‐3′ |
| R: 5′‐ACTTGCGGTCGTCATCGT‐3′ | |
| MMP‐9 | F: 5′‐TGACAGCGACAAGAAGTGG‐3′ |
| R: 5′‐GGCGAGGACCATAGAGGTG‐3′ | |
| β2‐microglobulin | F: 5′‐ATCTTCAAACCTCCATGATG‐3′ |
| R: 5′‐ACCCCCACTGAAAA AGATGA‐3′ | |
| MSP MMP‐2 methylated | F: 5′‐ATTGTTAGGATTTGCGGC‐3′ |
| R: 5′‐CTCGATACGTATAACCGCCT‐3′ | |
| MSP MMP‐2 unmethylated | F: 5′‐GGGATTGTTAGGATTTGTGGT‐3′ |
| R: 5′‐AACTCAATACATATAACCACCTC‐3′ | |
| MSP MMP‐9 methylated | F: 5′‐ATTAAGGTAGGCGTGGTTTC‐3′ |
| R: 5′‐AAACCTAAAACGTAAACGCC‐3′ | |
| MSP MMP‐9 unmethylated | F: 5′‐GGATTAAGGTAGGTGTGGTTTT‐3′ |
| R: 5′‐AAACCTAAAACATAAACACCAA‐3′ |
Global DNA methylation analysis
Global DNA methylation level after treatment with 5‐azadC was evaluated by methylation‐sensitive restriction assay (MSRA) as previously described 35. Briefly, 0.5 μg of genomic DNA was incubated overnight at 37 °C with 20 units of HpaII (methyl‐sensitive) or MspI (methyl‐insensitive) restriction enzymes (New England BioLabs, Ipswich, UK). The next day, 10 units of each enzyme were added for 2 more hours. DNA digestion level was verified by electrophoresis on 0.8% agarose gel. Electrophoretic images were analysed using ImageJ software (http://rsb.info.nih.gov/ij) 36.
Methylation‐specific PCR
Methylation level of MMP‐2 and MMP‐9 promoters was determined by methylation‐specific PCR (MSP). Genomic DNA was isolated using QIAamp DNA Mini kit (Qiagen, Courtaboeuf, France). 0.5 μg of genomic DNA was bisulphite‐converted using EpiTect Bisulfite kit (Qiagen) according to the manufacturer's instructions. Bisulphite‐modified DNA samples were amplified by primers specific for both methylated and unmethylated sequences of the −224 to −51 region of the MMP‐2 promoter, or 3382–3488 region of the MMP‐9 gene (Table 1). Primers were designed using Methyl Primer Express software (Life Technologies, Saint‐Aubin, France). After primer set optimization using EpiTect PCR Control DNA kit (Qiagen), PCR was performed on 2 μl of converted DNA using Hot‐Start Taq polymerase (Qiagen). After amplification, PCR products were analysed on 12% polyacrylamide gel and revealed by ethidium bromide and UV light.
Statistical analysis
For image cytometry data, mean, standard deviation and range values of nuclear parameters were calculated for each cell population. Variability in parameter measurements in each cell population was analysed by one‐way analysis of variance. Significance of differences between parameter values was estimated by Kolmogorov–Smirnov test on cumulated frequencies 37.
To perform comparisons between multiple cell groups, deviation index (z‐score) was calculated, as previously reported 12. For each parameter measured in a given nucleus, differences in value to feature value observed in untreated control nuclei, were computed and standardized by dividing them by corresponding standard deviations in the control data sets 38. Average nuclear abnormality index (NAI) was then calculated for each cell line as arithmetic mean of absolute values of deviation indices observed for the 9 features per data set. This NAI represents a data reduction technique that permits taking into account all z‐scores that constitute nuclear textural signature 38. Significance of differences between index values was estimated using Student's t‐test.
Multivariate analysis was performed with the Samba software. Two main kinds of multidimensional analyses were used: supervised classification by discriminant analysis and unsupervised classification 39. Linear stepwise discriminant analysis was based on use of the F‐test to select variables. Its purpose was to select textural features whose variations best characterize different cell populations. This discriminant analysis could be completed by canonical analysis, which derives canonical variables (linear combinations of independent variables). Significance of differences between canonical variable values computed in the various cell populations was estimated by the Kolmogorov–Smirnov test on cumulated frequencies. Unsupervised multidimensional partitioning (cluster analysis) was applied to separate cell groups that differed in distribution of texture parameters. This analysis successively looked for most heterogeneously distributed feature, split the population into subgroups, and fused non‐significant subgroups. The process was iterated for all parameters and does not require any a priori knowledge concerning different cell types eventually to be found in the population. It preserves total objectivity about status of a given cell 40.
RT‐PCR results were expressed as mean ± SEM of at least 3 independent experiments. Significance of differences observed was analysed using the Kruskal–Wallis test.
Results
Nuclear texture and DNA methylation changes induced by 5‐azadC
Nine textural features were computed on each nuclear image. Values of these parameters in control cells and cells treated with 5 μm of 5‐azadC for 72 h are shown in Table 2. 5‐azadC‐treated cells displayed significant variations compared to control cells: less compact chromatin (increase in E and reduction in LM, ENT and I), with increase in distance between isodensity points (reduction in SRE and increase in LRE), confirming more homogeneous distribution of chromatin within nuclei (increase in GLD measuring uniformity of distribution of optical densities, reduction in RLD and RPC). For all computed parameters, distribution in 5‐azadC‐treated cells and in control cells was significantly different (P < 0.05). However, due to high sensitivity of texture features, we analysed variability in their measurements in three separate control and treated cell groups. None of the nine features displayed any significant variation within these groups (Table 3).
Table 2.
Values of textural features in HT1080 cells treated with 5 μm 5‐azadC for 72 h
| Parameters | Cell treatment | |
|---|---|---|
| None (n = 320) | 5‐azadC 5 μm (n = 276) | |
| LM | 33.4 ± 7.4 (12.3–61.0) | 16.5 ± 4.6 (7.7–33.2) |
| E | 5.0 ± 0.7 (2.0–19.8) | 12.2 ± 4.2 (4.3–31.5) |
| ENT | 33.7 ± 4.5 (18.7–42.5) | 24.5 ± 3.2 (14.2–34.1) |
| I | 31.7 ± 9.0 (15.7–75.4) | 20.6 ± 2.8 (13.8–36.4) |
| SRE | 60.8 ± 3.5 (47.7–76.3) | 52.8 ± 2.2 (47.3–60.5) |
| LRE | 6.0 ± 1.9 (3.3–13.7) | 9.3 ± 1.7 (5.3–16.7) |
| GLD | 12.2 ± 4.6 (6.9–34.5) | 23.4 ± 5.1 (11.5–46.3) |
| RLD | 36.0 ± 5.9 (23.7–53.9) | 28.1 ± 2.1 (22.8–35.2) |
| RPC | 10.3 ± 1.2 (7.1–13.3) | 8.5 ± 0.6 (6.7–10.4) |
Textural features evaluated in G0/G1 cell nuclei. For each parameter, value expressed as mean ± SD, and numbers in italics represent distribution range of each parameter in the population. For all parameters, distributions in control and treated cells are significantly different (P < 0.05, Kolmogorov–Smirnov test on cumulated frequencies). E, energy; ENT, entropy; GLD, grey‐level distribution; I, inertia; LM, local mean; LRE, long run‐length emphasis; RLD, run‐length distribution; RPC, run‐length percentage; SRE, short run‐length emphasis.
Table 3.
Variability in measurements of nuclear texture parameters
| Parameters | Variability within control groups from 3 experiments | Variability within treated groups from 3 experiments | ||
|---|---|---|---|---|
| F value | P | F value | P | |
| LM | 1.80 | 0.16 | 0.15 | 0.86 |
| E | 1.37 | 0.25 | 0.23 | 0.79 |
| ENT | 1.06 | 0.34 | 0.10 | 0.90 |
| I | 1.07 | 0.34 | 0.18 | 0.83 |
| SRE | 0.48 | 0.61 | 0.07 | 0.93 |
| LRE | 1.17 | 0.31 | 0.61 | 0.54 |
| GLD | 1.12 | 0.32 | 0.11 | 0.89 |
| RLD | 0.80 | 0.45 | 0.03 | 0.97 |
| RPC | 1.10 | 0.33 | 0.08 | 0.91 |
Nuclear texture parameters computed of G0/G1 nuclei from control cells and cells treated for 72 h with 5 μm 5‐azadC, from 3 separate experiments. Values within control or treated groups were compared by one‐way analysis of variance. E, energy; ENT, entropy; GLD, grey‐level distribution; I, inertia; LM, local mean; LRE, long run‐length emphasis; RLD, run‐length distribution; RPC, run‐length percentage; SRE, short run‐length emphasis.
All textural parameters might be involved in definition of nuclear phenotype. Features enabling optimal separation between control and 5‐azadC‐treated cells were then selected by performing linear discriminant analysis. Most discriminant features, ranked according to their discriminant power, are listed in Table 4. Three features (GLD, LM and LRE) were predominant for identification of 5‐azadC‐treated cells, and adding new features in the discriminant analysis did not increase classification accuracy. Accuracy at the first step (87.7%) was highly significant. Analysis was followed by canonical transformation of data, resulting in definition of canonical variables. Usually, first canonical variable (CV1) is the most important as it always shows the most discriminant power between groups. Values of this canonical variable, as observed in cells treated with various concentrations of 5‐azadC, are displayed in Fig. 1. Significant increase in CV1 was observed in cells treated with 1 μm of 5‐azadC, and its value was enhanced with higher concentrations of 5‐azadC.
Table 4.
Ranking of best discriminant parameters and calculation of canonical variable
| Parameter | Discriminant power | Good classification rate (%) | Coefficient of CV1 |
|---|---|---|---|
| GLD | 754 | 87.7 | 63.1 |
| LM | 87 | 91.1 | −14.6 |
| LRE | 53 | 92.2 | 347.8 |
The most discriminant features were selected after linear discriminant analysis applied to files from control cells and cells treated with 5 μm of 5‐azadC for 72 h. These parameters were then used in computation of the canonical variable. GLD, grey‐level distribution; LM, local mean; LRE, long run‐length emphasis.
Figure 1.
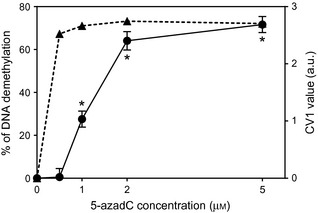
Variations in nuclear texture and DNA methylation of 5‐azadC‐treated cells. Textural variations are expressed as Canonical Variable 1 (mean ± SEM), as described in the Materials and methods section. CV1 was calculated for each selected cell using discriminant features and coefficients described in Table 4. DNA methylation level was assessed by MSRA. Amounts of HpaII‐undigested DNA were evaluated by electrophoresis and quantified using ImageJ software. Results are expressed as % of methylation reduction (mean of 2 separate experiments). Closed dots, CV1 values; closed triangles, MSRA data. *P < 0.05, Kolmogorov–Smirnov test on cumulated frequencies.
To overcome a priori knowledge concerning analysed cell populations (control or treated), changes observed in 5‐azadC treated cells were objectively evaluated by an unsupervised classification of cells. All data from control and 5‐azadC‐treated cells were merged into a single group, which was then submitted to unsupervised multidimensional partitioning. This method partitioned cells into 2 significant subgroups, A and B. Distribution of the 9 textural parameters into the 2 subgroups (Fig. 2) showed identical variations to those observed between controls and cells treated with 5 μm 5‐azadC (Table 2). Discriminant analysis computed using A and B subsets as learning sets and constituting primary cell populations (control cells and cells treated with different concentrations of 5‐azadC) as test sets led to results displayed in Table 5. These data show that treating cells with increasing concentrations of 5‐azadC induced progressive increase in numbers of ‘B‐subset cells’ in respective cell populations. This was non‐subjective evidence for dose‐related appearance of nuclear texture changes in HT1080 cells treated with 5‐ azadC.
Figure 2.
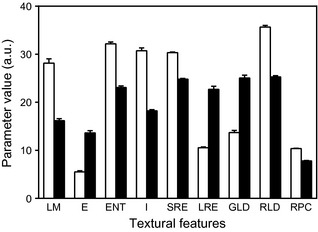
Variations in textural parameters in subsets defined after unsupervised multidimensional partitioning. Each bar represents mean ± SEM of parameter value in subsets. White columns, subset A; black columns, subset B. For all parameters, distributions in subset A and subset B are significantly different (P < 0.05, Kolmogorov–Smirnov test on cumulated frequencies). E, energy; ENT, entropy; GLD, grey‐level distribution; I, inertia; LM, local mean; LRE, long run‐length emphasis; RLD, run‐length distribution; RPC, run‐length percentage; SRE, short run‐length emphasis.
Table 5.
Distribution of the 5‐azadC‐treated cells among subsets defined after unsupervised partitioning
| Cell populations | Cells classified in subsets (%) | |
|---|---|---|
| A | B | |
| Control | 254 (88) | 65 (12) |
| 5‐azadC 0.5 μm | 156 (60) | 102 (40)* |
| 5‐azadC 1 μm | 107 (38) | 177 (62)* |
| 5‐azadC 2 μm | 43 (15) | 250 (85)* |
| 5‐azadC 5 μm | 25 (9) | 250 (91)* |
*P < 0.05 when compared to values in control cells (Chi‐square test). All G0/G1 cell data files from control cells and cells treated with 5 μm of 5‐azadC for 72 h were merged and the resulting population was submitted to unsupervised classification, which identified 2 subsets, A and B. Cells from constituting populations were classified in these subsets by linear discriminant analysis.
To compare these nuclear textural changes with modifications of DNA methylation induced by 5‐azadC, level of global DNA methylation in the various cell populations was estimated by MSRA. Strong reduction in DNA methylation (more than 60%) was observed in HT1080 cells even at low concentrations (0.5 μm) of 5‐azadC (Fig. 1).
MMP‐2 and ‐9 expressions induced by 5‐azadC in HT1080 cells
To assess whether these nuclear textural and DNA methylation changes were associated with modifications in gene expression, expression of gelatinases (MMP‐2 and MMP‐9) was evaluated in 5‐azadC‐treated HT1080 cells. Cells were incubated with 5‐azadC (5 μm) for various times, and levels of endogenous MMP‐2 and MMP‐9 mRNAs were monitored by real‐time RT‐PCR. Compared to control cells, MMP‐2 gene expression was significantly higher after 72 h treatment with 5 μm of 5‐azadC (3‐fold increase). MMP‐9 expression was significantly higher after 24 h of treatment (1.8‐fold increase) and continued to increase up to 72 h treatment (8‐fold increase) (Fig. 3a).
Figure 3.
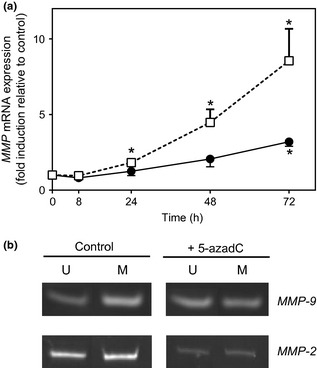
Effects of 5‐azadC on MMP‐2 and MMP‐9 gene expression. (a) HT1080 cells were treated or not treated with 5‐azadC (5 μm) for various times as indicated. Levels of endogenous mRNAs were monitored using real‐time RT‐PCR. β2 microglobulin (β2m) = internal control. After normalization to β2m, results are expressed as the mean ± SEM fold induction relative to control. Closed dots: MMP‐2, open squares: MMP‐9; *P < 0.05 (Kruskal–Wallis test, n = 5). (b) Methylation status of the MMP‐2 and ‐9 genes evaluated by MSP. HT1080 cells treated or not treated with 5‐azadC (5 μm) for 72 h. U: unmethylated; M: methylated. Pictures representative of 2 independent experiments.
Methylation‐specific PCR was then performed to determine whether these expression patterns were correlated with changes in methylation of MMP‐2 or MMP‐9 genes. Treatment of HT1080 cells with 5 μm of 5‐azadC for 72 h was associated with changes in MMP‐9 gene methylation status (Fig. 3b). ImageJ analysis of these results shows that 5‐azadC treatment induced increase in unmethylated (U) and reduction in methylated (M) areas, on MSP blots. Ratio M/U+M was about 70% for control cells, but 48% in 5‐azadC‐treated cells. Besides, the MMP‐2 MSP profile seemed to remain unchanged in 5‐azadC‐treated cells, with a ratio of 54% for control and 51% for 5‐azadC‐treated cells.
Differential modulation of 5‐azadC induced nuclear textural changes and MMP expression by TSA
To determine whether histone acetylation could influence modifications induced by 5‐ azadC in HT1080 cells, subsequent treatment with histone deacetylase inhibitor TSA (100 ng/ml for 24 h) was applied to cells previously treated or not with 5‐azadC. Nuclear textural characteristics were evaluated for these cells as well as expressions of MMP‐2 and ‐9, and MMP‐1 as control. To allow for comparison of the various treatments, textural changes were expressed as nuclear abnormality index (NAI). TSA alone did not induce any significant increase in NAI (Fig. 4a). When TSA was applied to cells previously treated with 5 μm of 5‐azadC, significant increase in NAI value was observed (TSA‐induced NAI = 0.87 ± 0.08, P < 0.05 compared to cells treated with 5‐azadC alone, Student's t‐test). However, this enhancement occurred in cells previously treated with 5 μm, but not with 2 μm of 5‐azadC. In the latter case, TSA induced only slight NAI increase (TSA‐induced NAI = 0.29 ± 0.06, not significant compared to cells treated with 5‐azadC alone), similar to observations of cells incubated with TSA alone (NAI = 0.27 ± 0.11) (Fig. 4a). At MMP gene level, TSA alone did not display any effect on MMP‐2 or MMP‐9 expressions (Fig. 4b). When applied to cells previously incubated with 5 μm of 5‐azadC, TSA induced a reduction in MMP‐9 gene expression compared to 5‐azadC alone. On the other hand, this subsequent treatment with TSA did not modulate MMP‐2 expression, but strongly increased MMP‐1 gene expression (Fig. 4b).
Figure 4.
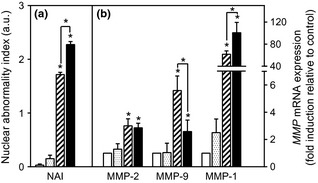
Effects of 5‐azadC and TSA on nuclear texture and MMP‐2/‐9/‐1 gene expressions. HT1080 cells treated or not treated with TSA (100 ng/ml for 24 h), 5‐azadC (5 μm for 72 h) or both drugs. (a) Results of nuclear texture changes in G0/G1 nuclei expressed as mean ± SEM of nuclear abnormality index (NAI). (b) Levels of endogenous mRNAs were monitored by real‐time RT‐PCR. β2 microglobulin (β2m) used as internal control. After normalization to β2m, results expressed as mean ± SEM fold induction relative to control. Open bars: control cells; dotted bars: cells treated with TSA alone; hatched bars, cells treated with 5‐azadC alone; black bars, cells treated with 5‐azadC and TSA. *P < 0.05 (Kruskal–Wallis test, n = 3).
Discussion
Numerous studies have demonstrated potential of chromatin texture analyses to identify or follow up neoplastic processes. In particular, 2D analyses of Feulgen‐stained cells and tissues have been widely applied for diagnosis or prognosis of tumours 1, 41, 42, 43, 44. They have been used either to characterize tumour cells displaying specific properties, such as drug resistance 39, or to evaluate drug effects on cancer cells 5, 6, 7. Other image cytometry methods have been successfully applied to nuclear texture analysis, including 3D analysis of either fluorescence confocal images, optical absorption tomographic images, or low coherence interferometry on living cell specimens 45, 46, 47. However, effects of the cell cycle on nuclear texture is an important criterion not always taken into account in such studies. Clearly, chromatin texture depends on cell cycle stage and such nuclear features have been used either to discriminate different cell cycle phases 48 or to better define morphological aspects of transitions between stages 33. To evaluate potential cancer‐ or drug‐related effects on chromatin supra‐organization, comparisons of textures should be performed on cells issueing from a specific cycle phase, for example, G0/G1 cells. In this context, texture analysis of Feulgen‐stained nuclei offer an easy‐to‐perform and efficient method. Recently, we compared data obtained by conventional 2D texture analysis and Raman microspectroscopy on nuclei from Jurkat leukaemic cells, and both techniques showed potential to discriminate cells treated or not with different HDIs 49. Regardless of technique used, functional significance of variations in textural features is sometimes unclear. For instance, changes in chromatin higher order organization have been attributed to chromosomal abnormalities, transcription, or proliferation 50. Moreover, functional relevance of nuclear structure needs extensive study on interplay between nuclear architecture and gene expression; epigenetic abnormalities, frequently observed in cancer, may also be implicated such textural irregularities. In this work, we have shown by image cytometry that DNA hypomethylating agent 5‐azadC was able to induce significant changes in chromatin higher order organization in HT1080 fibrosarcoma cells. Three features (GLD, LM and LRE) appeared discriminant in 5‐azadC‐treated cell identification. Interestingly, they concern both chromatin condensation and distribution within the nucleus 33 and their variations suggest that cells treated with 5‐azadC display decondensed, loosely packed and homogeneously distributed chromatin; it has been reported that 5‐azadC drastically inhibits condensation in mammalian constitutive heterochromatin 51. These variations appear to be linked to 5‐azadC treatment itself, as variability within control or experimental groups appeared quite low (Table 3). Indeed, presence of textural artefacts induced by analytical methods used, cannot be entirely ruled out. For instance, it has been shown that processing techniques (dewaxing, fixation) can influence measurements of nuclear structure 52. However, fixation combining ethanol and formaldehyde has been successfully applied to analysis of nuclear texture patterns linked to cell phenotypes 39, 53, 54 or to drug treatments 6, 12. It could represent good compromise for optimal satisfactory DNA staining after hydrolysis 55, therefore enabling G0/G1 nucleus selection and convenient textural analysis 56; this gave rise to reproducible results (Table 3). The first textural changes were observed after treatment with 1 μm of 5‐azadC, whereas global DNA hypomethylation was detected at lower drug dose. These data fit well with other reports indicating that very low concentrations of 5‐azadC are able to induce DNA hypomethylation 31, 57. Although chromatin high order changes induced by 5‐azadC were mainly related to its hypomethylating properties 58, relative low sensitivity of nuclear texture analysis could indicate that significant concentration of this drug, or some additional mechanisms, would be needed to induce textural chromatin alterations. In the same way, in promyelocytic leukaemia, texture analysis was not able to detect chromatin alterations in leukaemic cells from patients with methylation of specific genes 59. In HT1080 cells, treatment with TSA enhanced levels of nuclear changes (evaluated by NAI) induced by 5‐azadC. It has already been shown that panobinostat or TSA act in synergy with 5‐azadC, and that combination of both drugs induces marked increase in histone acetylation 31, 60. However, adding TSA to 5‐azadC‐treated HT1080 cells induced a significant effect on nuclear texture, but only when cells were previously incubated with higher concentration of 5‐azadC. This suggests that texture analysis can only detect TSA‐induced changes in chromatin distribution patterns if cells have been sufficiently sensitized through hypomethylation by 5‐azadC. However, it must be emphasized that these data apply to G0/G1 HT1080 cells only, as it has been reported that extent of TSA‐induced chromatin changes was both cell cycle‐ and cell line‐dependent 61.
Significant changes in chromatin high order organization, evaluated through nuclear texture, have already been reported as markers of tumour cell aggressiveness or metastatic potential 41, 62. As gelatinases are implicated in tumour metastasis, we investigated their expression in HT1080 fibrosarcoma cells treated with 5‐azadC and/or TSA. Treatment with 5‐azadC induced higher increase in MMP‐9 expression than in MMP‐2 expression. Similarly, we have previously observed that 5‐azadC enhanced MMP‐1 expression strongly in these cells 34. Induction of MMP‐2 and MMP‐9 genes by 5‐azadC has already been reported in breast cancer 63, pancreatic cells 64 and lymphomas 65. In our results, expression was associated with significant modulation of DNA methylation of MMP‐9 but not of MMP‐2 gene promoter. Large CpG islands (4.65 kb) are present in the MMP‐9 gene‐coding region, which correlates with the key role of DNA methylation in regulation of its expression 28. CpG island size is more limited (1.5 kb) with MMP‐2 gene expression, and knockout of DNMT1 and DNMT3b in mice has been unable to induce MMP‐2 expression, while it was able to induce MMP‐3 66. This suggests some level of resistance of MMP‐2 to hypomethylating drugs, as resistance to drug‐induced hypomethylation is mostly overcome in DNMT1; DNMT3B double knockout cells 67. On the other hand, TSA alone did not display any effect on these gene expressions. Similar results have already been observed for MMP‐1 or MMP‐2 in HT1080 cells 34, 68. Interestingly, further treatment with TSA associated with 5‐azadC induced different effects on MMP gene expression. TSA was inactive on MMP‐2, while it reduced 5‐azadC‐induced expression of MMP‐9. This was different from already described enhancement of MMP‐1 expression induced by this combination of drugs 34. Variations observed for MMP‐9 correlate with previous data showing that TSA is able to reduce MMP‐9 expression in gastric cancer 69, in thyroid cancer cells 70 or in human endometrial stromal cells 71. Moreover, it has been shown that MCT1, a new HDI, is able to inhibit MMP‐9 expression induced by 5‐azadC in HL60 haematopoietic cells 72.
Our findings indicate that hypomethylating drug 5‐azadC and HDI TSA induced modulations in higher order chromatin organization and in gelatinase expression in human HT1080 fibrosarcoma cells. However, comparison of data originating from nuclear texture analysis on the one hand, and gene expression analysis by RT‐PCR on the other, must be performed cautiously. The first technique constitutes a cell‐by‐cell type method, whereas here RT‐PCR was applied to RNA pooled from large numbers of cells, without selecting those in G0/G1. Thus, further analyses must compare texture from isolated living cells with single‐cell gene expression profiling 73. Observed increase in gelatinase expression could help dissect effects of DNA hypomethylating agents on tumour cell phenotype. Nevertheless, epigenetic events induce multiple gene regulation and these results concern only MMP‐2 and ‐9 genes. These data must therefore be completed by analyses on a larger spectrum of cancer‐related genes, and complementary approaches must be used to address the complex interplay between nuclear architecture and functions like gene expression.
Acknowledgements
MP is the recipient of a fellowship from the French ‘Ministère de l'Enseignement Supérieur et de la Recherche’. MS is supported by a Waxweiler grant for cancer prevention research from the Action Lions ‘Vaincre le Cancer’. This work was supported by grants from the Comité Départemental de l'Aube de la Ligue Nationale contre le Cancer. The work performed at Laboratoire de Biologie Moléculaire et Cellulaire du Cancer was supported by Télévie Luxembourg, the ‘Recherche Cancer et Sang’ foundation and the ‘Recherches Scientifiques Luxembourg’ association. We thank G.D. Sockalingum for reviewing the manuscript.
References
- 1. Millot C, Dufer J (2000) Clinical applications of image cytometry to human tumour analysis. Histol. Histopathol. 15, 1185–1200. [DOI] [PubMed] [Google Scholar]
- 2. Dey P (2010) Cancer nucleus: morphology and beyond. Diagn. Cytopathol. 38, 382–390. [DOI] [PubMed] [Google Scholar]
- 3. Fafin‐Lefevre M, Morlais F, Guittet L, Clin B, Launoy G, Galateau‐Sallé F (2011) Nuclear morphology for the detection of alterations in bronchial cells from lung cancer: an attempt to improve sensitivity and specificity. Anal. Quant. Cytol. Histol. 33, 183–195. [PubMed] [Google Scholar]
- 4. Guillaud M, Le Riche JC, Dawe C, Korbelik J, Coldman A, Wistuba II et al (2005) Nuclear morphometry as a biomarker for bronchial intraepithelial neoplasia: correlation with genetic damage and cancer development. Cytometry A 63, 34–40. [DOI] [PubMed] [Google Scholar]
- 5. Mello MLS, Vidal BC, Russo IH, Lareef MH, Russo J (2007) DNA content and chromatin texture of human breast epithelial cells transformed with 17‐beta‐estradiol and the estrogen antagonist ICI 182,780 as assessed by image analysis. Mutat. Res. 617, 1–7. [DOI] [PMC free article] [PubMed] [Google Scholar]
- 6. Trussardi‐Regnier A, Lavenus S, Gorisse M‐C, Dufer J (2009) Thalidomide alters nuclear architecture without ABCB1 gene modulation in drug‐resistant myeloma cells. Int. J. Oncol. 35, 641–647. [DOI] [PubMed] [Google Scholar]
- 7. De Campos Vidal B, Russo J, Mello ML (1998) DNA content and chromatin texture of benzo[a]pyrene‐transformed human breast epithelial cells as assessed by image analysis. Exp. Cell Res. 244, 77–82. [DOI] [PubMed] [Google Scholar]
- 8. Vaissière T, Sawan C, Herceg Z (2008) Epigenetic interplay between histone modifications and DNA methylation in gene silencing. Mutat. Res. 659, 40–48. [DOI] [PubMed] [Google Scholar]
- 9. Mampumbu AR, Mello MLS (2006) DNA methylation in stingless bees with low and high heterochromatin contents as assessed by restriction enzyme digestion and image analysis. Cytometry A 69, 986–991. [DOI] [PubMed] [Google Scholar]
- 10. Gertych A, Wawrowsky KA, Lindsley E, Vishnevsky E, Farkas DL, Tajbakhsh J. (2009) Automated quantification of DNA demethylation effects in cells via 3D mapping of nuclear signatures and population homogeneity assessment. Cytometry A 75, 569–583. [DOI] [PMC free article] [PubMed] [Google Scholar]
- 11. Gertych A, Farkas DL, Tajbakhsh J (2010) Measuring topology of low‐intensity DNA methylation sites for high‐throughput assessment of epigenetic drug‐induced effects in cancer cells. Exp. Cell Res. 316, 3150–3160. [DOI] [PMC free article] [PubMed] [Google Scholar]
- 12. El‐Khoury V, Gomez D, Liautaud‐Roger F, Trussardi‐Régnier A, Dufer J (2004) Effects of the histone deacetylase inhibitor trichostatin A on nuclear texture and c‐jun gene expression in drug‐sensitive and drug‐resistant human H69 lung carcinoma cells. Cytometry A 62, 109–117. [DOI] [PubMed] [Google Scholar]
- 13. Toéth KF, Knoch TA, Wachsmuth M, Frank‐Stöhr M, Stöhr M, Bacher CP et al (2004) Trichostatin A‐induced histone acetylation causes decondensation of interphase chromatin. J. Cell Sci. 117, 4277–4287. [DOI] [PubMed] [Google Scholar]
- 14. Sandoval J, Esteller M (2012) Cancer epigenomics: beyond genomics. Curr. Opin. Genet. Dev. 22, 50–55. [DOI] [PubMed] [Google Scholar]
- 15. Florean C, Schnekenburger M, Grandjenette C, Dicato M, Diederich M (2011) Epigenomics of leukemia: from mechanisms to therapeutic applications. Epigenomics 3, 581–609. [DOI] [PubMed] [Google Scholar]
- 16. Schnekenburger M, Diederich M (2012) Epigenetics offer new horizons for colorectal cancer prevention. Curr. Colo. Cancer Rep. 8, 66–81. [DOI] [PMC free article] [PubMed] [Google Scholar]
- 17. Seidel C, Florean C, Schnekenburger M, Dicato M, Diederich M (2012) Chromatin‐modifying agents in anti‐cancer therapy. Biochimie 94, 2264–2279. [DOI] [PubMed] [Google Scholar]
- 18. Seidel C, Schnekenburger M, Dicato M, Diederich M (2012) Histone deacetylase modulators provided by Mother Nature. Genes Nutr. 7, 357–367. [DOI] [PMC free article] [PubMed] [Google Scholar]
- 19. Folmer F, Orlikova B, Schnekenbuger M, Dicato M, Diederich M (2010) Naturally occurring regulators of histone acetylation/deacetylation. Curr. Nutr. Food Sci. 6, 78–99. [Google Scholar]
- 20. Kessenbrock K, Plaks V, Werb Z (2010) Matrix metalloproteinases: regulators of the tumor microenvironment. Cell 141, 52–67. [DOI] [PMC free article] [PubMed] [Google Scholar]
- 21. Bauvois B (2012) New facets of matrix metalloproteinases MMP‐2 and MMP‐9 as cell surface transducers: outside‐in signaling and relationship to tumor progression. Biochim. Biophys. Acta. 1825, 29–36. [DOI] [PubMed] [Google Scholar]
- 22. Kallakury BV, Karikehalli S, Haholu A, Sheehan CE, Azumi N, Ross JS (2001) Increased expression of matrix metalloproteinases 2 and 9 and tissue inhibitors of metalloproteinases 1 and 2 correlate with poor prognostic variables in renal cell carcinoma. Clin. Cancer Res. 7, 3113–3119. [PubMed] [Google Scholar]
- 23. Kondratiev S, Gnepp DR, Yakirevich E, Sabo E, Annino DJ, Rebeiz E et al (2008) Expression and prognostic role of MMP2, MMP9, MMP13, and MMP14 matrix metalloproteinases in sinonasal and oral malignant melanomas. Hum. Pathol. 39, 337–343. [DOI] [PubMed] [Google Scholar]
- 24. Diebold I, Petry A, Burger M, Hess J, Görlach A (2011) NOX4 mediates activation of FoxO3a and matrix metalloproteinase‐2 expression by urotensin‐II. Mol. Biol. Cell 22, 4424–4434. [DOI] [PMC free article] [PubMed] [Google Scholar]
- 25. Niu D‐F, Kondo T, Nakazawa T, Oishi N, Kawasaki T, Mochizuki K et al (2012) Transcription factor Runx2 is a regulator of epithelial‐mesenchymal transition and invasion in thyroid carcinomas. Lab. Invest. 92, 1181–1190. [DOI] [PubMed] [Google Scholar]
- 26. Takagi S, Simizu S, Osada H (2009) RECK negatively regulates matrix metalloproteinase‐9 transcription. Cancer Res. 69, 1502–1508. [DOI] [PubMed] [Google Scholar]
- 27. Cock‐Rada AM, Medjkane S, Janski N, Yousfi N, Perichon M, Chaussepied M et al (2012) SMYD3 promotes cancer invasion by epigenetic upregulation of the metalloproteinase MMP‐9. Cancer Res. 72, 810–820. [DOI] [PMC free article] [PubMed] [Google Scholar]
- 28. Chernov AV, Strongin AY (2011) Epigenetic regulation of matrix metalloproteinases and their collagen substrates in cancer. Biomol. Concepts 2, 135–147. [DOI] [PMC free article] [PubMed] [Google Scholar]
- 29. Cedar H, Bergman Y (2009) Linking DNA methylation and histone modification: patterns and paradigms. Nat. Rev. Genet. 10, 295–304. [DOI] [PubMed] [Google Scholar]
- 30. Ikegami K, Ohgane J, Tanaka S, Yagi S, Shiota K (2009) Interplay between DNA methylation, histone modification and chromatin remodeling in stem cells and during development. Int. J. Dev. Biol. 53, 203–214. [DOI] [PubMed] [Google Scholar]
- 31. Cameron EE, Bachman KE, Myöhänen S, Herman JG, Baylin SB (1999) Synergy of demethylation and histone deacetylase inhibition in the re‐expression of genes silenced in cancer. Nat. Genet. 21, 103–107. [DOI] [PubMed] [Google Scholar]
- 32. Doudkine A, Macaulay C, Poulin N, Palcic B (1995) Nuclear texture measurements in image cytometry. Pathologica 87, 286–299. [PubMed] [Google Scholar]
- 33. Giroud F, Gauvain C, Seigneurin D, Von Hagen V (1988) Chromatin texture changes related to proliferation and maturation in erythrocytes. Cytometry 9, 339–348. [DOI] [PubMed] [Google Scholar]
- 34. Poplineau M, Dufer J, Antonicelli F, Trussardi‐Regnier A (2011) Epigenetic regulation of proMMP‐1 expression in the HT1080 human fibrosarcoma cell line. Int. J. Oncol. 38, 1713–1718. [DOI] [PubMed] [Google Scholar]
- 35. Schnekenburger M, Grandjenette C, Ghelfi J, Karius T, Foliguet B, Dicato M et al (2011) Sustained exposure to the DNA demethylating agent, 2′‐deoxy‐5‐azacytidine, leads to apoptotic cell death in chronic myeloid leukemia by promoting differentiation, senescence, and autophagy. Biochem. Pharmacol. 81, 364–378. [DOI] [PubMed] [Google Scholar]
- 36. Schneider CA, Rasband WS, Eliceiri CW (2012) NIH Image to ImageJ: 25 years of image analysis. Nat. Meth. 9, 671–675. [DOI] [PMC free article] [PubMed] [Google Scholar]
- 37. Young IT (1977) Proof without prejudice: use of the Kolmogorov‐Smirnov test for the analysis of histograms from flow systems and other sources. J. Histochem. Cytochem. 25, 935–941. [DOI] [PubMed] [Google Scholar]
- 38. Bartels PH, Da Silva VD, Montironi R, Hamilton PW, Thompson D, Vaught L et al (1998) Chromatin texture signatures in nuclei from prostate lesions. Anal. Quant. Cytol. Histol. 20, 407–416. [PubMed] [Google Scholar]
- 39. Dufer J, Millot‐Broglio C, Oum'Hamed Z, Liautaud‐Roger F, Joly P, Desplaces A et al (1995) Nuclear DNA content and chromatin texture in multidrug‐resistant human leukemic cell lines. Int. J. Cancer 60, 108–114. [DOI] [PubMed] [Google Scholar]
- 40. Al‐Nachawati H (1984) Segmentation multidimensionnelle. Stat. Anal. Données 9, 1–30. [Google Scholar]
- 41. Nielsen B, Albregtsen F, Danielsen HE (2008) Statistical nuclear texture analysis in cancer research: a review of methods and applications. Crit. Rev. Oncog. 14, 89–164. [DOI] [PubMed] [Google Scholar]
- 42. Dunn JM, Hveem T, Pretorius M, Oukrif D, Nielsen B, Albregtsen F et al (2011) Comparison of nuclear texture analysis and image cytometric DNA analysis for the assessment of dysplasia in Barrett's oesophagus. Br. J. Cancer 105, 1218–1223. [DOI] [PMC free article] [PubMed] [Google Scholar]
- 43. Ferro DP, Falconi MA, Adam RL, Ortega MM, Lima CP, De Souza CA et al (2011) Fractal characteristics of May‐Grünwald‐Giemsa stained chromatin are independent prognostic factors for survival in multiple myeloma. PLoS ONE 6, e20706. [DOI] [PMC free article] [PubMed] [Google Scholar]
- 44. Bedin V, Adam RL, De Sá BC, Landman G, Metze K (2010) Fractal dimension of chromatin is an independent prognostic factor for survival in melanoma. BMC Cancer 10, 260. [DOI] [PMC free article] [PubMed] [Google Scholar]
- 45. Huisman A, Ploeger LS, Dullens HFJ, Poulin N, Grizzle WE, Van Diest PJ (2005) Development of 3D chromatin texture analysis using confocal laser scanning microscopy. Cell. Oncol. 27, 335–345. [DOI] [PMC free article] [PubMed] [Google Scholar]
- 46. Wax A, Chalut KJ (2011) Nuclear morphology measurements with angle‐resolved low coherence interferometry for application to cell biology and early cancer detection. Anal. Cell Pathol. (Amst) 34, 207–222. [DOI] [PMC free article] [PubMed] [Google Scholar]
- 47. Nandakumar V, Kelbauskas L, Johnson R, Meldrum D (2011) Quantitative characterization of preneoplastic progression using single‐cell computed tomography and three‐dimensional karyometry. Cytometry A 79, 25–34. [DOI] [PMC free article] [PubMed] [Google Scholar]
- 48. Colomb E, Dussert C, Martin PM (1991) Nuclear texture parameters as discriminant factors in cell cycle and drug sensitivity studies. Cytometry 12, 15–25. [DOI] [PubMed] [Google Scholar]
- 49. Poplineau M, Trussardi‐Régnier A, Happillon T, Dufer J, Manfait M, Bernard P et al (2011) Raman microspectroscopy detects epigenetic modifications in living Jurkat leukemic cells. Epigenomics 3, 785–794. [DOI] [PubMed] [Google Scholar]
- 50. Fudenberg G, Getz G, Meyerson M, Mirny LA (2011) High order chromatin architecture shapes the landscape of chromosomal alterations in cancer. Nat. Biotechnol. 29, 1109–1113. [DOI] [PMC free article] [PubMed] [Google Scholar]
- 51. Haaf T, Schmid M (2000) Experimental condensation inhibition in constitutive and facultative heterochromatin of mammalian chromosomes. Cytogenet. Cell Genet. 91, 113–123. [DOI] [PubMed] [Google Scholar]
- 52. Kerr E, Kiyuna T, Boyle S, Saito A, Thomas JSJ, Bickmore WA (2010) Changes in chromatin structure during processing of wax‐embedded tissue sections. Chromosome Res. 18, 677–688. [DOI] [PMC free article] [PubMed] [Google Scholar]
- 53. Berthe JV, Remmelink M, Werry J, Salmon I, Kiss R, Decaestecker C (2001) The contribution of image cytometry to the characterization of clinical subgroups of lipomas. Int. J. Oncol. 18, 1315–1321. [DOI] [PubMed] [Google Scholar]
- 54. Pauwels O, Kiss R (1994) Computerized morphonuclear analyses of Feulgen‐stained nuclei from 11 chemosensitive and from 11 chemoresistant neoplastic cell lines. Anal. Cell. Pathol. 7, 235–250. [PubMed] [Google Scholar]
- 55. Kotelnikov VM, Litinskaya LL (1981) Comparative studies of Feulgen hydrolysis for DNA. I. Influence of different fixatives and polyethylene glycols. Histochemistry 71, 145–153. [DOI] [PubMed] [Google Scholar]
- 56. Gaub J (1976) Feulgen‐Naphthol Yellow S cytophotometry of liver cells. The effect of formaldehyde induced shrinkage on nuclear Naphthol Yellow S binding. Histochemistry 49, 293–301. [DOI] [PubMed] [Google Scholar]
- 57. Patties I, Jahns J, Hildebrandt G, Kortmann R‐D, Glasow A (2009) Additive effects of 5‐aza‐2′‐deoxycytidine and irradiation on clonogenic survival of human medulloblastoma cell lines. Strahlenther. Onkol. 185, 331–338. [DOI] [PubMed] [Google Scholar]
- 58. Haaf T (1995) The effects of 5‐azacytidine and 5‐azadeoxycytidine on chromosome structure and function: implications for methylation‐associated cellular processes. Pharmacol. Ther. 65, 19–46. [DOI] [PubMed] [Google Scholar]
- 59. De Mello MR, Albuquerque DM, Pereira‐Cunha FG, Albanez KB, Pagnano KB, Costa FF et al (2012) Molecular characteristics and chromatin texture features in acute promyelocytic leukemia. Diagn. Pathol. 7, 75. [DOI] [PMC free article] [PubMed] [Google Scholar]
- 60. Kalac M, Scotto L, Marchi E, Amengual J, Seshan VE, Bhagat G et al (2011) HDAC inhibitors and decitabine are highly synergistic and associated with unique gene‐expression and epigenetic profiles in models of DLBCL. Blood 118, 5506–5516. [DOI] [PMC free article] [PubMed] [Google Scholar]
- 61. Watson JA, McKenna DJ, Maxwell P, Diamond J, Arthur K, McKelvey‐Martin VJ et al (2010) Hyperacetylation in prostate cancer induces cell cycle aberrations, chromatin reorganization and altered gene expression profiles. J. Cell Mol. Med. 14, 1668–1682. [DOI] [PMC free article] [PubMed] [Google Scholar]
- 62. Hannen EJ, Van der Laak JA, Manni JJ, Pahlplatz MM, Freihofer HP, Slootweg PJ et al (1998) An image analysis study on nuclear morphology in metastasized and non‐metastasized squamous cell carcinomas of the tongue. J. Pathol. 185, 175–183. [DOI] [PubMed] [Google Scholar]
- 63. Chik F, Szyf M (2011) Effects of specific DNMT gene depletion on cancer cell transformation and breast cancer cell invasion; toward selective DNMT inhibitors. Carcinogenesis 32, 224–232. [DOI] [PubMed] [Google Scholar]
- 64. Sato N, Maehara N, Su GH, Goggins M (2003) Effects of 5‐aza‐2′‐deoxycytidine on matrix metalloproteinase expression and pancreatic cancer cell invasiveness. J. Natl. Cancer Inst. 95, 327–330. [DOI] [PubMed] [Google Scholar]
- 65. Chicoine E, Estève P‐O, Robledo O, Van Themsche C, Potworowski EF, St‐Pierre Y (2002) Evidence for the role of promoter methylation in the regulation of MMP‐9 gene expression. Biochem. Biophys. Res. Commun. 297, 765–772. [DOI] [PubMed] [Google Scholar]
- 66. Couillard J, Demers M, Lavoie G, St‐Pierre Y (2006) The role of DNA hypomethylation in the control of stromelysin gene expression. Biochem. Biophys. Res. Commun. 342, 1233–1239. [DOI] [PubMed] [Google Scholar]
- 67. Hagemann S, Heil O, Lyko F, Brueckner B (2011) Azacytidine and decitabine induce gene‐specific and non‐random DNA demethylation in human cancer cell lines. PLoS ONE 6, e17388. [DOI] [PMC free article] [PubMed] [Google Scholar]
- 68. Ailenberg M, Silverman M (2003) Differential effects of trichostatin A on gelatinase A expression in 3T3 fibroblasts and HT‐1080 fibrosarcoma cells: implications for use of TSA in cancer therapy. Biochem. Biophys. Res. Commun. 302, 181–185. [DOI] [PubMed] [Google Scholar]
- 69. Lee KH, Choi EY, Kim MK, Kim KO, Jang BI, Kim SW et al (2010) Inhibition of histone deacetylase activity down‐regulates urokinase plasminogen activator and matrix metalloproteinase‐9 expression in gastric cancer. Mol. Cell. Biochem. 343, 163–171. [DOI] [PubMed] [Google Scholar]
- 70. Mitmaker EJ, Griff NJ, Grogan RH, Sarkar R, Kebebew E, Duh QY et al (2011) Modulation of matrix metalloproteinase activity in human thyroid cancer cell lines using demethylating agents and histone deacetylase inhibitors. Surgery 149, 504–511. [DOI] [PubMed] [Google Scholar]
- 71. Estella C, Herrer I, Atkinson SP, Quiñonero A, Martinez S, Pellicer A (2012) Inhibition of histone deacetylase activity in human endometrial stromal cells promotes extracellular matrix remodelling and limits embryo invasion. PLoS ONE 7, e30508. [DOI] [PMC free article] [PubMed] [Google Scholar]
- 72. Liu HB, Voso MT, Gumiero D, Duong J, McKendrick JJ, Dear AE (2009) The anti‐leukemic effect of a novel histone deacetylase inhibitor MCT‐1 and 5‐aza‐cytidine involves augmentation of Nur77 and inhibition of MMP‐9 expression. Int. J. Oncol. 34, 573–579. [PubMed] [Google Scholar]
- 73. Citri A, Pang ZP, Südhof TC, Wernig M, Malenka RC (2012) Comprehensive qPCR profiling of gene expression in single neuronal cells. Nat. Protoc. 7, 118–127. [DOI] [PMC free article] [PubMed] [Google Scholar]