

Abstract
Objectives: Previous studies have reported that fibroin peptides can be used in a new strategy for development of anti‐diabetic peptide drugs. In this study, we separated silk fibroin hydrolysates (SFH) containing silk fibroin peptides into four components according to their molecular weight and tested the effects of these together with three synthetic silk fibroin hexapeptides GAGAGS, GAGAGY, GAGAGA on cell proliferation of 3T3‐L1 preadipocytes. The aim of this study was to investigate protein expression profiles of 3T3‐L1 preadipocytes and those treated with SFH component Fraction I and the synthetic silk fibroin hexapeptide GAGAGS to be able to elucidate difference in protein expression between the 3T3‐L1 preadipocytes and those treated with fibroin peptides Fraction I and GAGAGS.
Materials and methods: SFH was separated by dialysis. MTT assays were performed to test effects of SFH components and synthetic silk fibroin hexapeptides on 3T3‐L1 preadipocyte proliferation. We generated proteome maps using two‐dimensional gel electrophoresis and analysed them by peptide mass fingerprinting.
Results: GAGAGS and peptide mixtures, Fraction I and Fraction II, had significant effect in promoting 3T3‐L1 preadipocyte proliferation. In the proteomic analysis, 73 protein spots were successfully identified, including 15 which were differentially expressed.
Conclusions: Our results show that some silk fibroin peptides of low molecular weight SFH and hexapeptide GAGAGS affected 3T3‐L1 preadipocyte proliferation.
Introduction
Silk fibroin (SF), a fibrous protein obtained from larvae of the domestic silk moth, Bombyx mori, consists of two chains – a heavy chain (H‐chain) and a light chain (L‐chain). The H‐chain contains 5263 amino acid residues (AA), composed of 45.9% Gly, 30.3% Ala, 12.1% Ser, 5.3% Tyr, 1.8% Val and 4.7% other 15 amino acid types. Most of amino acid residues of the H‐chain are constructed into low‐complexity crystalline domains made up of Gly‐X dipeptide repeats. Residue X is Ala in 64% of repeats, Ser in 22%, Tyr in 10% and Val in 3% of them. Three repetitive units Gly‐Ala‐Gly‐Ala‐Gly‐Ser (GAGAGS, 432 copies), Gly‐Ala‐Gly‐Ala‐Gly‐Tyr (GAGAGY, 120 copies) and Gly‐Ala‐Gly‐Ala‐Gly‐Ala (GAGAGA, 96 copies) together comprise 74% amino acid residues of the sequence. The L‐chain has 262 AA with 36 Ala, 25 Ser, 22 Gly, 21 Ile, 20 Leu and further 15 amino acid types less than 20 AA each. A single disulphide bond between Cys‐172 of the L‐chain and Cys‐c20 (twentieth residue from the C terminus) of the H‐chain links them (1). In addition, a glycoprotein, designated P25 containing 220 AA, associates with the H‐L complex primarily by hydrophobic interactions. The elementary unit of silk fibroin contains H‐chain, L‐chain and P25 in 6:6:1 molar ratio (2). Some biological effects of silk fibroin have been reported, such as preventing DNA damage (3), lowering blood cholesterol level in rats (4) and anti‐HIV activity (5).
Previous studies show that silk fibroin hydrolysates (SFH) have the ability of improving glucose tolerance in diabetic rats (6) and enhancing insulin sensitivity and glucose metabolism in 3T3‐L1 adipocytes (7). It has also been found that synthetic silk fibroin peptides GAGAGA, GAGAGS and GAGAGY have significant effects of enhancing glucose uptake in 3T3‐L1 adipocytes (8). Fibroin peptides such as peptide mixtures of hydrolysed fibroin or peptides derived from fibroin including GAGAGY, could be used as a new strategy for development of anti‐diabetic peptide drugs (8). Adipocytes can be differentiated from preadipocytes in vivo. Elucidating effects of SFH containing silk fibroin peptides on proliferation of 3T3‐L1 preadipocytes would contribute to explaining effects of these fibroin peptides in treatment of diabetes.
Proteomics provides a large‐scale and systematic overview of proteins expressed by a genome, which is different from study of a single protein or a pathway (9). Two‐dimensional gel electrophoresis (2‐DE) can separate denatured proteins according to their molecular weights and pH/pKa, which is useful for separating proteins of similar molecular weights (10). Goal protein spots can be stained, digested into peptides and analysed by peptide mass fingerprinting (PMF) with matrix‐assisted laser desorption/ionization time‐of‐flight mass spectrometry (MALDI‐TOF‐MS), which offers very high levels of sensitivity and mass accuracy, for detection and identification of proteins (11). In this study, we separated SFH into four components and tested their effects and those of three synthetic silk fibroin hexapeptides GAGAGS, GAGAGY and GAGAGA on proliferation of 3T3‐L1 preadipocytes. We used 2‐DE to establish proteomic patterns of 3T3‐L1 preadipocyte and those treated with SFH component Fraction I and synthetic silk fibroin peptide GAGAGS both having a significant effect in promoting proliferation of 3T3‐L1 preadipocytes. The differentially expressed proteins were identified by PMF with MALDI‐TOF‐MS and identified by western blot analysis and semiquantitative RT‐PCR. Our results may provide a preliminary insight into a global response of 3T3‐L1 preadipocytes treated with these silk fibroin peptides.
Materials and methods
Preparation of SFH components
Cocoons of the silkworm, B. mori, reared in our laboratory, were collected. Sericin was removed as described previously (7) with some modifications. Briefly, 50 g of cocoon material was cut into small pieces, boiled in 2.5 l of 5% Na2CO3 (that is, 50 g/l) twice for 0.5 h each and then centrifuged. Residues were washed three times in hot distilled H2O to remove any remaining sericin. Picrocarmine solution was used to detect that sericin removal was complete. The silk fibroin was then solubilized by heating 20 g of residue in solution containing 0.12 l of distilled water and 60 g (32.57 ml) of sulphuric acid at 100 °C for 0.5–3 h, and then cooled to 4 °C. Time for silk fibroin hydrolysis is determined according to the degree of hydrolysis (DH). DHs for preparing SFH with molecular weight less than 1000 Da (noted as Fraction I), between 1000 and 2000 Da (noted as Fraction II), between 2000 and 3500 Da (noted as Fraction III), and between 3500 and 5000 Da (noted as Fraction IV), were 17%, 6%, 3.3% and 2.5% respectively. Then, 73.5 g of calcium carbonate was added to precipitate sulphate ions. After leaching using a Brandt funnel, the SFH solution was obtained. This was then separated using dialysis bags according to the following procedure: For Fraction I, SFH solution was dialysed using a dialysis bag of molecular weight cut‐off 1000 (Jierui Co. Ltd, Shanghai, China) against distilled H2O for 24 h at 4 °C. Solution outside the membrane contained Fraction I and was lyophilized for the following assays. For Fractions II, III and IV, SFH solutions were respectively, dialysed with dialysis bags of molecular weight cut‐offs 1000, 2000 and 3500 Da at 4 °C against distilled H2O, for 3 days replacing dialysis buffer every half an hour to remove corresponding components of SFH with molecular weights less than 1000, 2000 and 3500 Da. Then solutions inside the membrane were respectively, dialysed with dialysis bags of molecular weight cut‐offs 2000, 3500 and 5000 Da against distilled H2O for 24 h at 4 °C. Solution outside the membrane containing Fraction II, III and IV was lyophilized for the following assays.
Determination of degree of hydrolysis
The formula deduced by Yao et al. (12) was used to calculate value of degree of hydrolysis (DH):  ×100%. DH value is equal to number of hydrolysed peptide bonds divided by number of peptide bonds in the substrate (h
tot). Value of h
tot was estimated as sum of millimoles of each individual amino acid per gram of protein (h
tot = 12.4 mmol/g) (13), this being found by determining amino acid composition of the protein substrate. Variable h was the amount of –COOH in SFH determined by formol titration as described by Yao (12).
×100%. DH value is equal to number of hydrolysed peptide bonds divided by number of peptide bonds in the substrate (h
tot). Value of h
tot was estimated as sum of millimoles of each individual amino acid per gram of protein (h
tot = 12.4 mmol/g) (13), this being found by determining amino acid composition of the protein substrate. Variable h was the amount of –COOH in SFH determined by formol titration as described by Yao (12).
Peptide synthesis
Peptides were synthesized using the Fmoc/tBu approach of solid‐phase peptide synthesis (SPPS) according to Amblard (14) and purified by reverse‐phase HPLC using a Capcell Pak C‐18 column and two‐solvent system, 0.1% trifluoroacetic acid (TFA)/H2O–0.1% TFA/acetonitrile, with a 15–70% gradient. Identity of each peptide was confirmed by mass analysis using LC/MS.
Cell culture and cell proliferation analysis
3T3‐L1 preadipocytes were grown in Dulbecco’s modified Eagle’s medium (DMEM) supplemented with 10% foetal bovine serum (FBS; Sijiqing, Hangzhou, China), 4.5 g/L d‐Glucose, 100 U/ml penicillin and 100 μg/ml streptomycin under 5% CO2. For analysis of cell proliferation, cells treated as indicated in the results were washed three times in phosphate‐buffered solution (PBS). A volume of 0.2 ml of MTT (1 mg/ml, Sigma, Hangzhou, China) was added and further incubated for 4 h at 37 °C. MTT solution was discarded by aspiration, and the resulting formazan product, converted by viable cells, was dissolved in 150 μm dimethylsulphoxide. Absorbance was read using an ELISA plate reader at 570 nm. Viability of cells was determined by trypan blue dye exclusion assay.
Two‐dimensional gel electrophoresis
3T3‐L1 preadipocytes in normal cell culture medium, 3T3‐L1 preadipocytes treated with Fraction I (3T3‐L1‐FI) and 3T3‐L1 preadipocytes treated with GAGAGS (3T3‐L1‐GAGAGS) as described in the results section, were harvested, washed three times in cold PBS, centrifuged at 1500 g for 10 min at 4 °C. Pellets were stored at −80 °C before protein lysis. Cells (5 × 10⁶) were dissolved in detergent lysis buffer containing 8 m urea, 2 m thiourea, 4% (w/v) 3‐[(3‐Cholamidopropyl)dimethyl‐ammonio]‐1‐propanesulphonate (CHAPS), 0.5% (v/v) Triton X‐100, 0.5% (v/v) immobilization pH gradient (IPG) buffer, pH 3–10 (Amersham Biosciences, Shanghai, China), 100 mm dithriothreitol and 1.5 mg/mL complete protease inhibitor (Roche, Shanghai, China) for 1 h at 18 °C in an orbital shaker. Lysates were then centrifuged at 21 000 g for 30 min and protein content in the supernatant was measured using the Bradford assay (15). Protein extracts were separated by 2‐DE, according to methods described previously, with some modifications (16). Briefly, for isoelectric focusing (first dimension), 400 μg of protein lysate was run in 6 m urea, 2 m thiourea, 1 m dithriothreitol, 2% (w/v) CHAPS and 0.5% (v/v) IPG buffer on 17‐cm pH 3–10 gradient IPG strips in IPGphor apparatus (Amersham Biosciences) using the following protocol: after 12 h re‐swelling time at 30 V, voltages of 200, 500 and 1000 V were applied for 1 h each. Then, voltage was increased to 8000 V within 30 min and kept constant at 8000 V for another 12 h, resulting in total of 100 300 Vh. For subsequent sodium dodecyl sulphate‐polyacrylamide gel electrophoresis (SDS–PAGE; second dimension), proteins were transferred to 20 × 18 × 0.4 cm3 polyacrylamide gels and were separated by mass in 12.5% acrylamide matrix. Protein spots in three different experiments (replicate gels) were visualized by silver staining and were scanned using an image scanner (GS‐800 calibrated densitometry; Bio‐Rad, Hercules, CA, USA). Software of PD‐Quest 7.2 (Bio‐Rad) was employed for image analysis, including background subtraction, spot detection, volume normalization and matching. A reference gel containing all spots detected on any gel was established. Average gels were matched to the reference gel, and average gels derived from 3T3‐L1‐FI, 3T3‐L1‐GAGAGS and 3T3‐L1 preadipocytes were compared. For each protein spot, significant differences were assessed via unpaired Student’s t‐tests using spss 12.0 for Windows (SPSS Inc., Chicago, IL, USA). Thresholds were defined as a significant change in spot volume being at least 2‐fold or the P‐value <0.05. Differentially expressed protein spots were selected for further identification by matrix‐assisted laser desorption/ionization time‐of‐flight mass spectrometry (MALDI‐TOF‐MS).
Protein identification by mass spectrometry
Protein identification was achieved by PMF using MALDI‐TOF‐MS and gel matching via polynomial image warping. For MALDI‐TOF‐MS, protein spots were automatically located, excised and destained, and in‐gel digestion with trypsin (Promega, Shanghai, China) was employed. Samples were prepared using α‐cyano‐4‐hydroxy‐cinnamic acid as matrix, loaded on to pre‐spotted AnchorChip targets and were allowed to air dry at room temperature. Peptide mass spectra were obtained using Ultraflex TOF/TOF (Bruker Daltonics, Beijing, China) in fully automated reflectron TOF operation mode controlled by FlexControl software (Bruker Daltonics, Billerica, MA, USA). Parameters of MALDI‐TOF were set up as follows: 20 kV accelerating voltage, 65% grid voltage, 100–120 ns delay time, and acquisition mass range 900–3500 Da. Spectra were accumulated from 100 laser shots and were internally calibrated using autolytic fragments of trypsin. Obtained PMF were searched in the Swiss‐Prot database using Mascot software (http://www.matrixscience.com) with following parameters: taxonomy selected as Mus musculus (mouse); mass tolerance ±75 ppm; missed cleavage sites allowed up to 1; fixed modification selected as carbamidomethylation (cysteine) and variable modification selected as oxidation (methionine). Probability scores calculated by the software were used as criteria for correct identification. Three analytical gels were performed for each group.
Semiquantitative reverse transcriptase‐polymerase chain reaction
Total RNA was isolated from 3T3‐L1, 3T3‐L1‐FI and 3T3‐L1‐GAGAGS using TRIzol reagent (Invitrogen Life Technologies, Beijing, China). First‐strand cDNA was generated using superscript first‐strand synthesis system (Invitrogen Life Technologies) according to the manufacturer’s protocol. Polymerase chain reaction (PCR) was performed using 1 μl of total cDNA mixed with 1× PCR buffer, 1.5 μm MgCl2, 0.2 μm deoxynucleoside triphosphate (dNTP) and 1 μm of one of the following gene‐specific oligonucleotide primer pairs: PCNA, forward primer: 5′‐CGG GCG CAG AGG GTT GGT AG‐3′ and reverse primer: 5′‐TGC TCT GCA GGT TCA CGC CG‐3′; Actb, forward primer: 5′‐GCA GCT CCT TCG TTG CCG GT‐3′ and reverse primer: 5′‐TAC AGC CCG GGG AGC ATC GT‐3′; Tuba1a, forward primer: 5′‐AGC CGC GAA GCA GCA ACC AT‐3′ and reverse primer: 5′‐CCA CGG TAC AGC AGG CAG CA‐3′; MCM7, forward primer 5′‐CTG GCT GAC CAG GGC GTG TG‐3′ and reverse primer: 5′‐GCT GCC TGG AAC TGG GCT GG‐3′; hnRNP A3, forward primer: 5′‐ATG GGC GTG TGG TGG AAC CG‐3′ and reverse primer: 5′‐GCC ACC ACC ATA GGG ACT GCC‐3′; Rab33b, forward primer: 5′‐GGC GAC TCG AAC GTG GGC AA‐3′ and reverse primer: 5′‐GTG GGC ACC TGA ATG GCG CT‐3′; Rab11b, forward primer: 5′‐GCG CCA GGA CAA TGG GGA CC‐3′ and reverse primer: 5′‐CAG TGG GCA CAG CCC GAA GG‐3′; Aebp1, forward primer: 5′‐CCA CGT TCC TCG CGC CCT TT‐3′ and reverse primer: 5′‐ATT TGC GGG GAC GCT GGG TG‐3′; TCP‐1‐zeta, forward primer: 5′‐CCA GTG TGA AGG GCA GGG CG‐3′ and reverse primer: 5′‐ACC CAT CTC TGC GGC CAC CA‐3′. GAPDH, forward primer: 5′‐TCT GAC GTG CCG CCT GGA GA‐3′ and reverse primer: 5′‐GGG GTG GGT GGT CCA GGG TT‐3′. PCR amplifications were performed under the following conditions: after 5 min denaturation at 94 °C, 28 cycles of denaturation at 95 °C (30 s), annealing at 59 °C (PCNA, 40 s), 56 °C (Actb, 45 s), 57 °C (Tuba1a, 45 s), 58 °C (MCM7, 40 s), 57 °C (hnRNP A3, 45 s); 58 °C (Rab33b, 45 s), 59 °C (Rab11b, 40 s), 58 °C (Aebp1, 40 s), 59 °C (TCP‐1‐zeta, 45 s), 58 °C (GAPDH, 40 s), and primer extension at 72 °C (90 s). A final extension was carried out for 5 min and stopped at 4 °C. PCR products were visualized after electrophoresis on 1.5% agarose gel and ethidium bromide staining. The expected product sizes were 250 bp (PCNA), 132 bp (Actb), 980 bp (Tuba1a), 785 bp (MCM7), 791 bp (hnRNP A3), 362 bp (Rab33b), 420 bp (Rab11b), 310 bp (Aebp1), 200 bp (TCP‐1‐zeta) and 299 bp (GAPDH). Intensity of the bands was determined using AlphaEase software (Alpha Innotech, Beijing, China) and normalized to the band intensity of GAPDH. Each experiment was repeated three times.
Western blot analysis
Western blot analysis was performed to measure protein expression of PCNA, Actb, Tuba1a, MCM7, hnRNP A3, Rab33b, Rab11b, Aebp1 and TCP‐1‐zeta. Cells were washed twice in PBS and proteins were obtained using NE‐PER Nuclear and Cytoplasmic Extraction Reagents (Pierce, Beijing, China). Fifty micrograms of protein extract was separated on 12.5% SDS–PAGE and were transferred on to nitrocellulose membranes. Rabbit anti‐PCNA (Jinmei Biotech, Hangzhou, China), rabbit anti‐Actb, rabbit anti‐Tuba1a (Sigma), goat anti‐MCM7 (Majorbio, Shanghai, China), goat anti‐hnRNP A3, rabbit anti‐Rab33b, goat anti‐Rab11b, goat anti‐Aebp1, goat anti‐TCP‐1‐zeta and goat anti‐GAPDH (Santa Cruz, CA, USA) were used as primary antibodies. Horseradish peroxidase‐conjugated secondary antibodies were purchased from Amersham Pharmacia Biotech (Hong Kong, China). Anti‐GAPDH monoclonal antibody was purchased from Sigma. Proteins were visualized by means of enhanced chemiluminescence (Sigma). Intensity of bands was determined using AlphaEase software (Alpha Innotech) and was normalized to band intensity of anti‐GAPDH, and semiquantitatively analysed using software package imagemaster software (GE Healthcare Biosciences, Uppsala, Sweden). Each experiment was repeated three times.
Statistical analysis
Statistical significance between groups was determined using mean ± SD, and statistical comparisons were performed using unpaired Student’s t‐test. A level of P < 0.05 was considered significant.
Results
Effects of SFH components and synthetic silk fibroin hexapeptides on proliferation of 3T3‐L1 preadipocytes
To test effects of SFH components including Fractions I, II, III, IV and synthetic silk fibroin hexapeptides GAGAGS, GAGAGY and GAGAGA on proliferation of preadipocytes, the SFH components and hexapeptides were added to culture medium to treat the cells at concentrations of 0.5, 5, 50 g/l for each. Figure 1a shows absorbance of MTT assay product reflecting cell viability, day 8 after treatment. The results show that Fraction I, Fraction II and GAGAGS had a significant effect on improving the cell proliferation (P < 0.01, compared to normal cell culture medium as control). Fraction III only at concentration of 5 g/l had any significant effect on improvement of cell proliferation (P < 0.05, compared to normal culture medium as control). For Fraction I, Fraction II and GAGAGS, 5 g/l was the most efficient concentration compared to 0.5 and 50 g/l to promote proliferation. Then, we used SFH components and synthetic hexapeptides at concentration of 5 g/l to treat 3T3‐L1 preadipocytes to obtain their population growth curves (Fig. 1b). Results show that GAGAGS, Fraction I and Fraction II show increases in growth rates of 74.7%, 51.2%, 46.3%, respectively, over controls on day 8 after treatment.
Figure 1.
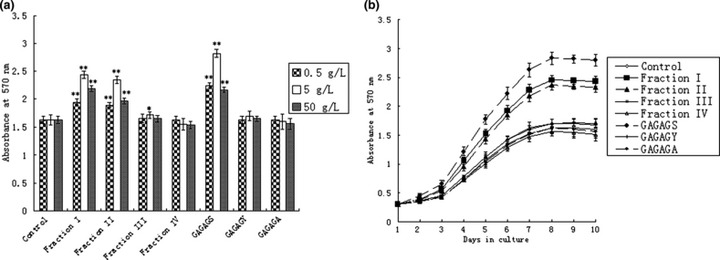
Effects of SFH components and silk fibroin hexapeptides on cell proliferation of 3T3‐L1 preadipocytes in vitro. (a) Effects of SFH components and silk fibroin hexapeptides with different concentration on cell proliferation of 3T3‐L1 preadipocytes in vitro. Cell viability was evaluated by MTT assays at Day 8 after treatment (mean ± SD, n = 9, measured at A570, *P < 0.05, **P < 0.01, compared with normal cell culture medium as a control). (b) Cell growth curves of 3T3‐L1 preadipocytes treated with SFH components including Fraction I, Fraction II, Fraction III, Fraction IV and silk fibroin hexapeptides including GAGAGS, GAGAGY, GAGAGA at the concentration of 5 g/l. Cell viability was evaluated by MTT assays (mean ± SD, n = 9, measured at A570). The results showed Fraction I, Fraction II and hexapeptide GAGAGS have significant effects of promoting cell proliferation on 3T3‐L1 preadipocytes (P < 0.01, compared with normal cell culture medium as a control).
Comparison of protein expression profiles between 3T3‐L1 preadipocytes and those treated with Fraction I and GAGAGS
Fraction I and synthetic silk fibroin hexapeptide GAGAGS were used as stimuli to treat 3T3‐L1 preadipocytes as they both had significant effect in promoting proliferation of 3T3‐L1 preadipocytes (Fig. 1). Then a comparison of protein expression profiles between 3T3‐L1 preadipocytes and those treated with Fraction I and GAGAGS was made by 2‐DE analysis and PMF using MALDI‐TOF‐MS. In the first dimension of 2‐DE analysis, pH interval of 3–10 for IPG strips was used. After three procedure cycles, three pieces of two‐dimensional gels were obtained, respectively, from 3T3‐L1 preadipocytes and those treated with Fraction I and GAGAGS. Images of silver‐stained two‐dimensional gels were photographed by GS‐800 calibrated densitometry and were analysed using PD‐Quest software. Matching analysis showed that matching ratios of these gel images reached 91.2% for 3T3‐L1 preadipocytes, 89.1% for 3T3‐L1 preadipocytes treated with Fraction I (3T3‐L1‐FI) and 90.4% for 3T3‐L1 preadipocytes treated with GAGAGS (3T3‐L1‐GAGAGS), which indicated perfect reproducibility of these images. A representative 2‐DE map for 3T3‐L1‐FI is shown in Fig. 2. According to analysis of 2‐DE analytical gels after automatic spot detection, background subtraction and volume normalization, 1321 ± 133 protein spots in gels of 3T3‐L1 preadipocytes, 1516 ± 112 protein spots in gels of 3T3‐L1‐FI and 1328 ± 121 protein spots in gels of 3T3‐L1‐GAGAGS were detected.
Figure 2.
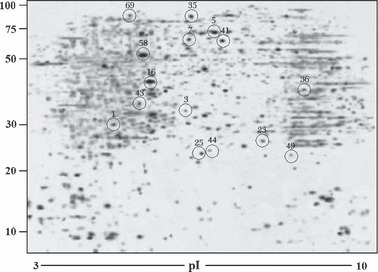
A representative 2‐DE protein profile from 3T3‐L1‐FI at Day 8 after treatment with the silk peptide mixture Fraction I. Proteins were separated on the basis of isoelectric point (X‐axis) and molecular mass (Y‐axis) and visualized by silver staining. Fifteen spots of differentially expressed proteins were identified and marked with circles. The numbers on the circles represent the protein spot numbers listed in 1, 2.
Protein identification by peptide mass fingerprinting analysis
According to comparison of protein profiles from 3T3‐L1 preadipocytes, 3T3‐L1‐FI and 3T3‐L1‐GAGAGS using PD‐Quest two‐dimensional software, we identified 73 including 15 differentially expressed protein spots by PMF, using MALDI‐TOF‐MS. Subsequent bioinformatics data were searched in the National Center for Biotechnology Information (NCBI) database using Mascot software (Matrix Science, London, UK) to identify the proteins. All 73 identified proteins are listed in Table 1. Only Mascot database query results that were statistically significant at the 5% level were considered. Three analytical gels were run for each group. Of spots analysed, thirteen protein spots showed up‐regulation in 3T3‐L1‐FI and 3T3‐L1‐GAGAGS compared with those in 3T3‐L1 preadipocytes treated with normal cell culture medium as a control (P < 0.05 or P < 0.01). These up‐regulated proteins were proliferating cell nuclear antigen (PCNA); lamin a (Lmna); seryl‐tRNA synthetase (Sars); actin, cytoplasmic 1 (Actb); Ras‐related protein Rab‐33B (Rab33b); Ras‐related protein Rab‐11B (Rab11b); DNA replication licensing factor MCM7 (MCM7); heterogeneous nuclear ribonucleoprotein A3 (hnRNP A3); T‐complex protein 1 subunit zeta (TCP‐1‐zeta); 40S ribosomal protein SA (Rpsa); PTB‐containing, cubilin and LRP1‐interacting protein (P‐CLI1); tubulin alpha‐1A chain (Tuba1a); and adipocyte enhancer‐binding protein 1, isoform 2 (Aebp1). Two protein spots showed down‐regulation (P < 0.05 or P < 0.01). These proteins were purine nucleoside phosphorylase (PNP) and glutathione S‐transferase P 1 (Gst P1). The 15 differentially expressed proteins are listed in Table 2 and their compared 2‐DE protein spots are shown in Fig. 3. These 15 differentially expressed proteins were involved as structural proteins, DNA replication, protein biosynthesis, protein folding, protein transport, protein binding, translation, transcription and GTP biosynthetic process in 3T3‐L1 preadipocytes.
Table 1.
List of protein spots identified by MALDI‐TOF‐MS in 3T3‐L1 preadipocytes treated with Fraction I and the silk fibroin hexapeptide GAGAGS
| Spot number | NCBI Entrez protein annotation | NCBI Entrez protein accession | Score | Molecular weight (Da) | Isoelectric point (pI) | Peptides matched | Peptides obtained | Sequence coverage (%) | Swiss‐prot protein accession |
|---|---|---|---|---|---|---|---|---|---|
| 1 | Proliferating cell nuclear antigen | gi|129695 | 157 | 29 108 | 4.66 | 15 | 20 | 32 | P17918 |
| 2 | Choline‐phosphate cytidylyltransferase A | gi|1345856 | 132 | 42 040 | 6.58 | 7 | 12 | 21 | P49586 |
| 3 | Purine nucleoside phosphorylase | gi|1346738 | 169 | 32 538 | 5.93 | 13 | 18 | 38 | P23492 |
| 4 | Lactoylglutathione lyase | gi|21362640 | 112 | 20 836 | 5.25 | 11 | 16 | 31 | Q9CPU0 |
| 5 | Lamin A | gi|85700428 | 213 | 74 450 | 6.54 | 10 | 18 | 31 | P48678 |
| 6 | Regulator of G‐protein signalling 16 | gi|2500171 | 138 | 22 905 | 7.05 | 10 | 16 | 30 | P97428 |
| 7 | Seryl‐tRNA synthetase | gi|18266844 | 185 | 58 734 | 5.95 | 14 | 20 | 32 | P26638 |
| 8 | Transaldolase | gi|2851596 | 206 | 37 534 | 6.57 | 9 | 16 | 25 | Q93092 |
| 9 | Malate dehydrogenase, cytoplasmic | gi|92087001 | 127 | 36 494 | 6.16 | 11 | 18 | 37 | P14152 |
| 10 | Transketolase | gi|730956 | 223 | 68 272 | 7.23 | 8 | 18 | 22 | P40142 |
| 11 | Peroxiredoxin‐2 | gi|2499469 | 87 | 21 936 | 5.2 | 9 | 12 | 35 | Q61171 |
| 12 | 60 kDa heat shock protein, mitochondrial | gi|51702252 | 154 | 61 088 | 5.91 | 8 | 18 | 32 | P63038 |
| 13 | Alpha enolase | gi|13637776 | 129 | 47 322 | 6.36 | 12 | 16 | 43 | P17182 |
| 14 | Aconitate hydratase, mitochondrial | gi|60391212 | 198 | 86 151 | 8.08 | 13 | 20 | 19 | Q99KI0 |
| 15 | 78 kDa glucose‐regulated protein | gi|2506545 | 175 | 72 492 | 5.07 | 14 | 21 | 28 | P20029 |
| 16 | Actin, cytoplasmic 1 | gi|46397334 | 167 | 42 052 | 5.29 | 9 | 15 | 25 | P60710 |
| 17 | Calreticulin | gi|117502 | 176 | 48 136 | 4.33 | 10 | 18 | 24 | P14211 |
| 18 | Carbonic anhydrase II | gi|146345383 | 98 | 29 056 | 6.52 | 7 | 14 | 32 | P00920 |
| 19 | Aspartyl‐tRNA synthetase | gi|21264011 | 158 | 57 537 | 6.07 | 9 | 14 | 20 | Q922B2 |
| 20 | 14‐3‐3 protein zeta/delta/, Protein kinase C, inhibitor protein 1 | gi|52000885 | 150 | 28 456 | 4.8 | 13 | 19 | 28 | P63101 |
| 21 | Peroxiredoxin 6 | gi|3219774 | 135 | 24 794 | 6.01 | 16 | 24 | 44 | O08709 |
| 22 | Peroxiredoxin 5, mitochondrial | gi|20138819 | 126 | 22 491 | 8.94 | 9 | 14 | 25 | Q9R063 |
| 23 | Ras‐related protein Rab‐33B | gi|14916646 | 167 | 26 206 | 7.62 | 12 | 18 | 27 | O35963 |
| 24 | Solute carrier family 2 (facilitated glucose transporter), member 4, GLUT‐4 | gi|17380401 | 136 | 54 783 | 8.28 | 17 | 24 | 41 | P14142 |
| 25 | Ras‐related protein Rab‐11B | gi|1172815 | 159 | 24 492 | 6.12 | 8 | 12 | 25 | P46638 |
| 26 | Dihydrolipoyllysine‐residue cetyltransferase component of pyruvate dehydrogenase | gi|146325018 | 118 | 68 469 | 8.81 | 16 | 21 | 30 | Q8BMF4 |
| 27 | Hydroxymethylglutaryl‐CoA synthase | gi|61213707 | 174 | 58 160 | 5.65 | 12 | 17 | 28 | Q8JZK9 |
| 28 | Alcohol dehydrogenase [NADP+] | gi|22653628 | 113 | 36 661 | 6.87 | 8 | 21 | 27 | Q9JII6 |
| 29 | Guanine nucleotide‐binding protein beta subunit 2‐like 1 | gi|54037181 | 93 | 35 511 | 7.6 | 14 | 18 | 41 | P68040 |
| 30 | Glutathione S‐transferase Mu 1 | gi|121716 | 183 | 25 936 | 8.13 | 15 | 19 | 35 | P10649 |
| 31 | Heat shock cognate 71 kDa protein | gi|51702275 | 129 | 71 055 | 5.37 | 14 | 21 | 33 | P63017 |
| 32 | 14−3−3 protein tau | gi|68566157 | 136 | 28 046 | 4.69 | 17 | 18 | 41 | P68254 |
| 33 | Carbonic anhydrase I | gi|1345656 | 159 | 28 229 | 6.47 | 9 | 12 | 47 | P13634 |
| 34 | Delta‐aminolevulinic acid dehydratase | gi|122834 | 193 | 36 456 | 6.32 | 9 | 24 | 24 | P10518 |
| 35 | DNA replication licensing factor MCM7 | gi|2497827 | 204 | 81 787 | 5.98 | 16 | 22 | 28 | Q61881 |
| 36 | Heterogeneous nuclear ribonucleoprotein A3 | gi|30316201 | 97 | 37 291 | 8.46 | 8 | 15 | 30 | Q8BG05 |
| 37 | L‐lactate dehydrogenase A chain | gi|126048 | 137 | 36 686 | 7.77 | 7 | 14 | 33 | P06151 |
| 38 | Proteasome activator complex subunit 1 | gi|17380256 | 148 | 28 826 | 5.73 | 18 | 23 | 40 | P97371 |
| 39 | Complement component 1, Q subcomponent binding protein, mitochondrial | gi|3334247 | 148 | 31 336 | 4.82 | 8 | 16 | 20 | O35658 |
| 40 | Chloride intracellular channel protein 1 | gi|6685328 | 101 | 27 207 | 5.09 | 9 | 16 | 34 | Q9Z1Q5 |
| 41 | T‐complex protein 1 subunit zeta | gi|549061 | 112 | 57 873 | 6.67 | 10 | 18 | 24 | P80317 |
| 42 | Transcription initiation factor TFIID subunit 8 | gi|81881848 | 180 | 33 857 | 6.04 | 11 | 22 | 35 | Q9EQH4 |
| 43 | 40S ribosomal protein SA | gi|224994260 | 187 | 32 838 | 4.8 | 13 | 22 | 37 | P14206 |
| 44 | PTB‐containing, cubilin and LRP1‐interacting protein | gi|74713284 | 190 | 24 784 | 6.49 | 9 | 14 | 32 | Q3UBG2 |
| 45 | Proto‐oncogene tyrosine‐protein kinase Yes | gi|417233 | 210 | 60 499 | 6.23 | 8 | 18 | 25 | Q04736 |
| 46 | Protein Wnt‐5b | gi|14424475 | 187 | 38 591 | 8.74 | 10 | 18 | 33 | P22726 |
| 47 | Protein Wnt‐5a | gi|212276479 | 158 | 35 797 | 8.79 | 12 | 18 | 38 | P22725 |
| 48 | Protein tyrosine phosphatase non‐receptor type 1 | gi|755043 | 178 | 49 593 | 5.78 | 11 | 24 | 30 | P35821 |
| 49 | Glutathione S‐transferase P 1 | gi|121747 | 143 | 23 478 | 8.13 | 7 | 10 | 32 | P19157 |
| 50 | Peroxisome proliferator‐activated receptor gamma coactivator 1‐alpha | gi|6679433 | 154 | 90 588 | 6.09 | 15 | 23 | 24 | O70343 |
| 51 | Peroxisome proliferator‐activated receptor delta | gi|452114 | 156 | 49 715 | 6.58 | 12 | 24 | 31 | P35396 |
| 52 | Patatin‐like phospholipase domain‐containing protein 2 | gi|81896337 | 153 | 53 657 | 6.06 | 12 | 24 | 28 | Q8BJ56 |
| 53 | Patatin‐like phospholipase domain containing 8 | gi|118130807 | 158 | 87 381 | 9.31 | 17 | 21 | 27 | Q8K1N1 |
| 54 | Nuclear receptor subfamily 4 group A member 1 | gi|128911 | 103 | 64 738 | 6.75 | 9 | 15 | 19 | P12813 |
| 55 | Neutral amino acid transporter ASCT2 | gi|81881881 | 133 | 58 423 | 6.82 | 8 | 18 | 25 | Q9ESU7 |
| 56 | NADPH oxidase 4 | gi|81881891 | 160 | 66 519 | 8.96 | 12 | 17 | 26 | Q9JHI8 |
| 57 | Group VI phospholipase A2 | gi|8393978 | 99 | 83 702 | 6.77 | 15 | 25 | 27 | P97819 |
| 58 | Tubulin alpha‐1A chain | gi|55977479 | 156 | 50 136 | 4.94 | 10 | 24 | 32 | P68369 |
| 59 | Fat cell‐specific low molecular weight protein alpha | gi|19071804 | 112 | 14 170 | 6.81 | 6 | 11 | 34 | Q9D159 |
| 60 | Delta‐like 1 homologue precursor | gi|83816918 | 136 | 41 316 | 5.59 | 14 | 20 | 31 | Q925U3 |
| 61 | Dapper 1 | gi|24158474 | 196 | 84 306 | 9.33 | 10 | 17 | 25 | Q8R4A3 |
| 62 | CCAAT/enhancer‐binding protein delta | gi|160332351 | 136 | 28 631 | 6.85 | 10 | 18 | 32 | Q00322 |
| 63 | CCAAT/enhancer‐binding protein alpha | gi|86198301 | 156 | 37 430 | 7.25 | 9 | 13 | 30 | P53566 |
| 64 | cAMP‐specific 3′,5′‐cyclic phosphodiesterase 4D | gi|57015302 | 219 | 84 563 | 4.79 | 12 | 15 | 23 | Q01063 |
| 65 | cAMP‐specific 3′,5′‐cyclic phosphodiesterase 4A | gi|23396489 | 194 | 93 558 | 5.11 | 16 | 25 | 25 | O89084 |
| 66 | C5a anaphylatoxin chemotactic receptor C5L2 | gi|225579146 | 215 | 38 199 | 6.72 | 11 | 19 | 25 | Q8BW93 |
| 67 | Autophagy‐related protein 7 | gi|22550098 | 230 | 77 520 | 5.97 | 18 | 25 | 34 | Q9D906 |
| 68 | Arachidonate lipoxygenase 3 | gi|226874908 | 106 | 80 473 | 6.35 | 14 | 19 | 32 | B1ASX3 |
| 69 | Adipocyte enhancer‐binding protein 1, isoform 2 | gi|607132 | 123 | 84 983 | 4.74 | 18 | 23 | 21 | Q640N1 |
| 70 | Acyl‐CoA desaturase 2 | gi|113135 | 197 | 41 073 | 9.14 | 12 | 24 | 29 | P13011 |
| 71 | 5′‐AMP‐activated protein kinase subunit gamma‐2 | gi|81879584 | 169 | 62 997 | 9.39 | 8 | 16 | 18 | Q91WG5 |
| 72 | Preadipocyte factor 1 | gi|1169354 | 189 | 38 907 | 5.41 | 15 | 20 | 35 | Q09163 |
| 73 | Acyl‐CoA desaturase 1 | gi|21431735 | 187 | 41 046 | 9.16 | 13 | 20 | 28 | P13516 |
Table 2.
Search results of differently expressed proteins in 3T3‐L1 preadipocytes treated with Fraction I and the silk fibroin hexapeptide GAGAGS in comparison with 3T3‐L1 preadipocytes treated with normal cell culture medium as a control
| Spot number | NCBI Entrez protein annotation | Density volume (3T3‐L1) | Density volume (3T3‐L1‐FI) | Density volume (3T3‐L1‐GAGAGS) | Expression in 3T3‐L1‐FI and 3T3‐L1‐GAGAGS compared with 3T3‐L1 | P‐value | Molecular weight (Da) | Isoelectric point (pI) | Type |
|---|---|---|---|---|---|---|---|---|---|
| 1 | Proliferating cell nuclear antigen (PCNA) | 249 ± 50 | 814 ± 77 | 1512 ± 66 | Up‐regulated | <0.01 | 29 108 | 4.66 | DNA replication |
| 5 | Lamin A (Lmna) | 561 ± 43 | 1563 ± 106 | 3123 ± 157 | Up‐regulated | <0.01 | 74 450 | 6.54 | Structural protein |
| 7 | Seryl‐tRNA synthetase (Sars) | 352 ± 42 | 1021 ± 143 | 1756 ± 112 | Up‐regulated | <0.01 | 58 734 | 5.95 | Protein biosynthesis |
| 16 | Actin, cytoplasmic 1 (Actb) | 581 ± 19 | 1864 ± 114 | 2768 ± 127 | Up‐regulated | <0.01 | 42 052 | 5.29 | Structural protein |
| 23 | Ras‐related protein Rab‐33B (Rab33b) | 314 ± 88 | 861 ± 51 | 937 ± 48 | Up‐regulated | <0.01 | 26 206 | 7.62 | Protein transport |
| 25 | Ras‐related protein Rab‐11B (Rab11b) | 365 ± 63 | 922 ± 65 | 956 ± 58 | Up‐regulated | <0.05 | 24 492 | 6.12 | Protein transport |
| 35 | DNA replication licensing factor MCM7 (MCM7) | 346 ± 33 | 1296 ± 105 | 1294 ± 153 | Up‐regulated | <0.01 | 81 787 | 5.98 | DNA replication |
| 36 | Heterogeneous nuclear ribonucleoprotein A3 (hnRNP A3) | 254 ± 44 | 699 ± 46 | 1284 ± 71 | Up‐regulated | <0.01 | 37 291 | 8.46 | DNA replication |
| 41 | T‐complex protein 1 subunit zeta (TCP‐1‐zeta) | 334 ± 26 | 1275 ± 38 | 896 ± 45 | Up‐regulated | <0.01 | 57 873 | 6.67 | Protein folding |
| 43 | 40S ribosomal protein SA (Rpsa) | 303 ± 54 | 841 ± 41 | 1218 ± 322 | Up‐regulated | <0.01 | 32 838 | 4.8 | Translation |
| 44 | PTB‐containing, cubilin and LRP1‐interacting protein (P‐CLI1) | 244 ± 37 | 635 ± 74 | 643 ± 32 | Up‐regulated | <0.05 | 24 784 | 6.49 | Protein binding |
| 58 | Tubulin alpha‐1A chain (Tuba1a) | 936 ± 70 | 2762 ± 192 | 2663 ± 143 | Up‐regulated | <0.01 | 50 136 | 4.94 | Structural protein |
| 69 | Adipocyte enhancer‐binding protein 1, isoform 2 (Aebp1) | 375 ± 35 | 987 ± 55 | 1895 ± 62 | Up‐regulated | <0.01 | 84 983 | 4.74 | Transcription |
| 3 | Purine nucleoside phosphorylase (PNP) | 874 ± 27 | 276 ± 24 | 291 ± 38 | Down‐regulated | <0.01 | 32 538 | 5.93 | GTP biosynthetic process |
| 49 | Glutathione S‐transferase P 1 (Gst P1) | 975 ± 22 | 255 ± 29 | 296 ± 27 | Down‐regulated | <0.01 | 23 478 | 8.13 | Protein binding |
3T3‐L1, 3T3‐L1 preadipocytes treated with normal cell culture medium; 3T3‐L1‐FI, 3T3‐L1 preadipocytes treated with Fraction I; 3T3‐L1‐GAGAGS, 3T3‐L1 preadipocytes treated with the hexapeptide GAGAGS.
Figure 3.
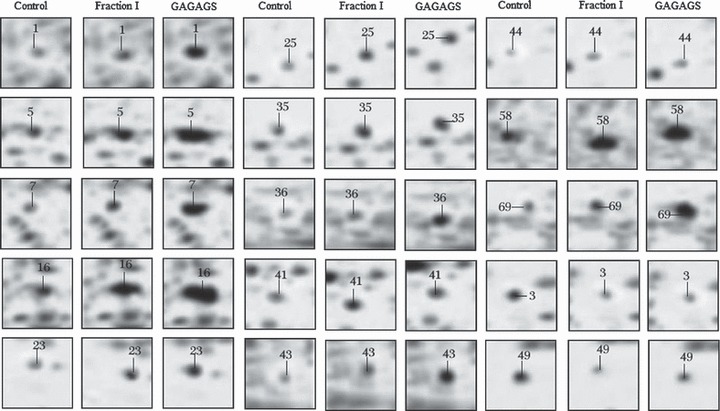
Representative 2‐DE protein spots. Representative 2‐DE protein spots from 3T3‐L1 preadipocytes (control), 3T3‐L1‐FI, and 3T3‐L1‐GAGAGS analysed at Day 8 after treatment with normal cell culture medium, the silk peptide mixture Fraction I and the hexapeptide GAGAGS respectively. The numbers in the boxes represent the protein spot numbers listed in 1, 2.
Verification of differentially expressed proteins by western blot analysis and semiquantitative RT‐PCR
To confirm changes in protein expression between 3T3‐L1 preadipocytes, 3T3‐L1‐FI and 3T3‐L1‐GAGAGS, we performed western blot analysis and semiquantitative RT‐PCR for some of the differentially expressed proteins. In western blot analysis, protein levels of PCNA, Actb, Tuba1a, MCM7, hnRNP A3, Rab33b, Rab11b, Aebp1 and TCP‐1‐zeta in 3T3‐L1‐FI and 3T3‐L1‐GAGAGS were significantly higher than those of 3T3‐L1 preadipocytes (P < 0.01 or P < 0.05) using GAPDH as internal control (Fig. 4). Protein levels of PCNA, Actb, hnRNP A3 and Aebp1 in 3T3‐L1‐GAGAGS were higher than those in 3T3‐L1‐FI (P < 0.01 or P < 0.05); protein levels of Tuba1a, Rab11b, Rab33b, and MCM7 were equal (P > 0.05) to those and TCP‐1‐zeta less than (P < 0.01) that of 3T3‐L1‐FI using GAPDH as internal control (Fig. 4). These results were identical to those of the proteome analyses which indicated that proteomic analyses of 3T3‐L1, 3T3‐L1‐FI and 3T3‐L1‐GAGAGS were legitimate. By RT‐PCR analysis, RNA levels of PCNA, Actb, hnRNP A3, Aebp1, Rab33b, Rab11b, Tuba1a, MCM7 and TCP‐1‐zeta increased in 3T3‐L1‐FI and 3T3‐L1‐GAGAGS in comparison with 3T3‐L1 preadipocytes (P < 0.05 or P < 0.01). RNA levels of Actb, hnRNP A3 and Aebp1 in 3T3‐L1‐GAGAGS were higher than those of 3T3‐L1‐FI (P < 0.01 or P < 0.05); RNA levels of Tuba1a, Rab11b and Rab33b were equal (P > 0.05) to those and TCP‐1‐zeta less than (P < 0.01) that in 3T3‐L1‐FI, using GAPDH as internal control (Fig. 4). These results were identical to those of the western blot analysis. However, we detected no variations in mRNA levels of PCNA between 3T3‐L1‐FI and 3T3‐L1‐GAGAGS and we found that mRNA level of MCM7 in 3T3‐L1‐FI was higher than that of 3T3‐L1‐GAGAGS. Change in protein levels of PCNA and MCM7 between 3T3‐L1‐FI and 3T3‐L1‐GAGAGS did not correlate with that in mRNA levels (Fig. 4), indicating that change in PCNA protein level occurred at translation or post‐translation level and that the higher mRNA level of MCM7 in 3T3‐L1‐FI had protein expression equal to that of 3T3‐L1‐GAGAGS, which also occured at translation or post‐translation level.
Figure 4.
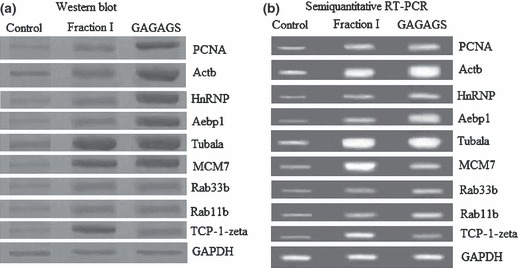
Confirmation of differentially expressed proteins. Confirmation of differentially expressed proteins in 3T3‐L1‐FI and 3T3‐L1‐GAGAGS in comparison with 3T3‐L1 preadipocytes (control), using Western blot analysis and semiquantitative RT‐PCR.
Discussion
In the present study, we separated SFH into four components according to their molecular weight, to obtain peptide mixtures: Fraction I with molecular weight less than 1000 Da, Fraction II molecular weight between 1000 and 2000 Da, Fraction III molecular weight between 2000 and 3500 Da and Fraction IV molecular weight between 3500 and 5000 Da. We used these and another three synthetic silk fibroin peptides GAGAGA, GAGAGS and GAGAGY as stimuli to treat 3T3‐L1 preadipocytes. The results show that GAGAGS and peptide mixtures, Fraction I and II, produced significant effects in promoting proliferation of 3T3‐L1 preadipocytes. Then, we investigated protein expression profiles of 3T3‐L1 preadipocytes treated with Fraction I (3T3‐L1‐FI) and 3T3‐L1 preadipocytes treated with GAGAGS (3T3‐L1‐GAGAGS) considering that Fraction I and GAGAGS both had significant effects in promoting cell proliferation and Fraction I may contain hexapeptide GAGAGS, having reasonable comparison between them. In the proteomic analysis, we found 15 differentially expressed proteins in 3T3‐L1‐FI and 3T3‐L1‐GAGAGS with 13 up‐regulated proteins and two down‐regulated proteins. These 15 differentially expressed proteins were involved in nine biological functions as shown in the results.
Proliferating cell nuclear antigen is an auxiliary protein of DNA polymerase delta and is involved in control of eukaryotic DNA replication by increasing the polymerase’s processibility during elongation of the leading strand. It also acts as a landing pad for many other proteins involved in DNA metabolism (17). PCNA is required absolutely for cell proliferation. Deregulation of PCNA expression is a hallmark of many proliferative diseases, and in the clinic, PCNA serves as a general marker of cell proliferation (18). In this study, we detected up‐regulation of PCNA in 3T3‐L1‐FI and 3T3‐L1‐GAGAGS in comparison with 3T3‐L1 preadipocytes indicating that PCNA may also play an important role in promoting proliferation of 3T3‐L1 preadipocytes stimulated by silk peptide mixture Fraction I and hexapeptide GAGAGS.
PTB‐containing, cubilin and LRP1‐interacting protein (P‐CLI1) also known as protein NYGGF4, is a cytoplasm molecule and has functions related to cell growth. PTB domains are found in many cytoplasmic signalling proteins, allowing them to bind specifically to other polypeptides that are tyrosine‐phosphorylated, in response to growth factor stimulation (19). Wang also found that P‐CLI1 increased the proliferation of 3T3‐L1 preadipocytes and this did not affect differentiation of the 3T3‐L1 cells. The authors thought that P‐CLI1 may stimulate growth rate of 3T3‐L1 preadipocytes as a signalling molecule. In the present study, we detected that expression of P‐CLI1 in both 3T3‐L1‐FI and 3T3‐L1‐GAGAGS was more than twice as high as that of 3T3‐L1 preadipocytes. The results showed that Fraction I and GAGAGS modulated higher expression of P‐CLI1, which increased proliferation of 3T3‐L1 preadipocytes.
Adipocyte enhancer‐binding protein 1 (AEBP1) is a ubiquitously expressed transcriptional repressor with carboxypeptidase and DNA‐binding activities (20, 21). Isoform 2 of this protein may positively regulate MAP‐kinase activity in preadipocytes, leading to enhanced preadipocyte proliferation and reduced adipocyte differentiation. Overexpression of AEBP1 in 3T3‐L1 preadipocytes increases their proliferation rate (22). In the present study, up‐regulation of AEBP1, isoform 2 in 3T3‐L1‐FI and 3T3‐L1‐GAGAGS indicated that Fraction I and GAGAGS may affect the cell proliferation of 3T3‐L1 preadipocytes through MAP‐kinase activity regulated by AEBP1 isoform 2.
Proliferation of eukaryotic cells is a highly regulated process that depends on precise duplication of chromosomal DNA in each cell cycle. A replication licensing system promotes assembly of complexes of proteins termed DNA replication licensing factor MCM2–7 on to replication origins (23). It is important for preventing re‐replication of DNA in a single cell cycle. In this study, we detected up‐regulation of DNA replication licensing factor MCM7 (MCM7) in 3T3‐L1‐FI and 3T3‐L1‐GAGAGS, indicating that Fraction I and GAGAGS affect regulation of the replication licensing system in 3T3‐L1 preadipocytes.
Chaperonin‐containing T‐complex polypeptide 1 (CCT) plays an important role in cell growth as it assists in folding of actin, tubulin and other proteins, to attain their functional conformations (24, 25, 26, 27, 28, 29, 30, 31, 32, 33). Expression of CCT here was strongly up‐regulated during cell proliferation, especially from G1/S to early S phase. CCT expression was down‐regulated in G0/G1 phase. When tubulin is rapidly synthesized and assembled, CCT expression is up‐regulated (34, 35, 36, 37). Yokota supposed that CCT should assist maturation of proteins up‐regulated at G1/S transition and/or early S phase (38). In the present study, we detected that expression of Tuba1a, Actb and TCP‐1‐zeta, also named CCT‐zeta‐1, was significantly up‐regulated in 3T3‐L1‐FI and 3T3‐L1‐GAGAGS in comparison with 3T3‐L1 preadipocytes. It can be supposed that Fraction I and GAGAGS modulate TCP‐1‐zeta expression, which assists in folding of actin, tubulin and other proteins to attain rapid cell proliferation of 3T3‐L1 preadipocytes.
Rab33b, a member of the Rab small GTPase family described as a Golgi‐resident protein, is involved in Golgi‐to‐endoplasmic reticulum (ER) transport (39, 40). Rab11b belongs to the Rab11 subfamily playing an essential role in protein recycling from endosomes to plasma membrane (41, 42) and polarized transport from endosomes to trans‐Golgi network (43). Up‐regulated expression of Rab33b and Rab11b in 3T3‐L1‐FI and 3T3‐L1‐GAGAGS indicate that Fraction I and GAGAGS affect protein transport in 3T3‐L1 preadipocytes.
Rpsa is required for assembly and/or stability of the 40S ribosomal subunit, and is required for processing of 20S rRNA‐precursor to mature 18S rRNA in a late step of maturation of 40S ribosomal subunits. It also functions as a cell surface receptor for laminin (44). hnRNP A3 plays a role in cytoplasmic trafficking of RNA and pre‐mRNA splicing (45). Here, Rpsa and hnRNP A3 were up‐regulated in 3T3‐L1‐FI and 3T3‐L1‐GAGAGS. It can be supposed that Fraction I and GAGAGS concern rapid maturation of 40S ribosomal subunits and affect their or other RNA’s cytoplasmic trafficking in 3T3‐L1 preadipocytes. Gst P1 can be used as a marker to predict enhanced oxidative stress in cells (46). Here, down‐regulation of GSTP1 expression implies less oxidative stress in 3T3‐L1‐FI and 3T3‐L1‐GAGAGS than that in 3T3‐L1 preadipocytes.
Results in the proteomic analysis show that protein expression of PCNA, Lmna, Sars, Actb, hnRNP A3, Rpsa and Aebp1 in 3T3‐L1‐GAGAGS were significantly higher than those in 3T3‐L1‐FI (P < 0.01 or P < 0.05); protein expression of Rab11b, Rab33b, Tuba1a, MCM7, PNP, P‐CLI1 and Gst P1 were equal to (P > 0.05) those and TCP‐1‐zeta less than (P < 0.01) that in 3T3‐L1‐FI (Table 2). The results were partially verified by western blot analysis. It can be supposed that the inconsistent changes in these proteins in 3T3‐L1‐FI and 3T3‐L1‐GAGAGS were caused by other peptides in Fraction I. There also existed silk fibroin peptides different from the hexapeptide GAGAGS in Fraction II affecting proliferation of 3T3‐L1 preadipocytes, considering that Fraction II had the effect of promoting their proliferation.
In conclusion, this study has described a proteomic approach to understanding effects of the peptide mixture Fraction I with molecular weight <1000 Da and hexapeptide GAGAGS in promoting proliferation of 3T3‐L1 preadipocytes. Protein identification demonstrated that Fraction I and GAGAGS affect many aspects of cell functions. Using this method, we identified 15 differentially expressed proteins relative to nine biological functions in 3T3‐L1‐FI and 3T3‐L1‐GAGAGS in comparison with 3T3‐L1 preadipocytes, which may result in rapid proliferation of 3T3‐L1 preadipocytes modulated by Fraction I and GAGAGS. The experiment was performed using the 3T3‐L1 preadipocytes line. As cell lines might have distorted pathways of cell proliferation compared to primary cells, further investigation is required to elucidate the specific peptides in Fraction I and Fraction II different from the hexapeptide GAGAGS, affecting the proliferation of 3T3‐L1 preadipocytes and whether this finding would be totally applicable to primary cells. Our data provide a preliminary outline for further studies searching for new peptides affecting proliferation of 3T3‐L1 preadipocytes in silk fibroin hydrolysates, which will contribute to explaining mechanisms of these peptides, for use as anti‐diabetic peptide drugs in future.
Acknowledgements
This study was supported in part by grants from China Postdoctoral Science Foundation funded project, No. 20090451175, Jiangsu Planned Projects for Postdoctoral Research Funds, No. 0901079C, and the Startup Scientific Research Fund from Jiangsu University for Advanced Professionals, No. 08JDG035.
References
- 1. Tanaka K, Kajiyama N, Ishikura K, Waga S, Kikuchi A, Ohtomo K et al. (1999) Determination of the site of disulfide linkage between heavy and light chains of silk fibroin produced by Bombyx mori. Biochim. Biophys. Acta 1432, 92–103. [DOI] [PubMed] [Google Scholar]
- 2. Inoue S, Tanaka K, Arisaka F, Kimura S, Ohtomo K, Mizuno S (2000) Silk fibroin of Bombyx mori is secreted, assembling a high molecular mass elementary unit consisting of H‐chain, L‐chain, and P25, with a 6:6:1 molar ratio. J. Biol. Chem. 275, 40517–40528. [DOI] [PubMed] [Google Scholar]
- 3. Park KJ, Jin HH, Hyun CK (2002) Antigenotoxicity of peptides produced from silk fibroin. Process Biochem. 38, 411–418. [Google Scholar]
- 4. Akai H (1999) New physiological functions of silk material. Up-to-date Foodprocessing 34, 45–47. [Google Scholar]
- 5. Gotoh K, Izumi H, Kanamoto T, Tamada Y, Nakashima H (2000) Sulfated fibroin, a novel sulfated peptide derived from silk, inhibits human immunodeficiency virus replication in vitro . Biosci. Biotechnol. Biochem. 64, 1664–1670. [DOI] [PubMed] [Google Scholar]
- 6. Gao JM, Bai J, Man QQ, Liu G (2000) Mechanism of silk hydrates on modulating the blood glucose metabolism in rats with experimental diabetes. J. Hyg. Res. 29, 379–382. [PubMed] [Google Scholar]
- 7. Hyun CK, Kim IY, Frost SC (2004) Soluble fibroin enhances insulin sensitivity and glucose metabolism in 3T3‐L1 adipocytes. J. Nutr. 134, 3257–3263. [DOI] [PubMed] [Google Scholar]
- 8. Kim ED, Bayaraa T, Shin EJ, Hyun CK (2009) Fibroin‐derived peptides stimulate glucose transport in normal and insulin‐resistant 3T3‐L1 adipocytes. Biol. Pharm. Bull. 32, 427–433. [DOI] [PubMed] [Google Scholar]
- 9. Hoehn GT, Suffredini AF (2005) Proteomics. Crit. Care Med. 33, S444–S448. [DOI] [PubMed] [Google Scholar]
- 10. Conrad DH, Goyette J, Thomas PS (2008) Proteomics as a method for early detection of cancer, a review of proteomics, exhaled breath condensate, and lung cancer screening. J. Gen. Intern. Med. 23(Suppl. 1), 78–84. [DOI] [PMC free article] [PubMed] [Google Scholar]
- 11. Albrethsen J (2007) Reproducibility in protein profiling by MALDI‐TOF mass spectrometry. Clin. Chem. 53, 852–858. [DOI] [PubMed] [Google Scholar]
- 12. Yao YJ, Cui C, Qiu LP, Chen LB (2008) Determination of hydrolysis degree of soy protein: a comparison between methods of pH‐stat and formol‐titration. Science and Technology of Food Industry 29, 268–270. [Google Scholar]
- 13. Zhou FJ, Xu SY, Yang RJ, Wang Z (2007) Properties of Alcalase hydrolyzing silk fibroin. J. Text. Res. 28, 13–17. [Google Scholar]
- 14. Amblard M, Fehrentz JA, Martinez J, Subra G (2006) Methods and protocols of modern solid phase peptide synthesis. Mol. Biotechnol. 33, 239–254. [DOI] [PubMed] [Google Scholar]
- 15. Ramagli LS (1999) Quantifying protein in 2‐D PAGE solubilization buffers. Methods Mol. Biol. 112, 99–103. [DOI] [PubMed] [Google Scholar]
- 16. Huang GP, Pan ZJ, Huang JP, Yang JF, Guo CJ, Wang YG et al. (2008) Proteomic analysis of human bone marrow mesenchymal stem cells transduced with human telomerase reverse transcriptase gene during proliferation. Cell Prolif. 41, 625–644. [DOI] [PMC free article] [PubMed] [Google Scholar]
- 17. Moldovan GL, Pfander B, Jentsch S (2007) PCNA, the maestro of the replication fork. Cell 129, 665–679. [DOI] [PubMed] [Google Scholar]
- 18. Kontopidis G, Wu SY, Zheleva DI, Taylor P, McInnes C, Lane DP et al. (2005) Structural and biochemical studies of human proliferating cell nuclear antigen complexes provide a rationale for cyclin association and inhibitor design. Proc. Natl. Acad. Sci. USA 102, 1871–1876. [DOI] [PMC free article] [PubMed] [Google Scholar]
- 19. Wang B, Zhang M, Ni YH, Liu F, Fan HQ, Fei L et al. (2006) Identification and characterization of NYGGF4, a novel gene containing a phosphotyrosine‐binding (PTB) domain that stimulates 3T3‐L1 preadipocytes proliferation. Gene 379, 132–140. [DOI] [PubMed] [Google Scholar]
- 20. He GP, Muise A, Li AW, Ro HS (1995) A eukaryotic transcriptional repressor with carboxypeptidase activity. Nature 378, 92–96. [DOI] [PubMed] [Google Scholar]
- 21. Muise AM, Ro HS (1999) Enzymic characterization of a novel member of the regulatory B‐like carboxypeptidase with transcriptional repression function: stimulation of enzymic activity by its target DNA. Biochem. J. 343, 341–345. [PMC free article] [PubMed] [Google Scholar]
- 22. Zhang L, Reidy SP, Nicholson TE, Lee HJ, Majdalawieh A, Webber C et al. (2005) The role of AEBP1 in sex‐specific diet‐induced obesity. Mol. Med. 11, 39–47. [DOI] [PMC free article] [PubMed] [Google Scholar]
- 23. Blow JJ, Hodgson B (2002) Replication licensing‐defining the proliferative state? Trends Cell Biol. 12, 72–78. [DOI] [PMC free article] [PubMed] [Google Scholar]
- 24. Ellis RJ, Van DerVies SM (1991) Molecular chaperones. Annu. Rev. Biochem. 60, 321–347. [DOI] [PubMed] [Google Scholar]
- 25. Frydman J, Nimmesgern E, Erdjument‐Bromage H, Wall JS, Tempst P, Hartl FU (1992) Function in protein folding of TRiC, a cytosolic ring complex containing TCP‐1 and structurally related subunits. EMBO J. 11, 4767–4778. [DOI] [PMC free article] [PubMed] [Google Scholar]
- 26. Gao Y, Thomas JO, Chow RL, Lee GH, Cowan NJ (1992) A cytoplasmic chaperonin that catalyzes beta‐actin folding. Cell 69, 1043–1050. [DOI] [PubMed] [Google Scholar]
- 27. Gething MJ, Sambrook J (1992) Protein folding in the cell. Nature 355, 33–45. [DOI] [PubMed] [Google Scholar]
- 28. Hartl FU (1996) Molecular chaperones in cellular protein folding. Nature 381, 571–579. [DOI] [PubMed] [Google Scholar]
- 29. Siegers K, Waldmann T, Leroux MR, Grein K, Shevchenko A, Schiebel E et al. (1999) Compartmentation of protein folding in vivo: sequestration of non‐native polypeptide by the chaperonin‐GimC system. EMBO J. 18, 75–84. [DOI] [PMC free article] [PubMed] [Google Scholar]
- 30. Sternlicht H, Farr GW, Sternlicht ML, Driscoll JK, Willison K, Yaffe MB (1993) The t‐complex polypeptide 1 complex is a chaperonin for tubulin and actin in vivo . Proc. Natl Acad. Sci. USA 90, 9422–9426. [DOI] [PMC free article] [PubMed] [Google Scholar]
- 31. Thulasiraman V, Yang CF, Frydman J (1999) In vivo newly translated polypeptides are sequestered in a protected folding environment. EMBO J. 18, 85–95. [DOI] [PMC free article] [PubMed] [Google Scholar]
- 32. Tian G, Vainberg IE, Tap WD, Lewis SA, Cowan NJ (1995) Specificity in chaperonin‐mediated protein folding. Nature 375, 250–253. [DOI] [PubMed] [Google Scholar]
- 33. Vainberg IE, Lewis SA, Rommelaere H, Ampe C, Vandekerckhove J, Klein HL et al. (1998) Prefoldin, a chaperone that delivers unfolded proteins to cytosolic chaperonin. Cell 93, 863–873. [DOI] [PubMed] [Google Scholar]
- 34. Cyrne L, Guerreiro P, Cardoso AC, Rodrigues‐Pousada C, Soares H (1996) The Tetrahymena chaperonin subunit CCT eta gene is coexpressed with CCT gamma gene during cilia biogenesis and cell sexual reproduction. FEBS Lett. 383, 277–283. [DOI] [PubMed] [Google Scholar]
- 35. Roobol A, Holmes FE, Hayes NV, Baines AJ, Carden MJ (1995) Cytoplasmic chaperonin complexes enter neurites developing in vitro and differ in subunit composition within single cells. J. Cell Sci. 108, 1477–1488. [DOI] [PubMed] [Google Scholar]
- 36. Soares H, Penque D, Mouta C, Rodrigues‐Pousada C (1994) A Tetrahymena orthologue of the mouse chaperonin subunit CCT gamma and its coexpression with tubulin during cilia recovery. J. Biol. Chem. 269, 29299–29307. [PubMed] [Google Scholar]
- 37. Willison KR, Hynes G, Davies P, Goldsborough A, Lewis VA (1990) Expression of three t‐complex genes, Tcp‐1, D17Leh117c3, and D17Leh66, in purified murine spermatogenic cell populations. Genet. Res. 56, 193–201. [DOI] [PubMed] [Google Scholar]
- 38. Yokota S, Yanagi H, Yura T, Kubota H (1999) Cytosolic chaperonin is up‐regulated during cell growth. Preferential expression and binding to tubulin at G(1)/S transition through early S phase. J. Biol. Chem. 274, 37070–37078. [DOI] [PubMed] [Google Scholar]
- 39. Jiang S, Storrie B (2005) Cisternal rab proteins regulate Golgi apparatus redistribution in response to hypotonic stress. Mol. Biol. Cell 16, 2586–2596. [DOI] [PMC free article] [PubMed] [Google Scholar]
- 40. Valsdottir R, Hashimoto H, Ashman K, Koda T, Storrie B, Nilsson T (2001) Identification of rabaptin‐5, rabex‐5, and GM130 as putative effectors of rab33b, a regulator of retrograde traffic between the Golgi apparatus and ER. FEBS Lett. 508, 201–209. [DOI] [PubMed] [Google Scholar]
- 41. Pereira‐Leal JB, Seabra MC (2001) Evolution of the Rab family of small GTP‐binding proteins. Mol. Biol. 313, 889–901. [DOI] [PubMed] [Google Scholar]
- 42. Ullrich O, Reinsch S, Urbé S, Zerial M, Parton RG (1996) Rab11 regulates recycling through the pericentriolar recycling endosome. J. Cell Biol. 135, 913–924. [DOI] [PMC free article] [PubMed] [Google Scholar]
- 43. Wilcke M, Johannes L, Galli T, Mayau V, Goud B, Salamero J (2000) Rab11 regulates the compartmentalization of early endosomes required for efficient transport from early endosomes to the trans‐golgi network. J. Cell Biol. 151, 1207–1220. [DOI] [PMC free article] [PubMed] [Google Scholar]
- 44. Malinoff HL, Wicha MS (1983) Isolation of a cell surface receptor protein for laminin from murine fibrosarcoma cells. J. Cell Biol. 96, 1475–1479. [DOI] [PMC free article] [PubMed] [Google Scholar]
- 45. Ma AS, Moran‐Jones K, Shan J, Munro TP, Snee MJ, Hoek KS et al. (2002) Heterogeneous nuclear ribonucleoprotein A3, a novel RNA trafficking response element‐binding protein. J. Biol. Chem. 277, 18010–18020. [DOI] [PubMed] [Google Scholar]
- 46. Nagai F, Kato E, Tamura HO (2004) Oxidative stress induces GSTP1 and CYP3A4 expression in the human erythroleukemia cell line, K562. Biol. Pharm. Bull. 27, 492–495. [DOI] [PubMed] [Google Scholar]