

Abstract
Objectives: The present study was designed to investigate early proteome and phosphoproteome changes during inhibition of lymphocyte proliferation induced by sirolimus (SRL).
Materials and methods: Proliferation assays were conducted using human CCRF‐CEM T lymphoblasts under different SRL concentrations. Total protein lysates after SRL treatment were used to identify significantly regulated proteins and phosphorylated proteins by 2‐DE and Q‐TOF Ultima Global mass spectrometer.
Results and conclusions: Incubation with 2.5 μmol/l SRL resulted in a ∼ 70% inhibition of cell proliferation. Cells incubated with 2.5 μmol/l for 30 min showed a differential phosphorylation pattern with one higher (TCPQ) and six lower phosphorylation signals (TBA1B, VIME, HNRPD, ENPL, SEPT9, PLSL). On investigating the differential protein expression, five proteins were found to be up‐regulated (ECHB, PSB3, MTDC, LDHB and NDKA) and four were down‐regulated (EHD1, AATC, LMNB1 and MDHC). Nine of these differentially regulated proteins/phosphoproteins (TCPQ, TBA1B, VIME, HNRPD, ENPL, ECHB, PSB3, LDHB and LMNB1) showed significant interaction potential, through binding protein YWHAZ using MINT software.
Conclusions: We report for the first time the simultaneous early influence of SRL on phosphorylation status and on protein expression in the total proteome of CCRF‐CEM T lymphoblasts and predict that 56% of the proteins interact with each other, highlighting significance of these results.
Introduction
Sirolimus (SRL), also known as rapamycin, is a lipophilic macrocyclic lactone (macrolide), identified as an antifungal agent after its isolation from a strain of Streptomyces hygroscopicus in the 1970s (1, 2, 3). Because of its immunosuppressive properties, SRL was introduced as a potent immunoregulator in clinical organ transplantation. Moreover, its anti‐proliferative properties have led to its clinical use in prevention of coronary restenosis, and implantation of a SRL‐eluting stent seems to prevent intimal hyperplasia effectively (4). SRL and its analogues are also under investigation as potential anti‐cancer agents (2, 5). Antifungal, antitumoral and immunosuppressive activities of this inhibitor of the mammalian target of rapamycin (mTOR) have been well covered in several recent reviews (3, 6, 7).
mTOR controls many critical cellular events, which are as follows: proliferation, transcription, translation, as well as survival and growth in response to environmental and nutrient signals. The mTOR axis involves complex regulatory networks and participates in several pathways, including phosphatidylinositol‐3‐kinase (PI3K)/protein kinase B (PKB, AKT), RAS, TCL1 and BCR/ABL, through various interactions. The immunophilin complex of SRL (drug FKBP12) inhibits 40S ribosomal protein S6 kinase (p70S6K, RPS6K), which is a down‐stream effector of the PI3K/AKT/mTOR signal transduction pathway. Normally, RPS6K phosphorylates S6 protein of the 40S ribosomal subunit (RPS6) and thus functions in protein synthesis and cell population growth. mTOR has kinase activity for eukaryotic translation initiation factor 4E‐binding protein 1 (EIF4EBP1) too. It is known that the phosphorylated state of these proteins promotes transcription and translation. The SRL/immunophilin complex can specifically inhibit mTOR activity of the serine–threonine kinase and consequently cellular hyperproliferation in immune and non‐immune cells. The complex arrests G1‐S phase of cell cycle progression and inhibits IL‐2‐ and IL‐4‐dependent proliferation of T and B cells, during co‐stimulatory and cytokine‐driven pathways, by blocking new ribosomal protein synthesis and regulation of protein synthesis (3, 6, 8, 9, 10, 11, 12, 13, 14).
Proteomics is a type of biochemical methodology to study proteins expressed in a biological system of interest with the main goal of identifying gene products (15). Development of techniques to study protein targets of drugs is of great interest for clinical proteomics (16). One example is use of yeast proteome chips to identify new drug targets in the TOR pathway (17). This study has provided valuable information concerning target proteins for small‐molecule inhibitors of rapamycin that included a homologue of the mammalian PTEN tumour suppressor protein. Recently, proteomic techniques have proved their importance in investigations on broader aspects of drug treatment with various in vitro and in vivo models (18, 19). The present study was designed to investigate differently regulated proteins at the quantitative (protein expression) and qualitative (phosphorylation) level of perturbed T‐cell signalling network on short‐term treatment with SRL. Phosphorylation is the post‐translational modification of particular interest when discussing the PI3K/AKT/mTOR signal transduction.
Materials and methods
Reagents
The majority of the chemicals and solutions was purchased from Sigma (Sigma, Taufkirchen, Germany; Sigma‐Aldrich Chemie GmbH, Steinheim, Germany or Sigma, St. Louis, MO, USA); dimethyl sulphoxide (DMSO), phorbol 12‐myristate 13‐acetate, urea, thiourea, DL‐dithiothreitol (DTT), phenylmethylsulphonyl fluoride, phosphatase inhibitor cocktail 1 and 2, iodoacetamide, trypsin, ammonium bicarbonate and trifluoroacetic acid from Merck KGaA, Darmstadt, Germany; glycerine, HCl, sodium acetate pH 4, potassium ferricyanide, sodium thiosulphate from PAA Laboratories GmbH, Cölbe, Germany; RPMI medium, foetal calf serum, penicillin/streptomycin and phosphate‐buffered saline (Dulbecco’s PBS) from Bio‐Rad, Munich, Germany, as well as Bio‐Rad protein assay kit, ampholytes (Bio‐Lyte® 3/10) and immobilized pH gradient (IPG) strips with a nonlinear pH range of 3–10 (ReadyStripTM). Bromophenol blue and Tris were obtained from Carl Roth GmbH, Karlsruhe, Germany; ionomycin from Calbiochem, Schwalbach, Germany; SRL (rapamycin) from LC Laboratories®, Woburn, MA, USA; bromodeoxyuridine (5‐bromo‐2‐deoxyuridine, BrdU) from Roche Diagnostics GmbH, Mannheim, Germany, CHAPS from AppliChem GmbH, Darmstadt, Germany; sodium dodecyl sulphate from Serva, Heidelberg, Germany; Pro‐Q® Diamond Phosphoprotein Gel Stain from Invitrogen, Ltd., Paisley, UK; acetonitrile from J. T. Baker, Deventer, Holland; and formic acid by BASF, Ludwigshafen, Germany.
Culturing and treatment of CCRF‐CEM‐cells
The CCRF‐CEM human T‐lymphoblast (acute lymphoblastic leukemia) cell line was purchased from German Collection of Microorganisms and Cell Cultures GmbH (DSMZ, Braunschweig, Germany). Cells were incubated in 75 cm2 tissue culture flasks (Sarstedt AG & Co., Nümbrecht, Germany) with 90% RPMI medium, 10% foetal calf serum, 100 000 U/l penicillin and 100 μg/l streptomycin at 37 °C, 20% O2 and 5% CO2. In these experiments, cells were used between passages 10 and 20. Cells in 20 ml of medium containing 0.25 × 10⁶ cells/ml were activated with 250 μg/l ionomycin and 10 μg/l phorbol 12‐myristate 13‐acetate before the 30 min treatment with SRL at concentrations indicated in the text and figures. SRL was dissolved in DMSO (1 mg/ml) and aliquots were stored at −20 °C. The drug stability and concentration in stock solution was ensured by LC‐MS/MS analysis before diluting it with medium for cell incubation. Control cells were incubated with the DMSO vehicle only.
Proliferation assay
Cell proliferation was monitored by ELISA using bromodeoxyuridine in 96‐well tissue culture plates (Nunc, Roskilde, Denmark,) in duplicate, according to the manufacturer’s protocol. Cells numbering 3 × 10⁴ were incubated for 48 h in complete medium (200 μl/well) in the presence of SRL at concentrations between 0.1 and 100 μmol/l (resp. 0.09142–91.42 mg/l). Medium was replaced every 24 h. For the last 17 h, cells were pulsed with 20 μl/well 100 μmol/l BrdU. Plates were centrifuged and cells were fixed in FixDenat solution, and then incubated for 60 min with 1:100 diluted mouse anti‐BrdU conjugated with horseradish peroxidase. After washing, substrate solution was added for 15 min and the reaction was stopped with 1 mol/l H2SO4 solution. Absorbance was measured within 5 min at 450 nm with a reference wavelength of 650 nm (MileniaTM kinetic analyser; Diagnostic Products Corporation, Los Angeles, CA, USA).
Total protein extraction
Cells were treated with 2.5 μmol/l SRL for 30 min and protein extracts were prepared from treated and untreated state CCRF‐CEM cells. Cells were washed in ice‐cold PBS and lysed at room temperature in cell lysis buffer containing 7 mol/l urea, 2 mol/l thiourea, 4% (w/v) CHAPS, 2% ampholytes, 1% (w/v) DL‐dithiothreitol and 10 mmol/l phenylmethylsulphonyl fluoride as well as 1% (v/v) phosphatase inhibitor cocktail 1 and 1% (v/v) phosphatase inhibitor cocktail 2. Protein concentration was estimated according to the Bradford protocol (20) using the Bio‐Rad protein assay kit. Protein samples were stored at −80 °C until analysis.
Two‐dimensional electrophoresis
Two‐dimensional electrophoresis (2‐DE) was carried out according to the protocol of Gorg et al. (21); briefly, 180 μg of whole‐cell protein lysate of CCRF‐CEM cells and a trace of bromphenol blue were loaded on immobilized pH gradient (IPG) strips with a nonlinear pH range of 3–10. After rehydration, isoelectric focusing was performed in a Protein IEF Cell (Bio‐Rad) at 20 °C set to 32 000 Vh. The IPG strip was then equilibrated with equilibration buffer (6 mol/l urea, 30% glycerine, 2% sodium dodecyl sulphate, 0.05 mol/l Tris/5N HCl to pH 8.8 and a trace of bromophenol blue) containing 15 mmol/l DTT to reduce disulphide bridges, followed with buffer containing 40 g/l iodoacetamide. Afterwards, the strip was loaded on to a vertical 12% polyacrylamide SDS–PAGE for separation by molecular weight, for 19 h at 4 °C and 90 V. Protein separation in the second dimension was improved by inclusion of 4% stacking gel.
Phospho‐ and silver‐staining of proteins
2‐DE gels were fixed and washed before phosphostaining, according to recommendations of the manufacturer. Incubation with 200 ml/gel ready solution Pro‐Q® Diamond Phosphoprotein Gel Stain was carried out in the dark, followed by destaining in 20% acetonitrile and 50 mmol/l sodium acetate pH 4 for 90 min. After three 5 min washes in water, gels were scanned at a wavelength of 532 nm (Fla 5100, Fujifilm Europa GmbH, Düsseldorf, Germany). They were then stained according to the modified silver‐staining method of Blum et al. (22), scanned (CanoScan 8400F, Canon) and finally dried for further storage (Gel Dryer, Model 583; Bio‐Rad).
Protein identification
In‐gel digestion was carried out according to a modified protocol of Shevchenko et al. (23). Spots of interest were the significantly regulated spots from the phosphoprotein/protein profile with difference in intensity between sirolimus treated versus control CCRF‐CEM cells, of more than 25%. These were excised and after destaining with potassium ferricyanide and sodium thiosulphate, proteins/peptides were digested with trypsin. Gel slices were washed and equilibrated with ammonium bicarbonate followed by incubation with acetonitrile. Peptides were extracted using trifluoroacetic acid and acetonitrile. Solutions with digested protein/peptide were dried in a speed vacuum system (UniEquip GmbH, Munich, Germany) and stored at −20 °C until further analysis. Dried samples were diluted in 0.1% formic acid and 1 μl was loaded for chromatographic separation on a CapLC‐System (Waters, Milford, MA, USA). Peptide sequence analysis was carried out on a Q‐TOF Ultima Global mass spectrometer (Micromass, Manchester, UK) equipped with a nanoflow ESI Z‐spray source in positive ion mode, as described previously (24). Data were processed using Protein Lynx Global Server (2.0, Micromass) and searched against MSDB and SwissProt data bases through the Mascot search engine with oxidation (M) and carbamidomethyl (C) modification, when appropriate.
Software and statistics
Densitometric quantification of spot intensity normalized to total spot intensity of each gel, was performed using Delta2D software (V3.4; Decodon GmbH, Greifswald, Germany) (25). The Friedman test was performed using software for statistical evaluation SPSS (V14.0 for Windows; Chicago, IL, USA). Molecular INTeraction database (MINT; http://mint.bio.uniroma2.it/mint/Welcome.do) was used to analyse protein relationships and to obtain a graphical view of any predicted network with direct and indirect interacting proteins (26).
Results
Inhibition of cell proliferation by sirolimus
Incubation of CCRF‐CEM cells with increasing concentrations of SRL from 0 to 100 μmol/l for 48 h resulted in dose‐dependent inhibition of cell proliferation with a half maximal inhibitory concentration (IC50) value of around 2 μmol/l (Fig. 1, n = 5). All tested concentrations led to a decrease in the proliferation. At the highest SRL concentration of 100 μmol/l, cell proliferation was inhibited by approximately 99.4%.
Figure 1.
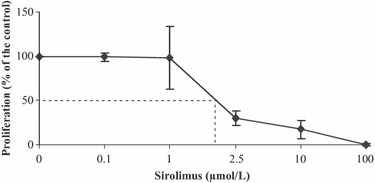
Concentration‐dependent inhibition of CCRF‐CEM cell proliferation by sirolimus. Results are shown as mean and SD of five separate experiments.
Proteins with significantly altered phosphorylation status
For investigation of proteins modulated by treatment of CCRF‐CEM cells with SRL, concentration of 2.5 μmol/l was selected, which leads to approximately 70% inhibition of cell proliferation after 48 h incubation. Cell extracts were prepared from treated (2.5 μmol/l SRL for 30 min) and untreated CCRF‐CEM cells and separated by 2‐DE.
Four paired phosphostained 2‐DE gels were analysed using Delta2D software (Fig. 2) and nine significantly modulated spots (P < 0.05) were selected for identification. Eight of nine analysed spots could be identified by mass spectrometry and database search (Fig. 3A, Tables S1 and S2), which represented different proteins/peptides (Table 1A,B).
Figure 2.
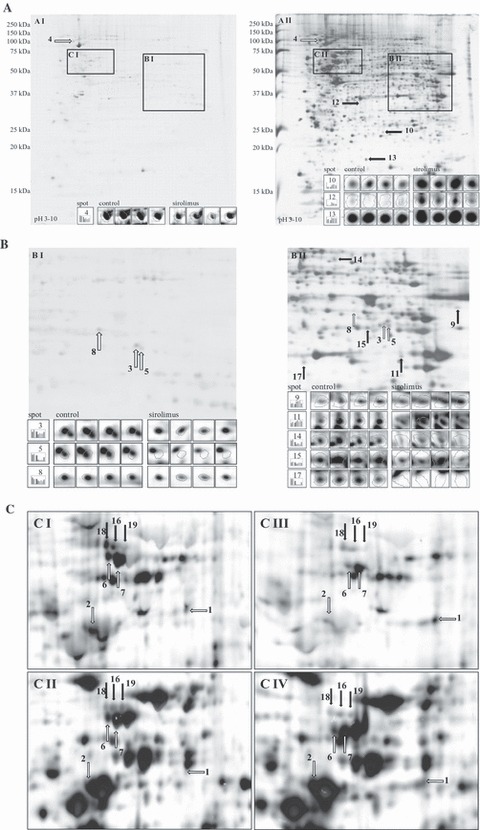
Two‐dimensional gel electrophoresis using total protein extract from CCRF‐CEM cells; images overlapped and quantified using Delta2D software. Identified protein spots by mass spectrometry were labelled according to their numbering in the tables and indicated with white arrows, if differentially phosphorylated, or with black arrows if differentially expressed. (A) Representative original control gel after phospho‐ (A I) and consequent silver‐staining (A II) with spot albums from four experiments. (B) Maximized areas of control gel after phospho‐ (B I) and silver‐staining (B II) with spot albums from four experiments. (C) Shift of protein spots between maximized areas of control gel after phospho‐ (C I) and silver‐staining (C II) as well as between the corresponding areas on sirolimus treatment after phospho‐ (C III) and silver‐staining (C IV). High contrast and normalization to total spot intensity were set by the Delta2D software tool.
Figure 3.
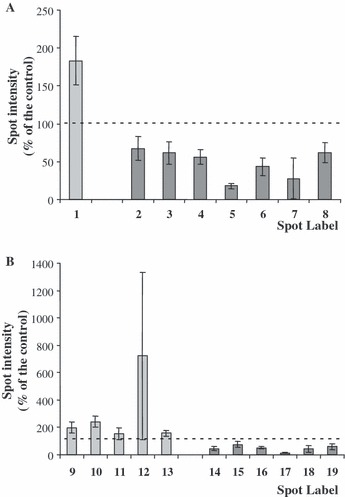
Significantly (P < 0.05) regulated protein spots in CCRF‐CEM cells after sirolimus treatment in phospho‐ (A) and silver‐stained 2‐DE gels (B). Bar charts illustrate mean percentage spot intensity ratio (treated versus control cells) and SD from four separate experiments.
Table 1.
Molecular weight, isoelectric point and function of significantly regulated proteins in CCRF‐CEM cells detected after sirolimus treatment using phospho‐ (A, B) and silver‐stained 2‐DE gels (C, D)
| Spot label | Mascot protein name (Abbreviations) | Uniprot ID | MW (kDa) Calc./Obs. | pI Calc./Obs. | Functionb |
|---|---|---|---|---|---|
| (A) Protein spots with higher phosphorylation status under sirolimus in phosphostained 2‐DE gels | |||||
| 1 | T‐complex protein 1 subunit theta (TCPQ; CCT8)a | P50990 | 59.583/∼53 | 5.42/∼5.3 | Chaperonin |
| (B) Protein spots with lower phosphorylation status under sirolimus in phosphostained 2‐DE gels | |||||
| 2 | Tubulin alpha‐1B chain (TBA1B; TUBA1B)a | P68363 | 50.120/∼50 | 4.94/∼4.5 | Microtubule isoform |
| Vimentin (VIME; VIM)a | P08670 | 53.619/∼50 | 5.06/∼4.5 | Microfilament | |
| 3 | Heterogeneous nuclear ribonucleoprotein D0 (HNRPD)a | Q14103 | 38.410/∼42 | 7.62/∼7.7 | Ubiquitously expressed nuclear ribonucleoprotein |
| 4 | Endoplasmin precursor (ENPL; HSP90B1, GRP94)a | P14625 | 92.411/∼100 | 4.76/∼4.3 | Highly conserved molecular chaperon |
| 5 | Septin‐9 (SEPT9) | Q9UHD8 | 65.361/∼41 | 9.06/∼7.8 | Cytoskeletal filament‐forming protein |
| 6 | Plastin‐2 (PLSL) | P13796 | 70.245/∼70 | 5.20/∼4.6 | Ubiquitous actin‐binding protein |
| 7 | Plastin‐2 (PLSL) | P13796 | 70.245/∼70 | 5.20/∼4.7 | (see above) |
| 8 | Heterogeneous nuclear ribonucleoprotein D0 (HNRPD)a | Q14103 | 38.410/∼44 | 7.62/∼7.4 | (see above) |
| (C) Spots with higher protein amount under sirolimus in silverstained 2‐DE gels | |||||
| 9 | Trifunctional enzyme subunit beta, mitochondrial precursor (ECHB; HADHB)a | P55084 | 51.262/∼45 | 9.45/∼9 | Catalyser in mitochondrial beta‐oxidation of long‐chain fatty acids with 3‐ketoacyl‐CoA thiolase activity |
| 10 | Proteasome subunit beta type‐3 (PSB3; PSMB3)a | P49720 | 22.933/∼23 | 6.14/∼6.6 | Immunoproteasome |
| 11 | Bifunctional methylenetetrahydrofolate dehydrogenase/cyclohydrolase, mitochondrial precursor (MTDC) | P13995 | 37.871/∼37 | 8.86/∼8.3 | Nuclear‐encoded mitochondrial enzyme |
| 12 | L‐lactate dehydrogenase B chain (LDHB)a | P07195 | 36.615/∼32 | 5.71/∼5.8 | Carbohydrate metabolism |
| 13 | Nucleoside diphosphate kinase A (NDKA; nm23‐H1; NME1) | P15531 | 17.138/∼18 | 5.83/∼6 | Suppressor of invasive cancer phenotype, transcription factor and activator of MYC |
| (D) Spots with lower protein amount under sirolimus in silver‐stained 2‐DE gels | |||||
| 14 | EH domain‐containing protein 1 (EHD1) | Q9H4M9 | 60.589/∼60 | 6.35/∼7.4 | Substrate for EGFR in protein–protein interactions and intracellular sorting |
| 15 | Aspartate aminotransferase, cytoplasmic (AATC; GOT1) | P17174 | 46.219/∼40 | 6.52/∼7.8 | Pyridoxal phosphate‐dependent enzyme in amino acid metabolism, urea and tricarboxylic acid cycles |
| 16 | Lamin‐B1 (LMNB1)a | P20700 | 66.368/∼70 | 5.11/∼4.8 | Nuclear lamina matrix |
| 17 | Malate dehydrogenase, cytoplasmic (MDHC; MDH1) | P40925 | 36.403/∼33 | 6.91/∼7 | Catalyser of the reversible oxidation of malate to oxaloacetate |
| 18 | Lamin‐B1 (LMNB1)a | P20700 | 66.368/∼70 | 5.11/∼4.7 | (see above) |
| 19 | Lamin‐B1 (LMNB1)a | P20700 | 66.368/∼70 | 5.11/∼4.9 | (see above) |
MW (kDa), molecular weight in kilo Daltons; Calc./Obs., calculated/observed values; pI, isoelectric point; N/A, no available information.
aProteins within a MINT network.
bAvailable information on http://www.proteinatlas.org, http://www.matrixscience.com or http://www.ncbi.nlm.nih.gov.
One phosphoprotein (spot label 1; Table S1), which was significantly higher phosphorylated on treatment of cells with SRL, was identified as T‐complex protein 1 subunit theta (TCPQ).
Phosphorylation of seven spots was significantly lower in presence of SRL. In the case of spot label 2, sequence analysis revealed the presence of two proteins, tubulin alpha‐1B chain (TBA1B) and/or vimentin (VIME). Further phosphoproteins with lower signal included heterogeneous nuclear ribonucleoprotein D0 (HNRPD; spot 3), endoplasmin precursor (ENPL; spot 4); septin‐9 (SEPT9, spot 5); plastin‐2 (PLSL, spots 6 and 7); and again HNRPD (spot 8) (Table S1). Six of these were only identified by a single spot (Table S2). Two proteins, however, displayed two variant forms (HNRPD with spot labels 3 and 8, PLSL with spot labels 6 and 7).
Proteins with significantly altered amounts
Phosphostained 2‐DE gels were further subjected to silver staining (Fig. 2). On comparative computational analysis of images of silver‐stained 2‐DE gels, 15 spots revealed changes in relative intensity. Significant differences (P < 0.05) in protein intensity were observed between treated and control CCRF‐CEM cells for all spots. Eleven of 15 analysed spots could be unambiguously identified by mass spectrometry (Fig. 3B, Tables S1 and S2), which represented nine different proteins/peptides (Table 1C,D).
Five proteins displayed significantly more intense staining after treatment of the cells with SRL: trifunctional enzyme subunit beta, mitochondrial precursor (ECHB, spot label 9) proteasome subunit beta type‐3 (PSB3, spot label 10), bifunctional methylenetetrahydrofolate dehydrogenase/cyclohydrolase, mitochondrial precursor (MTDC, spot label 11), L‐lactate dehydrogenase B chain (LDHB, spot label 12) as well as nucleoside diphosphate kinase A (NDKA, spot label 13) (Table S1).
Intensity of six spots was significantly lower after SRL treatment: these included EH domain‐containing protein 1 (EHD1, spot label 14), cytoplasmic aspartate aminotransferase, (AATC, spot label 15), lamin B1 (LMNB1, spot labels 16; 18 and 19), and cytoplasmic malate dehydrogenase (MDHC, spot label 17) (Table S1).
Half of all identified spots were excised twice from different 2‐DE gels and analysed again by mass spectrometry to ensure reproducibility of data obtained.
Discussion
We performed differential proteomic analysis on CCRF‐CEM cells after short‐term incubation with SRL. SRL incubation led to dose‐dependent inhibition of cell proliferation (Fig. 1). As the average proliferation level of CCRF‐CEM cells at 2.5 μmol/l SRL was approximately 30% of that of drug‐free controls, this concentration was chosen for further proteomic studies. Using 2‐DE and mass spectrometry, we observed that 2.5 μmol/l SRL significantly altered phosphorylation status after 30 min incubation (Table 1A,B); one higher phosphorylated protein (TCPQ) and six lower phosphorylated proteins (TBA1B, VIME, HNRPD, ENPL, SEPT9 and PLSL). Among these proteins, SEPT9 (spot 5) and PLSL (spot 7) showed over 3‐fold change in SRL‐treated cells compared to controls (Table S1). From the same gels, we also obtained data for significantly altered protein expression (Table 1C,D); five up‐regulated proteins/peptides (ECHB, PSB3, MTDC, LDHB and NDKA) and four down‐regulated proteins (EHD1, AATC, LMNB1 and MDHC) were identified. Among these proteins, LDHB (spot 12) showed over 3‐fold up‐regulation, while MDHC (spot 17) was over 3‐fold down‐regulated in all samples investigated after SRL treatment, when compared to paired drug‐free CCRF‐CEM cells (Table S1). In general, proteins showed good agreement between observed molecular weights and isoelectric points, and their calculated values based on amino acid sequence (Table 1). Most identified proteins from 2‐DE gels after both staining types belong to the cell compartment cytosol/cytoplasm, followed by a small number of proteins from the nucleus, membranes and mitochondria. Proteins with changed phosphorylation levels were predominantly plasma proteins; however, proteins with altered amounts in cells were generally enzymes (transferases, peptidases, hydrolases and oxidoreductases).
We analysed the relationship between identified proteins using the MINT database (26) and found nine of 16 (56%) to be interacting proteins: TCPQ, TBA1B, VIME, HNRPD, ENPL, ECHB, PSB3, LDHB and LMNB1 (Fig. 4). Four proteins (NDKA, EHD1, AATC and MDHC) were found to be linked to another network. However, SEPT9, PLSL and MTDC did not match anything found in the database. Proteins known to be involved in signal transduction after SRL treatment were also found among the cohort of interacting partners in the MINT network. In addition, our total protein set was evaluated, together with numerous other proteins known to be influenced by SRL (PTEN, FRAP1, RPS6KB1, RPS6, FKBP4, AKT1, EGF, EGFR, P85SPR, CBFA2T2, PIK3CA, PIK3CB, INPP5D, PDPK1, IRS1, TSC4, GSK3B, GSK3A, CTNNB1, BAD, CASP7, CASP3, EIF4EBP1 and APAF1), suggesting mTOR regulation.
Figure 4.
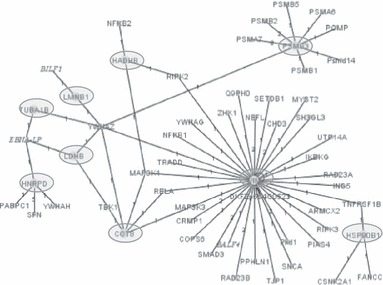
Network of interacting proteins from our total set in grey circles: TCPQ (here CCT8), TBA1B (TUBA1B), VIME (VIM), HNRPD, ENPL (HSP90B1), ECHB (HADHB), PSB3 (PSMB3), LDHB and LMNB1 with some of their near linking partners, using MINT database.
Changes in phosphoprotein and protein patterns reflected an early response to the immunosuppressant SRL. Furthermore, we focused on proteins within the predicted network (Fig. 4) and on involved biological processes (Table 1) in an attempt to reveal cellular events leading to significant inhibition of CCRF‐CEM cell proliferation (Fig. 1). TCPQ represents a chaperonin, involved in protein folding, and is more strongly phosphorylated under SRL influence, in the present study. Majority of the proteins found by our phosphorylation analysis showed lower levels of phosphorylation involved in mitosis, cell and intracellular movement, protein polymerization (TBA1B), immune response, stabilizing cytoplasmic architecture and contribution to specific dynamic cellular processes (VIME), influencing pre‐mRNA processing, mRNA stability, mRNA metabolism and transport (HNRPD), signal transduction, protein folding, protein degradation, and stabilizing and refolding denatured proteins, after stress (ENPL). Protein expression by SRL treatment was higher for proteins playing a role in catalysing mitochondrial beta‐oxidation of long‐chain fatty acids with 3‐ketoacyl‐CoA thiolase activity (ECHB), peptide cleavage in ATP/ubiquitin‐dependent process in a non‐lysosomal pathway (PSB3), and in anaerobic glycolysis/carbohydrate metabolism (LDHB). LMNB1 is a lower expressed protein after SRL. During mitosis, nuclear lamina matrix is reversibly disassembled, as lamin proteins are phosphorylated. Lamin proteins are thought to be involved in nuclear stability, chromatin structure and gene expression. In summary, all these listed processes correlated generally with signal transduction, metabolism and mitosis.
As can be seen in Fig. 4, YWHAZ was the linking protein between experimentally obtained proteins whose apparent regulation was altered through SRL treatment. YWHAZ is a tyrosine 3‐monooxygenase/tryptophan 5‐monooxygenase activation protein, zeta polypeptide, that belongs to the 14‐3‐3 family of proteins. It is known to be a transcription factor‐binding protein taking part in anti‐apoptosis, protein targeting and signal transduction. It has been suggested that association with 14‐3‐3 proteins plays a role in regulation of insulin sensitivity (27) by interrupting the association between the insulin receptor and its substrate, and in activation of c‐Raf, by their participation in the protein kinase C signalling pathway (28). Activation of protein kinase C is thought to be involved in induction of cellular responses to a variety of ligand‐receptor systems and in regulation of cell responsiveness to external stimuli. It is also known that recombinant 14‐3‐3‐zeta interacts directly with both recombinant and endogenous PKB (AKT) in embryonic kidney cell lysates (29). Moreover, transfection of active PKB into embryonic kidney cells has resulted in phosphorylation of 14‐3‐3‐zeta. 14‐3‐3‐zetza facilitates activation of beta‐catenin (CTNNB1) by AKT in mouse intestinal stem cells and it has been presumed that AKT phosphorylates CTNNB1, leading to 14‐3‐3‐zeta binding and stabilization of CTNNB1 (30).
ENPL, also called heat shock protein, a 90 kDa beta member 1 (HSP90B1) or 94 kDa glucose‐regulated protein (GRP94), is a stress‐inducible resident endoplasmic reticulum/sarcoplasmic reticulum glycoprotein and molecular chaperone, required for different biological processes especially cell surface export of molecules involved in native immune responses. Only the lowest mobility form of this chaperone is phosphorylated by casein kinase‐2 in Sf21 insect cells, although in vitro phosphorylation led to phosphorylation of all its glycosylated forms (31). An early study has suggested that autophosphorylation on serine and threonine residues of ENPL may regulate complex formation and chaperone function (32). Recently, it has been demonstrated that ENPL undergoes Tyr‐phosphorylation early after induction (peak at 6 h) of cell differentiation (33). This event is required to promote chaperone export from the endoplasmic reticulum to the Golgi apparatus, occurring in the early phase of myoblast differentiation. Notably, it was suggested that AKT‐mediated phosphorylation of stress‐induced chaperones represents a mechanism for regulation of chaperone function, for example of ENPL, during mesangial cell responses to physiological and pathological stimuli (34). We investigated the effects of SRL on CCRF‐CEM cells and the present analysis has enabled us to measure relative phosphorylation of ENPL. Based on our results, ENPL showed significantly lower phosphorylation status after incubation for 30 min with SRL (Table 1). Interestingly, ENPL was among the translationally repressed mRNAs observed after treatment of human Jurkat T cells with rapamycin (35) for 4 h. It might be speculated that decrease in phosphorylation of ENPL reflects an early response to immunosuppressant SRL, followed by differential expression of ENPL, at least after 4 h of its incubation.
In conclusion, in the present study, we report for the first time the simultaneous early effect of SRL on phosphorylation status and on protein expression in CCRF‐CEM cells, as well as predicted interacting relationships between 9 of 16 proteins, through binding protein YWHAZ. As the 14‐3‐3 proteins (e.g. YWHAZ) and the chaperones (e.g. ENPL) interact with AKT, we presume that mTOR axis was inhibited and feedback activation of AKT was induced through phosphorylation.
Supporting information
Table S1. Intensity ratio of sirolimus treated versus control CCRF‐CEM cells of significantly regulated protein spots in phospho‐ and silver‐stained 2‐DE gels of four separate experiments (I–IV).
Table S2. Score and matched peptides of the identified proteins using nano‐LC MS/MS from the proteome of the CCRF‐CEM cells after sirolimus treatment.
Please note: Wiley‐Blackwell are not responsible for the content or functionality of any supporting materials supplied by the authors. Any queries (other than missing material) should be directed to the corresponding author for the article.
Supporting info item
Acknowledgements
We thank Dr Hassan Dihazi for the support with the Fla 5100 imaging system, as well as Christina Wiese, Christa Scholz and Susanne Goldmann for their expert technical assistance. We deeply regret the loss of our friend and co‐author V.W. Armstrong, who passed away after acceptance of this manuscript. This study was financially supported by a grant from the University of Goettingen Medical Center ‘Forschungsförderungsprogramm 2005’ and presents data of the doctoral thesis of Frank C. Schultze.
References
- 1. Vezina C, Kudelski A, Sehgal SN (1975) Rapamycin (AY‐22,989), a new antifungal antibiotic. I. Taxonomy of the producing Streptomycete and isolation of the active principle. J. Antibiot. (Tokyo) 28, 721–726. [DOI] [PubMed] [Google Scholar]
- 2. Panwalkar A, Verstovsek S, Giles FJ (2004) Mammalian target of rapamycin inhibition as therapy for hematologic malignancies. Cancer 100, 657–666. [DOI] [PubMed] [Google Scholar]
- 3. Morath C, Arns W, Schwenger V, Mehrabi A, Fonouni H, Schmidt J et al. (2007) Sirolimus in renal transplantation. Nephrol. Dial. Transplant. 22, viii61–viii65. [DOI] [PubMed] [Google Scholar]
- 4. Rensing BJ, Vos J, Smits PC, Foley DP, Van Den Brand MJ, Van Der Giessen WJ et al. (2001) Coronary restenosis elimination with a sirolimus eluting stent: first European human experience with 6‐month angiographic and intravascular ultrasonic follow‐up. Eur. Heart J. 22, 2125–2130. [DOI] [PubMed] [Google Scholar]
- 5. Rao RD, Buckner JC, Sarkaria JN (2004) Mammalian target of rapamycin (mTOR) inhibitors as anti‐cancer agents. Curr. Cancer Drug Targets 4, 621–635. [DOI] [PubMed] [Google Scholar]
- 6. Sehgal SN (2003) Sirolimus: its discovery, biological properties, and mechanism of action. Transplant. Proc. 35, 7S–14S. [DOI] [PubMed] [Google Scholar]
- 7. Christians U, Schmitz V, Schöning W, Bendrick‐Peart J, Klawitter J, Haschke M et al. (2008) Toxicodynamic therapeutic drug monitoring of immunosuppressants: promises, reality, and challenges. Ther. Drug Monit. 30, 151–158. [DOI] [PubMed] [Google Scholar]
- 8. Ponticelli C (2004) The pleiotropic effects of mTor inhibitors. J. Nephrol. 17, 762–768. [PubMed] [Google Scholar]
- 9. Dasgupta B, Yi Y, Chen DY, Weber JD, Gutmann DH (2005) Proteomic analysis reveals hyperactivation of the mammalian target of rapamycin pathway in neurofibromatosis 1‐associated human and mouse brain tumors. Cancer Res. 65, 2755–2760. [DOI] [PubMed] [Google Scholar]
- 10. Jacinto E, Hall MN (2003) Tor signalling in bugs, brain and brawn. Nat. Rev. Mol. Cell Biol. 4, 117–126. [DOI] [PubMed] [Google Scholar]
- 11. Bandhakavi S, Xie H, O’Callaghan B, Sakurai H, Kim DH, Griffin TJ (2008) Hsf1 activation inhibits rapamycin resistance and TOR signaling in yeast revealed by combined proteomic and genetic analysis. PLoS One 3, e1598. [DOI] [PMC free article] [PubMed] [Google Scholar]
- 12. Dowling RJ, Pollak M, Sonenberg N (2009) Current status and challenges associated with targeting mTOR for cancer therapy. BioDrugs 23, 77–91. [DOI] [PubMed] [Google Scholar]
- 13. Teachey DT, Grupp SA, Brown VI (2009) Mammalian target of rapamycin inhibitors and their potential role in therapy in leukaemia and other haematological malignancies. Br. J. Haematol. 145, 569–580. [DOI] [PMC free article] [PubMed] [Google Scholar]
- 14. Zhao XF, Gartenhaus RB (2009) Phospho‐p70S6K and cdc2/cdk1 as therapeutic targets for diffuse large B‐cell lymphoma. Expert Opin. Ther. Targets 13, 1085–1093. [DOI] [PubMed] [Google Scholar]
- 15. Choudhary J, Grant SGN (2004) Proteomics in postgenomic neuroscience: the end of the beginning. Nat. Neurosci. 7, 440–445. [DOI] [PubMed] [Google Scholar]
- 16. Robinson JM, Ackerman WE, Kniss DA, Takizawa T, Vandré DD (2008) Proteomics of the human placenta: promises and realities. Placenta 29, 135–143. [DOI] [PMC free article] [PubMed] [Google Scholar]
- 17. Huang J, Zhu H, Haggarty SJ, Spring DR, Hwang H, Jin F et al. (2004) Finding new components of the target of rapamycin (TOR) signaling network through chemical genetics and proteome chips. Proc. Natl. Acad. Sci. U.S.A. 101, 16594–16599. [DOI] [PMC free article] [PubMed] [Google Scholar]
- 18. Heller T, Asif AR, Petrova DT, Doncheva Y, Wieland E, Oellerich M et al. (2009) Differential proteomic analysis of lymphocytes treated with mycophenolic acid reveals caspase 3‐induced cleavage of rho GDP dissociation inhibitor 2. Ther. Drug Monit. 31, 211–217. [DOI] [PubMed] [Google Scholar]
- 19. Asif AR, Armstrong VW, Voland A, Wieland E, Oellerich M, Shipkova M (2007) Proteins identified as targets of the acyl glucuronide metabolite of mycophenolic acid in kidney tissue from mycophenolate mofetil treated rats. Biochimie 89, 393–402. [DOI] [PubMed] [Google Scholar]
- 20. Bradford MM (1976) A rapid and sensitive method for the quantitation of microgram quantities of protein using the principle of protein‐dye binding. Anal. Biochem. 72, 248–254. [DOI] [PubMed] [Google Scholar]
- 21. Gorg A, Obermaier C, Boguth G, Harder A, Scheibe B, Wildgruber R et al. (2000) The current state of two‐dimensional electrophoresis with immobilized ph gradients. Electrophoresis 21, 1037–1053. [DOI] [PubMed] [Google Scholar]
- 22. Blum H, Beier H, Gross HJ (1987) Improved silver staining of plant proteins, RNA and DNA in polyacrylamide gels. Electrophoresis 8, 93–99. [Google Scholar]
- 23. Shevchenko A, Wilm M, Vorm O, Mann M (1996) Mass spectrometric sequencing of proteins from silver‐stained polyacrylamide gels. Anal. Chem. 68, 850–858. [DOI] [PubMed] [Google Scholar]
- 24. Asif AR, Oellerich M, Armstrong VW, Hecker M, Cattaruzza M (2009) T‐786C Polymorphism of the NOS‐3 gene and the endothelial cell response to fluid shear stress‐a proteome analysis. J. Proteome Res. 8, 3161–3168. [DOI] [PubMed] [Google Scholar]
- 25. Luhn S, Berth M, Hecker M, Bernhardt J (2003) Using standard positions and image fusion to create proteome maps from collections of two‐dimensional gel electrophoresis images. Proteomics 3, 1117–1127. [DOI] [PubMed] [Google Scholar]
- 26. Chatr‐aryamontri A, Ceol A, Palazzi LM, Nardelli G, Schneider MV, Castagnoli L et al. (2007) MINT: the Molecular INTeraction database. Nucleic Acids Res. 35, D572–D574. [DOI] [PMC free article] [PubMed] [Google Scholar]
- 27. Ogihara T, Isobe T, Ichimura T, Taoka M, Funaki M, Sakoda H et al. (1997) 14‐3‐3 protein binds to insulin receptor substrate‐1, one of the binding sites of which is in the phosphotyrosine binding domain. J. Biol. Chem. 272, 25267–25274. [DOI] [PubMed] [Google Scholar]
- 28. Leffers H, Madsen P, Rasmussen HH, Honore B, Andersen AH, Walbum E et al. (1993) Molecular cloning and expression of the transformation sensitive epithelial marker stratifin: a member of a protein family that has been involved in the protein kinase C signalling pathway. J. Mol. Biol. 231, 982–998. [DOI] [PubMed] [Google Scholar]
- 29. Powell DW, Rane MJ, Chen Q, Singh S, McLeish KR (2002) Identification of 14‐3‐3‐zeta as a protein kinase B/Akt substrate. J. Biol. Chem. 277, 21639–21642. [DOI] [PubMed] [Google Scholar]
- 30. Tian Q, Feetham MC, Tao WA, He XC, Li L, Aebersold R et al. (2004) Proteomic analysis identifies that 14‐3‐3‐zeta interacts with beta‐catenin and facilitates its activation by Akt. Proc. Nat. Acad. Sci. U.S.A. 101, 15370–15375. [DOI] [PMC free article] [PubMed] [Google Scholar]
- 31. Cala SE (2000) GRP94 hyperglycosylation and phosphorylation in Sf21 cells. Biochim. Biophys. Acta 1496, 296–310. [DOI] [PubMed] [Google Scholar]
- 32. Csermely P, Miyata Y, Schnaider T, Yahara I (1995) Autophosphorylation of grp94 (endoplasmin). J. Biol. Chem. 270, 6381–6388. [DOI] [PubMed] [Google Scholar]
- 33. Frasson M, Vitadello M, Brunati AM, La Rocca N, Tibaldi E, Pinna LA et al. (2009) Grp94 is Tyr‐phosphorylated by Fyn in the lumen of the endoplasmic reticulum and translocates to Golgi in differentiating myoblasts. Biochim. Biophys. Acta 1793, 239–252. [DOI] [PubMed] [Google Scholar]
- 34. Barati MT, Rane MJ, Klein JB, McLeish KR (2006) A proteomic screen identified stress‐induced chaperone proteins as targets of Akt phosphorylation in mesangial cells. J. Proteome Res. 5, 1636–1646. [DOI] [PMC free article] [PubMed] [Google Scholar]
- 35. Grolleau A, Bowman J, Pradet‐Balade B, Puravs E, Hanash S, Garcia‐Sanz JA et al. (2002) Global and specific translational control by rapamycin in T cells uncovered by microarrays and proteomics. J. Biol. Chem. 277, 22175–22184. [DOI] [PubMed] [Google Scholar]
Associated Data
This section collects any data citations, data availability statements, or supplementary materials included in this article.
Supplementary Materials
Table S1. Intensity ratio of sirolimus treated versus control CCRF‐CEM cells of significantly regulated protein spots in phospho‐ and silver‐stained 2‐DE gels of four separate experiments (I–IV).
Table S2. Score and matched peptides of the identified proteins using nano‐LC MS/MS from the proteome of the CCRF‐CEM cells after sirolimus treatment.
Please note: Wiley‐Blackwell are not responsible for the content or functionality of any supporting materials supplied by the authors. Any queries (other than missing material) should be directed to the corresponding author for the article.
Supporting info item