

Abstract
Objectives
The K‐ras gene mutation commonly found in lung adenocarcinomas contributes to their non‐invasive expansion. Our main objective here was to develop a chemopreventive agent against K‐ras‐mutated lung adenocarcinoma cell line like‐A549.
Materials and methods
We isolated flavonol from ethanolic leaf extract of Thuja occidentalis, and evaluated its apoptotic potentials on A549 cells. They were treated with 1–10 μg/ml of flavonol and viability was tested retaining normal lung cells L‐132 as control. We performed assays such as TUNEL, annexin V, cell‐cycle and mitochondrial membrane potentials, by FACS analysis. ROS‐mediated oxidative stress and drug–DNA interactions were analysed along with gene expression studies for p53, Bax‐Bcl2, cytochrome c, the caspase cascade genes and PARP.
Results
Flavonol reduced A549 cell viability in a dose‐ and time‐dependent manner (IC50 value = 7.6 ± 0.05 μg/ml following 48 h incubation) sparing normal L‐132 cells. It effected G2‐M phase cell cycle arrest and apoptosis, as indicated by progressive increase in the sub‐G1, annexin V and TUNEL‐positive cell populations. Apoptotic effects appeared to be mitochondria‐dependent, caspase‐3‐mediated, but ROS‐independent. Analysis of circular dichroism data revealed that flavonol intercalated with nuclear DNA. In vivo studies on non small cell lung carcinoma (NSCLC)‐induced mice confirmed anti‐cancer potential of flavonol.
Conclusion
Flavonol‐induced apoptosis apparently resulted from intercalation of cells' nuclear DNA. Flavonol inhibited growth of induced lung tumours in the mice, indicating its potential as an effective agent against NSCLC.
Introduction
Targeted therapy based on genetic makeup of a tumour plays an emerging role in anti‐lung cancer drug design. Development of oncogenic mutation in non‐small cell lung carcinoma (NSCLC) cells makes them more adaptive, proliferative and fit to grow in all adverse conditions, defying all attempts towards chemopreventive measures. Among them, K‐ras mutations are more frequent in NSCLC 1. With this mutation, tumour cells constitutively activate synthesis of mutated K‐ras protein that continuously stimulates related downstream signalling molecules such as EGFR, PI3K, and more. Because of this, K‐ras mutated NSCLC patients tend to be resistant to EGFR and PI3K targeted therapeutic agents such as erlotinib and gefitinib 2. These critical regulations of K‐ras mutated NSCLC cells give such patients poor prognosis.
At present in anti‐cancer research, ability of an anti‐cancer drug to interact directly with nuclear DNA is considered to be an added advantage 3. Such a drug would then gain potential to modulate several downstream molecules including pro‐apoptotic ones 4, 5, avoiding interference with some constitutively activated proteins such as K‐ras that might otherwise interfere with the drug's action. Redox regulation and stress balance have also been shown to be important components for cancer cell survivability 6. Thus, through pharmacologic intervention, efforts are directed towards producing oxidative stress imbalance, so that drugs endowed with such a capability can elevate cytotoxicity and induce apoptotic cell death.
Thuja occidentalis, an ornamental plant that grows in north‐eastern areas of the United States and in south eastern parts of Canada is known to contain 1.4–4% essential oils, flavonoids, coumarins, tannic acid and more. 7, 8. In an earlier study, we reported that thujone, a major essential oil‐rich fraction isolated from Thuja occidentalis had apoptotic effects on the skin melanoma A375 cell line 9. Ethanolic extract of Thuja occidentalis also was shown to exert anti‐proliferative and pro‐apoptotic activity on the NSCLC A549 cell line 10. Thereafter, we became interested in testing whether active components could be separated and tested for possible preferential anti‐cancer potential without significantly affecting normal cells.
In the study described here, we isolated flavonol from ethanolic leaf extract of Thuja occidentalis. Our main objective was to evaluate and elucidate its anti‐cancer potential, if any, against A549 cells that bear several target‐based therapeutic limitations due to K‐ras gene mutation at its 12th codon 11. Furthermore, if the target area of this fraction in DNA intercalation could be highlighted, it would be more meaningful for future drug design. Anti‐cancer potential of flavonol was also tested by studying its possible ability to inhibit benzo[a]pyrene‐induced non‐small cell lung tumour growth in a mouse model, so that a more comprehensive assessment could be made to rate its candidature in future drug formulation against NSCLC.
Materials and methods
Reagents
Dulbecco's modified Eagle's medium (DMEM), foetal bovine serum (FBS), penicillin, streptomycin, neomycin (PSN) antibiotic, trypsin and ethylenediaminetetraacetic acid (EDTA) were purchased from Gibco BRL (Grand Island, NY, USA). Tissue culture plastic wares were obtained from BD Bioscience (San Jose, CA, USA).
All organic solvents used were of HPLC grade. MTT [3‐(4, 5‐dimethyl‐thiazol‐2‐yl)‐2, S‐diphenyltetrazolium bromide], propidium iodide, colchicine, DAPI (4′, 6‐diamidino‐2‐phenylindole), rhodamine 123, MitoRed, 2′,7′ dihydrodichlorofluorescein diacetate (H2‐DCFDA), glutathione reductase (GSH), calf thymus DNA, benzo[a]pyrene were purchased from Sigma Aldrich (St. Louis, MO, USA). Caspase‐3 inhibitor (Ac‐devd‐cho), annexin V‐FITC, anti‐p53, anti‐Bax, anti‐Bcl2, anti‐PARP, and anti‐GAPDH monoclonal antibodies were purchased from Santa Cruz Biotechnology Inc, Dallas, TX, USA. Primary antibodies to caspases ‐3,‐8,‐9, cytochrome c, and FITC‐conjugated secondary antibody were obtained from BD Bioscience. Anti‐BrdU antibody was procured from Abcam, Cambridge, MA, USA.
Isolation of flavonol from ethanolic leaf extract of Thuja occidentalis
Fresh leaves of Thuja occidentalis (1 kg) were collected and allowed to dry under shed. Dried leaves were then powdered and extracted successively with 65% ethanol by soxhlation for 24 h (Boiron Laboratory, Lyon, France). The product was then placed under vacuum and dry extract was obtained (yield 17.2% w/w), this was then mixed with petroleum ether (60–80 °C) (50 ml v/v) and miscible component was taken out and dried on a hot plate at 60 °C (yield ~1–2% w/w). After evaporation, the result was a semisolid brownish mass 12. Total mixture obtained was then mixed with a minimum quantity of silica gel (60–120 mesh) and loaded on to a silicic acid column (60–120 mesh) using n‐hexane and ethyl acetate as solvent system. Flavonol was collected at the polarity 8:2 (v/v) of n‐hexane: ethyl acetate (250 ml) mixture. We then purified it chromatographically using the same solvent system.
Preliminarily, after addition of 10% NaOH to that isolated fraction, a yellow colouration 13 was obtained, confirming it to contain flavonols. Thereafter, by mass spectral analysis, it was confirmed that it was actually a mixture, which primarily contained flavonols and in which 2‐(3,4‐dihydroxyphenyl)‐3,5,7‐trihydroxy‐4H‐chromen‐4‐one (molecular weight 302.23) and 3,5,7‐trihydroxy‐2‐(4‐hydroxyphenyl)‐4H‐chromen‐4‐one (molecular weight 286.23) commonly called quercetin and kaempherol, respectively, were identified as the major active components (Fig. 1a). In this study, the desired amount of isolated fraction was mixed with solvent media and sonicated using a probe sonicator, for use in subsequent experiments.
Figure 1.
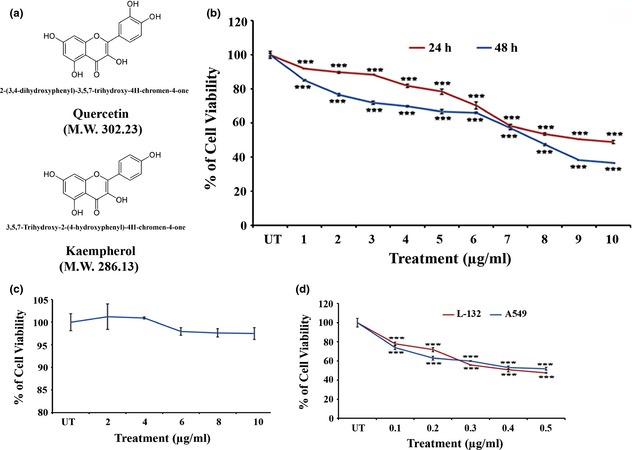
Active components of isolated flavonol and effect on cell viability. (a) Structure and molecular weight (M.W.) of active components of flavonol isolated from ethanolic leaf extract of Thuja occidentalis. (b) Effects of flavonol on viability of A549 (non small cell lung carcinoma) and L‐132 (normal lung embryonic cell) cell lines. 1–10 μg/ml of flavonol was supplemented in the culture and the cell viability of A549 (24 and 48 h of exposure) and (c) L‐132 cells (48 h of exposure) was determined by MTT assay. The values represented the mean ± SD of three independent experiments with six replicates in each. Statistical significance was considered at ***P < 0.001. (d) Cytotoxicity of cisplatin (0.1–1 μg/ml) on A549 and L‐132 cell line was assessed by MTT assay. Values represented the mean ± SD of three independent experiments with six replicates in each. Statistical significance was considered at ***P < 0.001.
Cell lines
Human non‐small cell lung carcinoma cell line A549 and human embryonic normal lung cell line L‐132, were collected from the National Centre for Cell Science, Pune, India. Cells of both lines were cultured in DMEM with 10% heat‐inactivated FBS and 1% antibiotic (PSN), and maintained at 37 °C with 5% CO2 in a humidified incubator. Cells were harvested with 0.025% trypsin and 0.52 mm EDTA in phosphate‐buffered saline, plated at required cell numbers and allowed to adhere for minimum ~24 h before treatment.
Treatment of isolated flavonol fraction and inhibitors
For MTT assay, the cells were exposed to flavonol fraction at 1 μg/ml to 10 μg/ml concentration at 37 °C, in DMEM supplemented with serum. As positive control, equal volume of medium was added to untreated cells.
Cisplatin concentrations of 0.1–1.0 μg/ml were used to determine IC50 values. For further cell viability assessment, N‐Ac‐Asp‐Glu‐Val‐Asp‐CHO (Ac‐devd‐cho) as caspase 3 inhibitor, ascorbic acid as reactive oxygen species scavenger and GSH were used at 50 and 300 μm concentrations, respectively, pre‐incubated for 2 h before drug treatment. For dose‐dependent study, three drug doses designated as D1 < IC50, D2 IC50, D3 > IC50 values were selected and used for subsequent experiments, unless otherwise specified.
Cell viability assay
Cell viability was determined using MTT assay. Briefly, A549 cells were seeded in 96‐well plates at 1 × 10³ cells per well and were allowed to settle for 24 h before treatment. Cells were then treated with flavonol (1–10 μg/ml) for 24 and 48 h with 5% CO2 at 37 °C. Cell viability was measured by MTT assay 14. Control values corresponding to untreated cells were taken as 100% and viability data of treated ones were expressed as percentage of controls. IC50 values were determined, as concentration that reduced cell viability by 50%. Drug dose of IC50 value at 48 h exposure was taken for further time‐dependent study. For dose‐dependent analyses, three drug doses (IC40 as D1, IC50 as D2 and IC60 as D3) were considered.
Cisplatin of preferred concentration (0.1–1 μg/ml) was used against A549 (NSCLC) and L‐132 (normal embryonic lung cell line) cell lines both to compare and to evaluate chemopreventive nature of flavonol vis‐à‐vis cisplatin as another arm of control.
To observe whether flavonol had cytotoxic effects on normal cells, we performed MTT assay taking cells from normal embryonic lung cell line L‐132. Flavonol doses of preferred concentrations were used to assess their effect on L‐132 cells.
Furthermore, caspase‐3 inhibitor (Ac‐devd‐cho), a reactive oxygen species (ROS)‐scavenger (ascorbic acid) and an antioxidant (GSH) were used to ascertain whether flavonol fraction acted in the pathway mediated by caspase‐3 and/or ROS.
Morphological analysis and DAPI staining
Cells (~2 × 10⁴) were plated in 40 mm culture dishes and allowed to proliferate for 24 h. Morphological analysis of cells was performed after flavonol treatment, by phase‐contrast microscopy (Leica, Wetzlar, Germany).
Cells were collected and fixed in 2% paraformaldehyde for 1 h. Thereafter, fixed cells were rinsed twice in PBS and stained with 10 μm DAPI for 30 min to determine by fluorescence microscopey, any chromosomal degradation (Zeiss Axiovert 40 CFL, Thornwood, NY, USA).
DNA fragmentation assay
1 × 10⁴ cells were treated with flavonol for 24, 36 and 48 h. DNA lysis buffer was used to lyse the cell pellets. These were then incubated overnight with proteinase K (0.1 mg/ml). DNA extraction was performed by routine phenol‐chloroform (1:1) method. Extracted DNA was separated in 2% agarose gel containing ethidium bromide (1 mg/ml) and visualized by UV trans‐illuminator.
Additionally, we performed DNA fragmentation assay after flavonol treatment along with caspase‐3 inhibitor (Ac‐devd‐cho, 50 μm), to confirm whether the mode of cell death was mediated by caspase‐3.
Analysis of apoptosis by flow cytometry using terminal deoxynucleotidyl transferase dUTP nick end labelling (TUNEL) assay
DNA strand breaks were analysed using the 5‐bromo‐2′‐deoxyuridine 5′‐triphosphate (BrdUTP) labelling method of Darzynkiewicz et al. 15 with slight modification. Briefly, ~2 × 10⁴ drug‐treated cells along with untreated ones, were fixed in 1% paraformaldehyde in phosphate‐buffered saline (PBS) for 15 min. Cells were then washed and labelled with DNA labelling solution containing terminal deoxynucleotidyl transferase (TdT) reaction buffer, TdT enzyme and BrdUTP, for 1 h at 37 °C. At the end of incubation, cells were rinsed and pellets were re‐suspended in mouse anti‐BrdU antibody solution (1:1000). Cells were then incubated with FITC‐conjugated mouse secondary antibody (1:500) for 30 min at 37 °C in the dark. After incubation, fluorescence emissions were analysed by flow cytometry [FACS calibur; BD Bioscience].
Annexin V binding assay
To ascertain and confirm cells undergoing apoptosis, we performed annexin V binding assay through flow cytometry. Briefly, cells were treated with flavonol for 12, 18 and 24 h, respectively. Thereafter, treated and untreated cells were harvested by trypsinization. Harvested cells were then incubated in annexin V‐FITC (100 ng/ml) and propidium iodide (50 μg/ml), at room temperature for 15 min in the dark, and analysed using a FACS Calibur flow cytometer (BD Bioscience) taking a minimum 10 000 cells in each sample 16.
Cell cycle analysis
Briefly, ~2 × 10⁴ cells were seeded and treated with flavonol for different times. Cells were then recovered, washed twice in cold PBS and fixed in 70% chilled ethanol. They were then washed twice in PBS, incubated for 1 h at room temperature with 100 μg/ml RNAse A. Thereafter, 50 μg/ml PI was added, and cells were incubated for 15 min in the dark, and were analysed using a FACS calibur flow cytometer (BD Bioscience). Colchicine (1 μg/ml) was used as treatment for 24 h, taken as a positive G2‐M phase cell cycle blocker. Ten thousand events were analysed for each sample using appropriate gating to select single cell population; the same gate was used for all samples.
Drug–DNA interaction study by circular dichroism (CD) spectral analysis
All CD spectra were recorded on a JASCO J720 CD spectrometer at 37 °C using 1 mm cuvette. Spectral recording was performed from 500 nm to 200 nm, repeated three times and averaged automatically.
Calf thymus DNA (ctDNA) concentration in experiments was 100 μm. Induced CD spectral reading was performed resulting from interaction of flavonol (IC50 dose) and ctDNA at 37 °C, obtained by subtracting CD spectrum of native DNA and mixture of both ctDNA and flavonol from the CD spectrum of buffer and spectra of both buffer and flavonol solutions, respectively.
For assessment of flavonol–nuclear DNA interaction, 2 × 10⁴ A549 cells were either left untreated or treated with flavonol (IC50 dose) for 2, 4, 6, 12, 18 and 24 h, respectively. After their consecutive time exposures, cells were collected and nuclear DNA was extracted and purified, using GeneiPure Mammalian Genomic DNA Purification Kit, Bangalore, India. Collected DNA of equal concentration was used to analyse CD spectra for determination of extent of bound drug with the nuclear DNA.
Intracellular ROS accumulation study
Levels of ROS generation in cells were assessed fluorometrically using 2′7′dihydrodichlorofluorescein diacetate (H2‐DCFDA, Molecular Probe). ~1 × 10³ cells were treated with the isolated fraction (IC50 dose) for 1–6 h, 12, 18, 24, 36 and 48 h or left untreated. Cells were then washed in PBS and further incubated with 10 μm H2‐DCFDA for 30 min at 37 °C in the dark. After incubation, cells were washed twice in PBS at room temperature for 5 min each. Fluorescence was measured at excitation and emission wavelengths of the oxidized form at 504 and 529 nm, respectively. Hydrogen peroxide (H2O2)‐treated cells were taken as loading control.
Determination of intracellular GSH content
We undertook spectrophotometric analysis to determine intracellular GSH content 17. Briefly, drug‐treated (1–6 h of exposure) and ‐untreated cells (~1 × 10³) were taken and cell extracts were prepared. 100 μl cell extract was added with 400 μl sulphosalicylic acid and after centrifugation, 500 μl supernatant was taken and mixed with 4.5 ml DTNB solution. Immediate measurement was taken against reagent blank (4.5 ml DTNB + 500 μl distilled water).
Mitochondrial membrane potential (ΔΨm) assay
Changes in ΔΨm after flavonol treatment were examined after 2, 4, 6, 12, 18 and 24 h time points. Changes in ΔΨm were examined by both fluorescence microscopy (Zeiss Axiovert 40 CFL) and flow cytometry using rhodamine 123 18. Mean fluorescence intensity was detected by FL1 channel of BD FACS calibur (BD Bioscience).
mRNA level expressions by semi‐quantitative reverse transcriptase‐polymerase chain reaction (RT‐PCR)
RT‐PCR was performed according to the method of Sarkar et al. 19 to evaluate mRNA expression levels of p53, Bax, Bcl2 after 12, 18 and 24 h of flavonol treatment. GAPDH was taken as housekeeping gene control. Fluorescence intensity of agarose gel bands was measured using ‘Image J’ software (National Institute of Health, Bethesda, MD, USA). Oligonucleotide (primer) sequences are provided in Table 1.
Table 1.
Primer sequences used for RT‐PCR
| Primer name | Primer sequences |
|---|---|
| Bax |
Fwd: 5′‐AGTAACATGGAGCTGCAGAGG‐3′ Rev: 5′‐ATGGTTCTGATCAGTTCCGG‐3′ |
| Bcl2 |
Fwd: 5′‐GTGACTTCCGATCAGGAAGG‐3′ Rev: 5′‐CTTCCAGACATTCGGAGACC‐3′ |
| P53 |
Fwd: 5′‐GGAAATTTGTATCCCGAGTATCTG‐3′ Rev: 5′‐GTCTTCCAGTGTGATGATGGTAA‐3′ |
| GAPDH |
Fwd: 5′‐CCATGTTCGTCATGGGTGTGAACCA‐3′ Rev: 5′‐GCCAGTAGAGGCAGGGATGATGTTC‐3′ |
Immunofluorescence studies for detection of cytochrome c and caspase‐3 activation
Both untreated and treated cells were washed in PBS and fixed in 1% paraformaldehyde for 1 h. They were washed again in PBS and incubated in anti‐caspase‐3 primary antibody (1:500) overnight at 4 °C. Next, samples were incubated in FITC‐conjugated secondary antibody (1:1000) for 2 h at 4 °C and visualized using fluorescence microscopy (Zeiss Axiovert 40 CFL).
For cytochrome c translocation assay, cells were incubated in MitoRed (200 nm) solution at 37 °C for 30 min to stain mitochondria. Thereafter, cells were washed in PBS and fixed in 1% paraformaldehyde for 1 h. Samples were then incubated in anti‐cytochrome c antibody (1:500) overnight at 4 °C and further incubated with FITC‐conjugated secondary antibody (1:1000) for 2 h at 4 °C. Specimens were then visualized using fluorescence microscopy (Zeiss Axio Scope A1).
Cell extract and protein isolation; preparation of cytosolic and mitochondrial extracts
Cells (~5 × 10⁵) were plated in 90 mm culture dishes and were allowed to proliferate for 48 h. Following flavonol treatment, cells were collected and washed twice in ice‐cold PBS. They were then lysed in 20 μl of ice‐cold lysis buffer, made up of 10 mm Tris–HCl, pH 7.5, 1 mm MgCl2, 1 mm EDTA, 0.1 mm PMSF, 5 mm β‐mercaptoethanol, 0.5% CHAPS, and 10% glycerol. Cells were incubated for 30 min on ice and centrifuged for 30 min at 5000 g at 4 °C. After centrifugation, supernatant was collected and stored at −20 °C for further use.
To carry out cytochrome c translocation studies, cell subfractionation was performed and mitochondrial and cytosolic proteins were isolated as previously reported by Phaneuf et al. 20 with minor modifications.
Indirect ELISA for activity measurement of different proteins
Equal amounts of protein (30 μg) were taken and indirect ELISA in both mitochondrial and cytosolic proteins was performed for cytochrome c translocation. We also assayed caspase‐8 and caspase‐9 activities by the indirect ELISA method according to the manufacturer's protocol (Santa Cruz Biotechnology Inc, USA) and quantified them using an ELISA reader (Thermo Scientific, Rockford, IL, USA). We used paranitrophenylphosphate (pNPP) as a colour‐developing agent and measured colour intensity in 405 nm wavelength.
Western blot analysis
For western blot analyses, equal amounts (70 μg) of protein were loaded and samples were denatured in 12% SDS‐PAGE for p53, PARP and 15% SDS‐PAGE for Bax, Bcl2, cytochrome c and caspase‐3. Separated proteins were transferred individually on to PVDF membranes and were probed with anti‐p53 (1:500), anti‐Bax (1:500), anti‐Bcl2 (1:500), anti‐cytochrome c (1:1000), anti‐caspase‐3 (1:1000) and anti‐PARP (1:1000) primary antibodies overnight at 4 °C, followed by 1 h incubation with ALKP‐conjugated secondary antibody (1:500); they were developed using BCIP‐NBT. GAPDH (1:1000) was used as housekeeping gene control. Quantification of proteins was performed by densitometry using Image J software. Immunoblots of proteins of interest were analysed in three separate sets of experiments.
Animals
We housed a large group of healthy inbred Swiss albino mice (Mus musculus) (6–8 weeks; body weight – 20–25 g) for at least 14 days, in an environmentally controlled room (temp 24 ± 20 °C, humidity 55 ± 5%, 12 h light/dark cycle) with access to food and water ad libitum. Experiments were conducted under supervision of the Animal Welfare Committee of the Department of Zoology and as per approved ethical committee guidelines of the Institutional Ethical Committee, University of Kalyani (vide‐892/OC/05/CPCSEA).
Acute toxicity studies in mice
For acute toxicity testing, mice (n = 6) were fed 25, 50, 100, 150, 200 mg/kg body weight (bw) of flavonol dissolved in its solvent media. We watch for signs of mortality, clinical signs and behavioural changes in mice for 24 h for any sign of acute toxicity.
In vivo anti‐tumour activity
The Swiss albino mice (Mus musculus) were randomized and healthy individuals weighing between 20 and 25 g were selected for the experiment. Benzo[a]pyrene (a carcinogen – dissolved in olive oil – induces non‐small cell lung carcinoma) at a dose of 50 mg/kg body weight was fed to the animals for one month, twice a week, to develop lung tumours in 4 months 21. Thereafter, flavonol at a dose of 100 mg/kg body weight was fed daily along with the carcinogen for a further 4 months. Six other mice received the carcinogen only, but no drug. Thus, the following five groups served as materials of the present study:
Group 1: Flavonol only‐treated group: animals received only flavonol.
Group 2: Normal control: animals received no treatment and only standard food and water.
Group 3: Olive oil only‐fed group: received only olive oil.
Group 4: Benzo[a]pyrene fed group: animals received benzo[a]pyrene dissolved in olive oil at a dose of 50 mg/kg body weight twice a week for one month.
Group 5: Flavonol‐treated group (carcinogen + flavonol): animals received drug at a dose of 100 mg/kg body weight. Drug was fed orally for 4 months once daily along with carcinogen for first 1 month.
Flavonol only‐fed mice (group 1) were considered for toxicity analysis, if any, and thereafter, this group was excluded from further in‐depth studies.
Photographs were taken and tumour lengths were calculated and expressed in mm.
Statistical analysis
All the data reported were the arithmetic mean of data of independent experiments performed in triplicate where each group was six in number. Results were expressed as mean ± SD (standard deviation), unless otherwise stated. Statistical analysis was made by the one‐way analysis of variance (ANOVA) with LSD post‐hoc test using SPSS 16 software (IBM Corporation, Armonk, NY, USA) and paired Student's t‐test using GraphPad QuickCalcs software. Statistical significance was considered at *P < 0.05, **P < 0.01, ***P < 0.001.
Results
Flavonol reduces A549 cell viability
Flavonol reduced A549 cell viability in a dose‐ and time‐dependent (Fig. 1b) manner with IC50 values of 9.34 ± 0.06 μg/ml and 7.6 ± 0.05 μg/ml at 24 and 48 h exposure, respectively (Table 2). After 48 h flavonol exposure, doses were determined to be 5.8 μg/ml as IC40, 7.6 μg/ml as IC50 and 9.4 μg/ml IC60.
Table 2.
IC 50 values of flavonol and cisplatin for A549 and L‐132 cell line
| Compounds | Cell lines A549 (NSCLC) | L‐132 (Normal lung cell line) |
|---|---|---|
| FRF |
9.3 ± 0.06 μg/ml (24 h of treatment) 7.6 ± 0.05 μg/ml (48 h of treatment) |
Not determined |
| Cisplatin |
0.44 ± 0.001 μg/ml (24 h of treatment) |
0.41 ± 0.006 μg/ml (24 h of treatment) |
Cytotoxic activity of flavonol was determined in A549 and L‐132 cell line for 24 and 48 h of exposure. Cisplatin activity against A549 and L‐132 cell line was determined after 24 h of exposure. All the data are representative of three similar experiments and values are presented as mean ± SD.
In contrast, flavonol displayed a non‐significant cytotoxic effect on normal human lung fibroblast cell line L‐132 (Fig. 1c). Moreover, when we exposed both A549 and L‐132 cells to cisplatin at 0.1–1 μg/ml, pronounced cytotoxicity occurred by 24 h to both cell lines, inducing almost 50% cell death at 0.44 ± 0.001 and 0.41 ± 0.006 μg/ml, respectively (Fig. 1d). Thus, the drug had a preferential cytotoxic effect on cancer cells while having negligible cytotoxic effects on normal cells.
Flavonol induced A549 cell and nuclear morphological changes
Detectable changes were found after 48 h in A549 cells treated with different doses of flavonol, including altered cell morphology, cell shrinkage and membrane blebbing, the characteristic features of apoptotic cell death (Fig. 2a). After staining with DAPI, chromatin condensation and DNA nick generation were observed in A549 cells specially after long flavonol exposure, initiated after 24 h (Fig. 2b).
Figure 2.
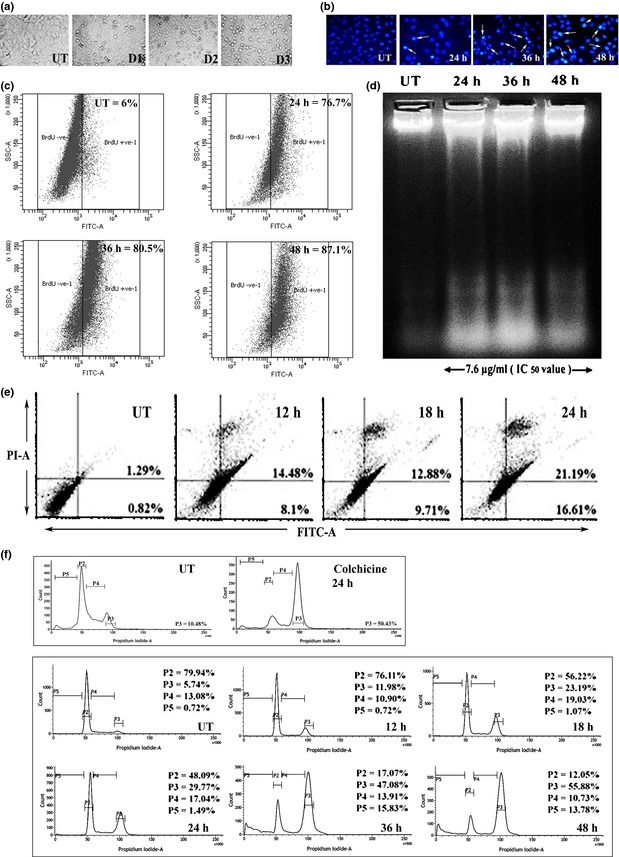
Flavonol‐induced cell cycle arrest and apoptosis in A549 cells. (a) Cell morphology assay was performed after A549 cells were treated with 5.8 μg/ml (IC 40), designated as dose 1 (D1), 7.6 μg/ml (IC 50), designated as dose2 (D2), 9.4 μg/ml (IC 60), designated as dose3 (D3) of flavonol and incubated for 48 h. (b) Internucleosomal DNA fragmentations of A549 cells after 7.6 μg/ml of flavonol treatment for 24, 36 and 48 h were assessed after DAPI staining. Nicked DNA with brighter fluorescence was indicated by white arrows. (c) TUNEL assay was performed. 6% (UT), 76.7% (24 h), 80.5% (36 h) and 87.1% (48 h) cell populations were found to be TUNEL‐positive. (d) DNA fragmentation assay was performed. In drug‐treated lanes (24, 36 and 48 h, respectively), DNA ladder reflected the presence of fragmented DNA, whereas untreated cells showed intact nuclear DNA in the 1st lane. (e) A549 cells were treated with 7.6 μg/ml of flavonol for 12, 18 and 24 h, then stained with Annexin V‐FITC and PI and FACS analysis was performed. The number of Annexin V‐positive cells was determined and the percentage was represented in lower right quadrant (Annexin V+/PI−) and upper right quadrant (Annexin V+/PI−). (f) Cell cycle analysis was performed after treatment of A549 cells with flavonol for 12, 18, 24, 36 and 48 h. The percentage of cells in sub‐G1 (apoptotic) was designated as P5, GO‐G1 as P2, and G1‐S as P4 and G2‐M as P3. Colchicine (1 μg/ml) was treated for 24 h and was taken as a positive G2‐M phase blocker.
Flavonol induced DNA fragmentation
Significant numbers of TUNEL‐positive cells were present after flavonol treatment, in a time‐dependent manner (Fig. 2c). DNA fragmentation assay also revealed that flavonol treatment could bring about DNA laddering, indicative of apoptotsis (Fig. 2d).
Flavonol initiated apoptosis by phosphatidylserine exposure
Translocation of phosphatidylserine (PS) to external surfaces of plasma membranes is a characteristic feature of early apoptosis, which can be detected by binding to annexin V‐FITC. If cell death occurs, fragmented DNA becomes permeable for binding with PI 22. Flow cytometric analysis revealed progressive increase in annexin V‐FITC‐positive population of cells compared to untreated controls (Fig. 2e). This suggests an early state of drug‐induced apoptosis.
Flavonol blocked proliferation of A549 cells by arresting the cell cycle
Flow cytometric analysis indicated G2‐M block in flavonol‐treated cells along with significant increase in the sub‐diploid cell population (sub‐G1), in a time‐dependent manner (Fig. 2f). By this, uncontrolled cell proliferation was reduced. Onset of G2‐M cell cycle arrest along with increase in the sub‐diploid cell population (sub G1) suggests that the isolated fraction was potent enough to induce both G2‐M phase cell cycle arrest and apoptosis.
Flavonol intercalated with DNA as revealed from CD spectral analysis
CD spectroscopic results revealed that isolated flavonol intercalated with native B‐conformation of both ctDNA and nuclear DNA. The interaction was more pronounced in A549 DNA with higher time intervals of flavonol exposure. Observed CD spectrum of both ctDNA (Fig. 3a) and nuclear DNA (Fig. 3b) consisted of a positive band at around 275 nm (ctDNA‐flavonol), 267–275 nm (nuclear DNA‐flavonol) and a negative band at around the position of 245 nm (ctDNA‐flavonol) and 240–245 nm (nuclear DNA‐flavonol). Band intensities were observed to gradually change upon drug treatment, indicating positive drug–DNA intercalation.
Figure 3.
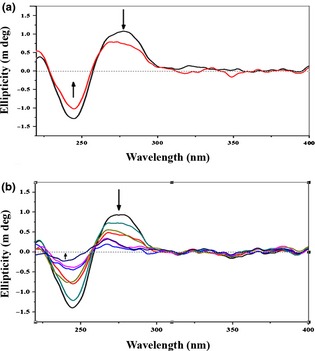
Drug– DNA interaction study by Circular dichroism ( CD ) spectral analysis. (a) The calf thymus DNA (100 μm) interacted with flavonol (7.6 μg/ml). A positive band at around 275 nm, which was decreased after flavonol treatment (indicated by downward black arrow), and a negative band at around the position of 245 nm, which was increased after treatment (indicated by upward black arrow) were observed. Uppermost curve in black indicated untreated calf thymus DNA and the curve in red was of flavonol‐treated calf thymus DNA. (b) A549 cells left untreated or treated with flavonol (7.6 μg/ml) for 2, 4, 6, 12, 18 and 24 h. Thereafter, nuclear DNA was isolated, purified and interaction with flavonol was ascertained. Nuclear DNA displayed a positive signal at around 267–275 nm, which was decreased after increasing time of flavonol exposure (indicated by downward black arrow), and a negative signal at around 240–245 nm, which was increased after flavonol treatment (indicated by upward black arrow), was observed. Downward spectral curves indicated their respective time intervals of flavonol exposure, whereas the uppermost curve in black indicated the curve of untreated nuclear DNA.
Flavonol induced apoptosis in an ROS‐independent manner
Fluorometric results revealed that flavonol in short exposures (1–6 h) and also in long exposures (12, 18, 24, 36 and 48 h respectively) did not elevate significant intracellular ROS levels (Fig. 4a). Using ROS inhibitor ascorbic acid (300 μm), pre‐treated for 2 h, significant changes in viability of flavonol‐treated cells were observed (Fig. 4b). Analysis of enzymatic data reveal that flavonol was not able to deplete intracellular GSH level (Fig. 4c) fully, but could only partially deplete it, specially by 2–5 h exposure. Thereafter, when cells were pre‐treated with extraneous GSH (300 μm) along with flavonol treatment, their viability was found to be reduced (Fig. 4d). The redox state therefore was not easily dysregulated by a ROS‐mediated pathway needed by cells for apoptosis.
Figure 4.
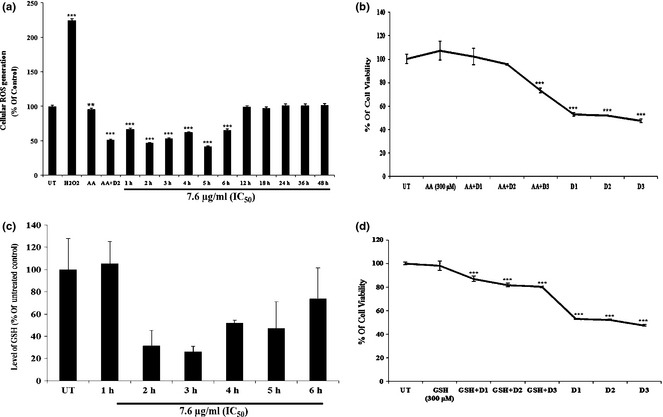
Effect of flavonol on ROS generation and GSH activity. (a) A549 cells were either kept untreated or treated with flavonol for 1–6 h, 12, 18, 24, 36 and 48 h of exposure. Intracellular ROS generation was measured fluorometrically after staining with DCFDA. Data are expressed as percentage of control and presented as mean ± SD. **P < 0.01, ***P < 0.001 were considered statistically significant. (b) A549 cells were kept untreated or pre‐treated with ascorbic acid (300 μm) for 2 h. Cells were then treated with different drug doses. Flavonol drug dose 1, designated as D1 was 5.8 μg/ml, drug dose2 designated as D2 was 7.6 μg/ml, drug dose 3 designated as D3 was 9.4 μg/ml. Flavonol was cytotoxic in ascorbic acid pre‐treated cells. Data are expressed as percentage of control and presented as mean ± SD. ***P < 0.001 was considered statistically significant. (c) Glutathione reductase (GSH) level was determined in untreated and flavonol (1–6 h of exposure)‐treated cells. Data are presented as mean ± SD. **P < 0.01 was considered significant. (d) GSH (300 μm) did not interfere with flavonol‐induced cytotoxicity induction at different doses (mentioned earlier). All the data are expressed as percentage of control and presented as mean ± SD. ***P < 0.001 was considered statistically significant.
Flavonol altered mitochondrial membrane potential and translocated cytochrome c
From ELISA assays, we found significant time‐dependent increase in caspase‐9 activity specially at long exposures (after 24 h) to drug induction, whereas caspase‐8 was found to have non‐significant activation (Fig. 5a). These data indicate that apoptosis triggered by flavonol may be through the mitochondria‐mediated intrinsic pathway.
Figure 5.
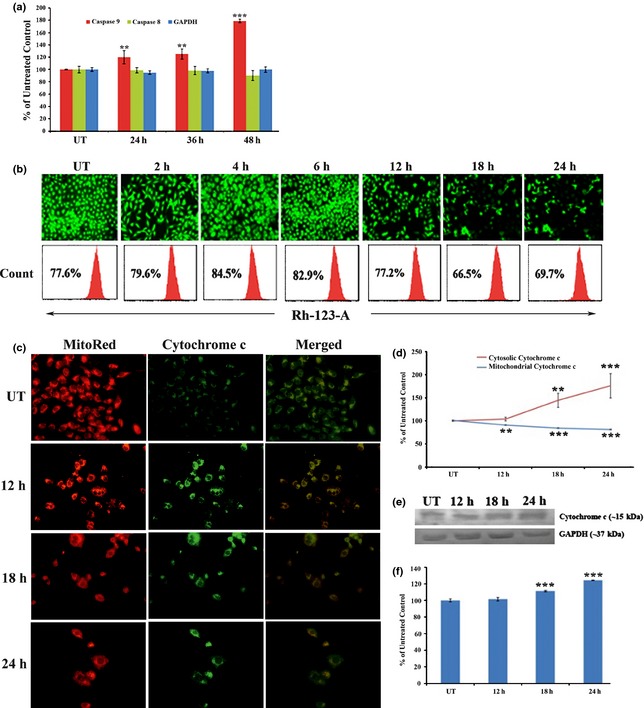
Effect of flavonol on mitochondria‐mediated intrinsic cell death pathway. (a) A549 cells were treated with flavonol for 24, 36 and 48 h. Indirect ELISA of caspase‐8,‐9, GAPDH was done. Data are represented as per cent of control and are presented as mean ± SD. **P < 0.01, ***P < 0.001 was considered statistically significant. (b) A549 cells were left untreated or treated with flavonol for 2, 4, 12, 18 and 24 h of exposure and stained with Rhodamine123. Microscopic observation was performed under fluorescence microscope and mean fluorescence intensity of rhodamine 123 was measured by FACS analysis. (c) Effect of flavonol on cytoplasmic release and activation of cytochrome c. A549 cells were treated with flavonol for 12, 18 and 24 h and cytochrome c expression was detected by immunofluorescence assay after dual staining with MitoRed and FITC‐tagged secondary antibody specific for cytochrome c. Increased expression was observed with brighter fluorescence of cytochrome c in the cytoplasmic portion. (d) Cytochrome c translocation assay was performed. Data are represented as percentage of control and mean ± SD. **P < 0.01, ***P < 0.001 was considered statistically significant. (e) Western blot analysis of cytochrome c and GAPDH was performed. GAPDH was used for loading correction. (f) Band intensities of cytochrome c were calculated. Data are represented as percentage of control and are presented as mean ± SD. ***P < 0.001 was considered statistically significant.
A key step of the intrinsic pathway is alteration in mitochondrial membrane potential and release of cytochrome c into the cytosol, which turns on the caspase cascade 20. As shown in Fig. 5b, increase in mitochondrial permeability transition occurred accompanied by collapse/depolarization of mitochondrial membrane potential, significantly, at around 12–24 h after being hyperpolarized at 2–6 h of drug exposure.
From the immunofluorescence study, upregulation of cytochrome c expression in the cytosol was observed (Fig. 5c). ELISA analysis confirmed increased expression of cytochrome c in the cytosolic fraction, whereas its expression declined in the mitochondrial fraction (Fig. 5d) after drug induction, suggesting cytosolic translocation of cytochrome c. Expression of COX‐4, used as loading control for mitochondrial proteins, was the same in mitochondria even after drug treatment, whereas no COX‐4 expression was detected in the cytosolic fraction (data not shown). This would indicate that we had successfully separated mitochondrial and cytosolic fractions of cell lysate. Furthermore, western blot data also revealed significant upregulation of cytochrome c in the cytosolic fraction (Fig. 5e,f) by 12–24 h drug exposure.
Flavonol modulated A549 gene and protein expressions related to cell death
From RT‐PCR and western blot analysis, we observed upregulation of Bax and downregulation of Bcl2 along with overexpression of p53, after 12, 18, 24 h flavonol treatment (Fig. 6a–d). Bcl2/Bax imbalance (Fig. 6e) and p53 upregulation were coincident with cytochrome c release. These data are indicative of caspase cascade activation with long time period drug exposure.
Figure 6.
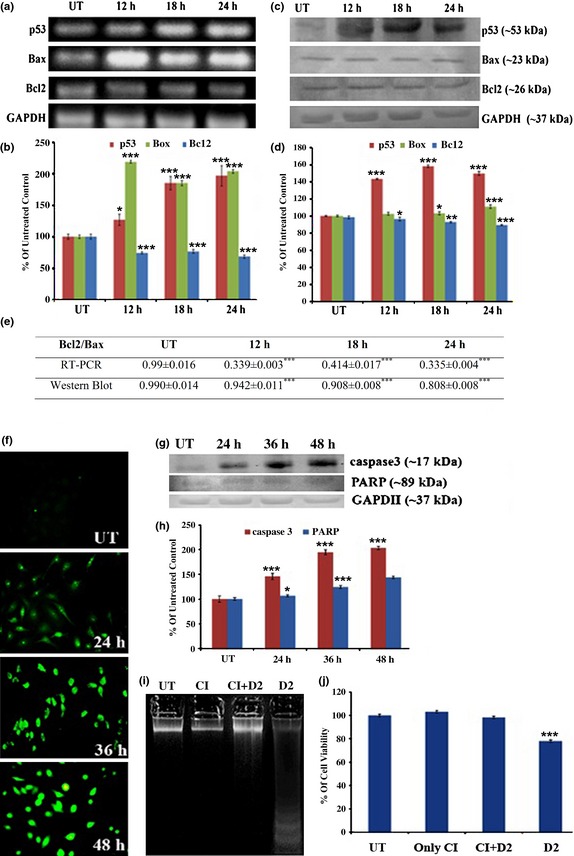
Flavonol‐induced gene expression analysis. A549 cells were left untreated or treated with optimum dose of flavonol for 12, 18 and 24 h and (a) RT‐PCR of p53, Bax, Bcl2 and GAPDH was performed. GAPDH was used as loading control. (b) Relative band intensities of p53, Bax and Bcl2 were calculated. Values are represented as percentage of control and presented as mean ± SD. *P < 0.05 and ***P < 0.001 were considered statistically significant. (c) Western blot analysis of p53, Bax, Bcl2, GAPDH was performed. GAPDH was used as loading control. (d) Relative band intensities of p53, Bax and Bcl2 were calculated. Values are represented as percentage of control and presented as mean ± SD. *P < 0.05, **P < 0.01, ***P < 0.001 were considered statistically significant. (e) Bcl2/Bax ratio at both gene and protein levels was calculated. Results are presented as mean ± SD. ***P < 0.001 was considered statistically significant. (f) A549 cells were treated with flavonol and caspase‐3 activities were detected by immunofluorescence assay. (g) Western blot assay of caspase‐3, PARP, GAPDH was performed. GAPDH was used for loading correction. (h) Relative band intensities of caspase‐3 and cleaved PARP fragment was measured. Data are represented as per cent of control and presented as mean ± SD. *P < 0.05, ***P < 0.001 were considered statistically significant. (i) A549 cells was either kept untreated or treated with 7.6 μg/ml of flavonol after pre‐treatment of caspase‐3 inhibitor (CI) Ac‐devd‐cho (50 μm, 2 h) or treated with only flavonol (drug dose 2, i.e. D2 = 7.6 μg/ml). Thereafter, DNA fragmentation assay was performed. Untreated cellular DNA, only caspase‐3 inhibitor‐treated cellular DNA and flavonol‐treated cellular DNA, pre‐treated with caspase‐3 inhibitor showed no internucleosomal DNA fragmentation, whereas only flavonol‐treated ones induced DNA fragmentation. (j) Cell viability assay was analysed. Cells when pre‐treated with caspase‐3 inhibitor and thereafter exposed to flavonol did not show any reduction in viability, whereas only flavonol‐treated cells showed. Data are represented as percentage of control and presented as mean ± SD. ***P < 0.001 was considered statistically significant.
Flavonol promoted activation of caspase‐3
The immunofluorescence study indicated upregulated expression of caspase‐3 by 24–48 h drug exposure (Fig. 6f). From western blot analysis, we also observed upregulated expression of cleaved caspase‐3 at 17 kDa and a cleaved PARP fragment at 89 kDa (Fig. 6g,h).To explore whether flavonol‐induced apoptosis was specifically associated with caspase‐3‐mediated pathways or not, we exposed cells to 7.6 μg/ml flavonol along with caspase‐3‐specific inhibitor, Ac‐dvd‐cho (50 μm). Intact cell DNA with no internucleosomal fragmentation (Fig. 6i) and greater cell viability (Fig. 6j) were found after drug exposure along with caspase‐3 inhibitor. This would tempt one to suggest that apoptosis may be mediated via activation of caspase‐3.
Flavonol was relatively non‐toxic to mice in vivo
No significant changes in mortality, occurrence of abnormal clinical signs, symptoms, gain or loss of body weight, organ weight or similar signs were observed in respect of acute toxicity analysis of flavonol, in mice (group 1) in vivo. Partial signs of behavioural change were observed, specially by the dose of 200 mg/kg bw of flavonol. Thus, we preferred to use 100 mg/kg body weight as the optimum dose of flavonol for further study.
Flavonol inhibited benzo[a] pyrene‐induced lung tumour growth in mice
The capability of flavonol to induce apoptosis in A549 NSCLC cell line in vitro suggested that it might have the ability to suppress tumour growth in vivo. To ascertain this, Swiss albino mice were induced to become NSCLC hosts by treatment with benzo[a]pyrene (50 mg/kg bw) followed by feeding with flavonol at optimum dose (100 mg/kg bw). Flavonol inhibited benzo[a]pyrene‐induced non‐small cell lung tumour growth in a significant manner. Tissue architecture and lung morphology tended to be gradually normalized (Fig. 7a), showing signs of significant regression of tumour numbers and sizes of lesions (Fig. 7b).
Figure 7.
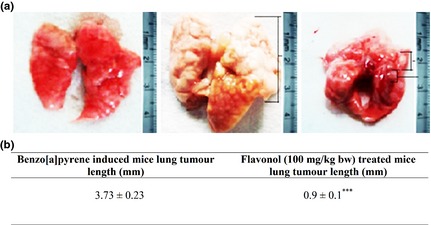
Effect of flavonol on lung tumour growth reduction, in vivo . (a) Lung morphology of normal, Benzo[a]pyrene (50 mg/kg body weight)‐induced and flavonol (100 mg/kg body weight)‐treated mice. (b) Lung tumour length (mm) of Benzo[a]pyrene‐induced group and flavonol‐treated group was measured. Tumour length differences between Benzo[a]pyrene‐induced group and flavonol‐treated ones were significant, considering ***P < 0.001, by paired Student's t test.
Discussion
Results show that isolated flavonol fraction was a highly potent agent, which reduced A549 cell viability in a dose‐ and time‐dependent manner. More importantly in our study, L‐132, normal human embryonic lung cells exposed to flavonol, showed no significant cell death. However, when L‐132 or the A549 cells were separately exposed to cisplatin (common anti‐cancer agent used in the treatment of lung cancer), both types of cell died in significantly high numbers. Flow cytometry studies revealed that this cytotoxic effect of flavonol against A549 cells was by apoptosis, as a good number of the cell population had annexin‐V positivity early in treatment (12–24 h), and inter‐nucleosomal DNA fragmentation with TUNEL positivity with longer (24–48 h) exposure. Thus, apoptotic induction by flavonol was found to be very much target‐specific and chemo‐preventive.
To explore underlying mechanisms of flavonol‐induced apoptosis, we analysed expression of signal proteins related to apoptosis. The caspase protein cascade, specially caspase‐3, plays a central role in apoptosis ‐ which is responsible for DNA fragmentation 23. From western blot data, we showed positive activation of caspase‐3 (17 kDa fragment) with long exposure. Furthermore, using caspase‐3 inhibitor (Ac‐dvd‐cho), we did not find any internucleosomal DNA fragmentation in flavonol‐exposed cells; therefore, it can be concluded that flavonol‐induced apoptosis was mediated by caspase‐3. We also obtained high expression of cleaved PARP fragment (89 kDa), which indicates activation of the caspase‐3‐mediated downstream signalling pathway that leads to DNA fragmentation. Elmore, 2007 24, in an earlier study, suggested that caspase‐3 is generally activated by caspase‐8 and caspase‐9 mainly through two main pathways of apoptosis, the extrinsic pathway (receptor‐mediated) and the intrinsic pathway (mitochondria‐mediated). However, from results of the ELISA assay performed in the present study, we observed a significant increase in caspase‐9 expression, but there was no increase in caspase‐8. This would possibly indicate that flavonol might act possibly through the mitochondrial intrinsic pathway of apoptosis.
In the intrinsic pathway of apoptosis, mitochondria play a central role 25. Disruption of mitochondrial membrane potential (ΔΨm) is known to induce release of cytochrome c into the cytosol. Release of cytochrome c along with Apaf‐1 allows formation of the apoptosome complex and activates caspase‐9 26. Activated caspase‐9 then cleaves and activates effector caspases such as caspase‐3, which executes the ultimate apoptotic process 23, 27. Our flow cytometry studies detected that after hyperpolarization during the period from 2 to 6 h, mitochondrial membranes depolarized, mainly by 12–24 h drug exposure. Thereafter, immunofluorescence study, ELISA assay and western blot analysis revealed translocation of cytochrome c from mitochondria to the cytosol and its significant upregulation in the cytosolic fraction at 18–24 h drug exposure. All these data collectively confirm that apoptotic induction by flavonol is possibly mitochondria‐mediated.
Release of cytochrome c from mitochondria into the cytosol is known to be regulated by pro‐ and anti‐apoptotic Bcl2 family proteins, which regulate mitochondrial membrane permeability and polarization 28. From RT‐PCR and western blot studies, we obtained evidence of significant Bax upregulation and Bcl2 downregulation after flavonol exposure, indicating thereby an ultimate imbalance of Bcl2/Bax ratio leading cells to apoptosis, through induction of alteration in mitochondrial membrane potential, which in turn causes cytochrome c release.
Balance between oxidative stress and antioxidative forces helps in maintaining cell homoeostasis. Interfering force disrupting this balance when a shift in redox state of a cell occurs may play a mediating role in apoptotic induction 6, 29. Proper balance between generation of free radicals such as reactive oxygen species (ROS) and generation of its scavenger antioxidants, helps in maintaining the homoeostatic state. From quantitative data, we confirmed that ROS did not increase significantly, but there was depletion of major antioxidant such as GSH early (2–5 h) in drug exposure. On the other hand, ascorbic acid, a potent ROS scavenger 30, and glutathione reductase (GSH) were unable to interfere with flavonol‐induced apoptosis; this would indicate that although the drug was able to deplete GSH levels, apoptosis was possibly induced by flavonol by a ROS‐independent pathway and not fully dependent on antioxidant depletion. As flavonol bears such ROS inhibitory capacity, it may be effective as an anti‐cancer drug against any carcinogen that exerts its effect through ROS generation pathways.
Drugs which intercalate with DNA are known to trigger apoptosis effectively 4. From circular dichroism spectral analysis, we observed that flavonol intercalated with nuclear DNA of A549 cells from early exposure, as well as with calf thymus DNA, which was considered as the experimental control. From RT‐PCR and western blot data, we found time‐dependent upregulation of p53 after flavonol exposure. This observation would tempt one to suggest that upregulation of p53 was possibly caused by DNA damage through intercalation of flavonol with DNA, in conformity with the proposition of Lakin and Jackson, 1999 31 for a similar result. Haupt et al. 32 have suggested that upregulation of p53 helps in induction of the apoptotic pathway to a further extent, which might in turn result in the reduction in proliferation of A549 cells by arresting the cell cycle at the specific stages observed in this study.
Cell cycle analysis further showed that cells arrested in G2‐M phase of the cell cycle along with an increment in sub‐diploidal cell population (sub‐G1) after flavonol induction, in a time‐dependent manner. This result indicates that flavonol served dual functions: apoptosis and cell cycle arrest, when A549 cells were exposed to it, thereby reducing uncontrolled cell proliferation. However, this dual response might possibly happen because flavonol–DNA intercalation at the early stages, resulting in a late response in subG1 cell accumulation along with G2‐M stage arrest.
Moreover, as flavonol has cell proliferation reduction and apoptotic properties, we conducted a standardized study on its effects by applying it in the murine body system. Benzo[a]pyrene‐induced lung tumour‐bearing mice, when treated with flavonol at optimum dose of 100 mg/kg bw, had significantly reduced tumour growth, proliferation and improved tissue architecture. Administration of drug alone at that optimum dose neither showed any acute toxic symptoms nor produced any behavioural changes in the animals.
Overall data collectively suggest that flavonol was non‐toxic to normal cells, but acted as a chemopreventive agent, which selectively triggered G2‐M phase cell cycle arrest and apoptotic cell death in K‐ras‐mutated NSCLC cell line A549. Apoptosis appeared to be ROS‐independent, mitochondria‐dependent and caspase 3‐mediated. At early stages of exposure, flavonol targeted nuclear DNA rather than relevant signalling molecules, which may render it to be an advantage over other drugs, in producing desired anti‐cancer effects. In that case, interference of any relevant signalling molecule, particularly such as K‐ras which is mutated in A549 cells, could be strategically avoided. Moreover, as the flavonol‐induced apoptotic pathway is ROS‐independent, it may be extrapolated that this flavonol may act as a putative agent in combating several carcinogens, as many of them elicit their carcinogenicity by elevating cell ROS level. Beside this, the isolated fraction of flavonal proved to be non‐toxic in mice and also capable of showing signs of anti‐cancer potential by inhibiting cell proliferation and growth of lung tumours in mice, in vivo. Moreover, flavonol at its specific dose was neither cytotoxic to normal L‐132 lung cells, in vitro, nor was able to raise any toxicity in mouse bodies, in vivo. This makes the drug more potent and suitable for therapeutic use against lung cancer.
Conflict of interest
None declared.
Acknowledgements
This work was financially supported by a grant sanctioned to Prof. A. R. Khuda‐Bukhsh, Department of Zoology, University of Kalyani, by Boiron Laboratories, Lyon, France. The authors express sincere thanks to Dr. Sanjaya Mallick, Application Scientist and COE Manager, BD BioSciences, and also associated with the Centre for Research in Nanoscience and Nanotechnology, University of Calcutta, for his help in conducting FACS and analysing the data.
References
- 1. Riely GJ, Marks J, Pao W (2009) K‐RAS mutations in non‐small cell lung cancer. Proc. Am. Thorac. Soc. 6, 201–205. [DOI] [PubMed] [Google Scholar]
- 2. Wong KK, Engelman JA, Cantley LC (2010) Targeting the PI3K signaling pathway in cancer. Curr. Opin. Genet. Dev. 20, 87–90. [DOI] [PMC free article] [PubMed] [Google Scholar]
- 3. Palchaudhuri R, Hergenrother PJ (2007) DNA as a target for anticancer compounds: methods to determine the mode of binding and the mechanism of action. Curr. Opin. Biotechnol. 18, 497–503. [DOI] [PubMed] [Google Scholar]
- 4. Roos WP, Kaina B (2013) DNA damage‐induced apoptosis: From specific DNA lesions to the DNA damage response and apoptosis. Cancer Lett. 332, 237–248. [DOI] [PubMed] [Google Scholar]
- 5. Ouyang L, Shi Z, Zhao S, Wang FT, Zhou TT, Liu B et al (2012) Programmed cell death pathways in cancer: a review of apoptosis, autophagy and programmed necrosis. Cell Prolif. 45, 487–498. [DOI] [PMC free article] [PubMed] [Google Scholar]
- 6. Ganguly A, Banerjee K, Chakraborty P, Das S, Sarkar A, Hazra A et al (2011) Overcoming multidrug resistance (MDR) in cancer in vitro and in vivo by a quinoline derivative. Biomed. Pharmacother. 65, 387–394. [DOI] [PubMed] [Google Scholar]
- 7. Tsiri D, Graikou K, Poblocka‐Olech L, Krauze‐Baranowska M, Spyropoulos C, Chinou I (2009) Chemosystematic value of the essential oil composition of Thuja species cultivated in Poland‐antimicrobial activity. Molecules 14, 4707–4715. [DOI] [PMC free article] [PubMed] [Google Scholar]
- 8. Naser B, Bodinet C, Tegtmeier M, Lindequist U (2005) Thuja occidentalis (Arbor vitae): a Review of its Pharmaceutical, Pharmacological and Clinical Properties. Evid. Based Complement. Alternat. Med. 2, 69–78. [DOI] [PMC free article] [PubMed] [Google Scholar]
- 9. Biswas R, Mandal SK, Dutta S, Bhattacharyya SS, Boujedaini N, Khuda‐Bukhsh AR (2011) Thujone‐Rich Fraction of Thuja occidentalis Demonstrates Major Anti‐Cancer Potentials: evidences from In Vitro Studies on A375 Cells. Evid. Based Complement. Alternat. Med. 2011, 568148. [DOI] [PMC free article] [PubMed] [Google Scholar]
- 10. Mukherjee A, Sikdar S, Bishayee K, Paul A, Ghosh S, Boujedaini N et al (2012) Ethanolic extract of Thuja occidentalis blocks proliferation of A549 cells and induces apoptosis in vitro . Zhong Xi Yi Jie He Xue Bao 10, 1451–1459. [DOI] [PubMed] [Google Scholar]
- 11. Okudela K, Hayashi H, Ito T, Yazawa T, Suzuki T, Nakane Y et al (2004) K‐ras gene mutation enhances motility of immortalized airway cells and lung adenocarcinoma cells via Akt activation: possible contribution to non‐invasive expansion of lung adenocarcinoma. Am. J. Pathol. 164, 91–100. [DOI] [PMC free article] [PubMed] [Google Scholar]
- 12. Dubey SK, Batra A (2009) Antioxidant activities of Thuja occidentalis Linn. Asian J. Pharm. Clin. Res. 2, 73–76. [Google Scholar]
- 13. Olusola A, Olutayo O, Michael A, Olakunle F, Edah AO (2011) Elemental analysis and Anti‐microbial potentials of the leaf extract of Cassia arereh Del. Int. Res. J. Pharm. Pharmacol. 1, 188–193. [Google Scholar]
- 14. Mosmann T (1983) Rapid colorimetric assay for cellular growth and survival:application to proliferation and cytotoxicity assays. J. Immunol. Methods 65, 55–63. [DOI] [PubMed] [Google Scholar]
- 15. Darzynkiewicz Z, Galkowski D, Zhao H (2008) Analysis of apoptosis by cytometry using TUNEL assay. Methods 44, 250–254. [DOI] [PMC free article] [PubMed] [Google Scholar]
- 16. Efferth T, Giaisi M, Merling A, Krammer PH, Li‐Weber M (2007) Artesunate induces ROS‐mediated apoptosis in doxorubicin‐resistant T leukemia cells. PLoS ONE 2, e693. [DOI] [PMC free article] [PubMed] [Google Scholar]
- 17. Tietze F (1969) Enzymic method for quantitative determination of nanogram amounts of total and oxidized glutathione: applications to mammalian blood and other tissues. Anal. Biochem. 27, 502–522. [DOI] [PubMed] [Google Scholar]
- 18. Gottlieb E, Armour SM, Harris MH, Thompson CB (2003) Mitochondrial membrane potential regulates matrix configuration and cytochrome c release during apoptosis. Cell Death Differ. 10, 709–717. [DOI] [PubMed] [Google Scholar]
- 19. Sarkar M, Chaudhuri K (2004) Association of adherence and motility in interleukin 8 induction in human intestinal epithelial cells by Vibrio cholerae. Microbes Infect. 6, 676–685. [DOI] [PubMed] [Google Scholar]
- 20. Phaneuf S, Leeuwenburgh C (2002) Cytochrome c release from mitochondria in the aging heart: a possible mechanism for apoptosis with age. Am. J. Physiol. Regul. Integr. Comp. Physiol. 282, R423–R430. [DOI] [PubMed] [Google Scholar]
- 21. Anandakumar P, Kamaraj S, Ramakrishnan G, Jagan S, Devaki, (2009) Chemopreventive task of capsaicin against benzo(a)pyrene‐induced lung cancer in Swiss albino mice. Basic Clin. Pharmacol. Toxicol. 104(5), 360–365. [DOI] [PubMed] [Google Scholar]
- 22. van Engeland M, Nieland LJ, Ramaekers FC, Schutte B, Reutelingsperger CP (1998) Annexin V‐affinity assay: a review on an apoptosis detection system based on phosphatidylserine exposure. Cytometry 31, 1–9. [DOI] [PubMed] [Google Scholar]
- 23. Porter AG, Jänicke RU (1999) Emerging roles of caspase‐3 in apoptosis. Cell Death Differ. 6, 99–104. [DOI] [PubMed] [Google Scholar]
- 24. Elmore S (2007) Apoptosis: a review of programmed cell death. Toxicol. Pathol. 35, 495–516. [DOI] [PMC free article] [PubMed] [Google Scholar]
- 25. Green DR, Reed JC (1998) Mitochondria and apoptosis. Science 281, 1309–1312. [DOI] [PubMed] [Google Scholar]
- 26. Slee EA, Harte MT, Kluck RM, Wolf BB, Casiano CA, Newmeyer DD et al (1999) Ordering the cytochrome c‐initiated caspase cascade: hierarchical activation of caspases‐2, ‐3, ‐6, ‐7, ‐8, and ‐10 in a caspase‐9‐dependent manner. J. Cell Biol. 144, 281–292. [DOI] [PMC free article] [PubMed] [Google Scholar]
- 27. Qian H, Yang Y, Wang X (2011) Curcumin enhanced adriamycin‐induced human liver‐derived Hepatoma G2 cell death through activation of mitochondria‐mediated apoptosis and autophagy. Eur. J. Pharm. Sci. 14, 125–131. [DOI] [PubMed] [Google Scholar]
- 28. García‐Sáez AJ (2012) The secrets of the Bcl‐2 family. Cell Death Differ. 19, 1733–1740. [DOI] [PMC free article] [PubMed] [Google Scholar]
- 29. Ganguly A, Basu S, Chakraborty P, Chatterjee S, Sarkar A, Chatterjee M et al (2010) Targeting mitochondrial cell death pathway to overcome drug resistance with a newly developed iron chelate. PLoS ONE 5, e11253. [DOI] [PMC free article] [PubMed] [Google Scholar]
- 30. Goel A, Prasad AK, Parmar VS, Ghosh B, Saini N (2007) 7,8‐Dihydroxy‐4‐ methylcoumarin induces apoptosis of human lung adenocarcinoma cells by ROS‐independent mitochondrial pathway through partial inhibition of ERK/MAPK signaling. FEBS Lett. 581, 2447–2454. [DOI] [PubMed] [Google Scholar]
- 31. Lakin ND, Jackson SP (1999) Regulation of p53 in response to DNA damage. Oncogene 18, 7644–7655. [DOI] [PubMed] [Google Scholar]
- 32. Haupt S, Berger M, Goldberg Z, Haupt Y (2003) Apoptosis ‐ the p53 network. J. Cell Sci. 116, 4077–4085. [DOI] [PubMed] [Google Scholar]