

Abstract
Onconase (Onc) is a ribonuclease from amphibian oocytes that is cytostatic and cytotoxic to many tumour lines. It shows in vivo antitumour activity in mouse tumour models and is currently in Phase III clinical trials. The present study was designed to test whether cytotoxic effects of ONC can be modulated by differentiating agents. Human leukaemic HL‐60 and prostate cancer LNCaP and JCA‐1 cells were treated with Onc in the absence and presence of several inducers of differentiation and frequency of apoptosis was assessed using three different cytometric methods and confirmed by analysis of cell morphology. A moderate degree of apoptosis observed after 48–72 h incubation of HL‐60 cells in the presence of 0.42 µM Onc alone was markedly potentiated by administration of retinoic acid (all trans), sodium butyrate or dimethylsulfoxide at concentrations known to induce differentiation but be minimally cytotoxic. Likewise, the frequency of apoptosis of LNCaP and JCA‐1 cells treated with Onc was increased in the cultures to which phenylbutyrate was added. Although cell treatment with Onc alone, with each of the differentiating agents alone or with Onc in combination with the differentiating agents led to an increase in the proportion of G1 cells, no specific cell cycle phase preference in induction of apoptosis was observed. The data suggest that cells undergoing differentiation are particularly vulnerable to Onc; a combination of Onc and differentiating agents should be considered for further in vivo tests to assess its possible usefulness in the clinic.
INTRODUCTION
Onconase (Onc), initially named Pannon or Protein P30, is a ribonuclease of 12 000 MW isolated from amphibian oocytes ( Darzynkiewicz et al. 1988 ; Ardelt et al. 1991 ; Mosimann et al. 1994 ). This protein is homologous to other members of the pancreatic RNase superfamily (review: Rybak & Newton 1999) and shows weak enzymatic activity ( Ardelt, Mikulski & Shogen 1991; Ardelt et al. 1994 ; Boix et al. 1996 ). Onc suppresses proliferation of several tumour cell lines of different lineage ( Darzynkiewicz et al. 1988 ; Mikulski et al. 1992a ; Mikulski, Viera & Shogen 1992b; Rybak et al. 1993 ; Boix et al. 1996 ; Rybak et al. 1996 ; Wu et al. 1996 ) and inhibits growth of certain tumours in mice ( Mikulski et al. 1990a ). In its cytotoxic and antitumour activity Onc is synergistic with many chemotherapeutic agents ( Mikulski et al. 1990b ; Mikulski et al. 1992a ; Rybak et al. 1996 ; Deptala et al. 1998 ; Mikulski et al. 1998 ). Onc is currently in Phase III clinical trials where it appears to demonstrate activity towards malignant mesothelioma ( Mikulski et al. 1995 ; Constanzi et al. 1996 ).
The mechanism of antitumour activity of Onc is not well understood. The cytostatic effect of Onc manifesting as an increase in proportion of cells in G1 phase of the cell cycle becomes evident after 48–72 h exposure of cells and is accompanied by apoptotic cell death ( Darzynkiewicz et al. 1988 ; Deptala et al. 1998 ). The cytostatic effect, at least in the case of U937 cells, appears to be mediated by down‐regulation of cyclin D3 combined with upregulation of the inhibitors of cyclin‐dependent kinases (CKIs) p27KIP1, p16INK4A and p21WAF1/CIP1, the events that prevent phosphorylation of pRb during G0/1 and result in cell arrest at the restriction point ( Juan et al. 1998 ). In several other cell lines, however, only p27KIP1 was up‐regulated by Onc while levels of p16INK4A and p21WAF1/CIP1 were unchanged (unpublished). Onc binds to the receptors on plasma membrane of the sensitive cells and becomes internalized ( Wu et al. 1993 ; Wu et al. 1996 ). Because inhibition of protein synthesis which follows the internalization requires Onc to be enzymatically active, it has been postulated, that the cytostatic and cytotoxic effects result from degradation of intracellular RNA, primarily tRNA, by this enzyme ( Wu et al. 1993 ; Lin et al. 1994 ). However, since Onc quite specifically modulates the cell cycle progression machinery (p27KIP1 upregulation) it is likely that its mechanism of action is more complex than just inhibition of overall protein synthesis. Onc shows relatively low toxicity and side‐effects in animal tests ( Mikulski et al. 1990 ) and in clinical trials ( Mikulski et al. 1995 ; Constanzi et al. 1996 ) but it is unclear why tumour cells are more sensitive to this drug compared to normal cells.
As mentioned, Onc shows synergisms with several antitumour drugs. This suggests that its clinical utility may be enhanced in the treatment protocols that use these drug combinations. Continuing our search for other antitumour drugs that may be synergistic with Onc, in particular the drugs of low toxicity to patients, we have turned to the agents that induce cell differentiation. There is evidence in the literature that cytostatic and/or cytotoxic effects of antitumour agents are modulated by induction of cell differentiation (e.g. Bernhard et al. 1999 ; Studzinski, Bhandal & Brelvi 1986; Waxman et al. 1992 ; Solary et al. 1993 ; Del Bino et al. 1994 ; Huang & Waxman (1994), (1998)). Under certain conditions of sequential cell treatments with antimetabolites or DNA damaging agents and induction of differentiation, an enhancement of apoptosis can be observed ( Bhatia et al. 1995 ; Waxman et al. 1992 ; Huang & Waxman 1998). The mechanism of these synergisms may involve modulation of the regulatory and/or execution machinery of apoptosis known to occur in the course of differentiation (e.g. Adam et al. 1997 ; McMahon, Alsina & Levy 1984; Kozopas et al. 1993 ; Lotem & Sachs 1993; Krajewski, Krajewska & Reed 1996; Wang & Studzinski 1997; Watson et al. 1997 ; Hung & Chuang 1999). The present data show that the frequency of apoptosis is increased in combinations of Onc with the differentiating agents under the conditions when apoptosis induced by the latter alone is relatively minor.
MATERIALS AND METHODS
Cells and cell treatments
Human leukaemic cell lines HL‐60, LNCaP and JCA‐1 were obtained from American Type Culture Collection (Rockville, MD). The cells were maintained in RPMI 1640 media supplemented with 10% fetal bovine serum and antibiotics, as described by us before ( Deptala et al. 1998 ; Juan et al. 1998 ). All media, supplements and antibiotics were obtained from Life Technologies (Grand Island, NY, USA). The cultures were periodically tested for Mycoplasma infection. To maintain asynchronous exponential growth the suspension cultures of HL‐60 cells were passaged by re‐seeding the cells (1 : 5 dilution) in fresh medium before the cultures reached 5 × 10⁵ cells/ml density. The adhering cell cultures (LNCaP and JCA‐1) were trypsinized before reaching subconfluence and split at 1 : 10 dilution. Onc, provided by Alfacell Corporation (Bloomfield, NJ, USA), was diluted in culture medium and in most experiments was used at a final concentration 0.42 µm. Stock solution of all trans retinoic acid (RA; 1 m m) in dimethylsulfoxide (DMSO) was stored at −20 °C (both from Sigma Chemical Co., St. Louis MO, USA). The sodium salt of n‐butyric acid (Sigma) and phenylbutyrate (kindly provided by Dr Dvorid Samid of the University of Virginia at Charlottesville, VA, USA) were directly dissolved in media to obtain the desired concentration. When used as a differentiating agent DMSO was administered at a concentration 1.2% (v/v) directly into the cultures. When used as a diluent to RA DMSO was at < 1 µg/ml concentration in the culture, and the respective control cultures were treated with the equivalent DMSO concentration. In most experiments Onc was used in cultures at 0.42 µm, RA at 20 n m, n‐butyrate at 1 m m, and phenylbutyrate at 2 m m final concentration. In preliminary experiments we explored different sequence of cell treatment with Onc and n‐butyrate by adding the latter 24 h pre‐administration, at administration, and 24 h after‐administration of Onc. Because the highest degree synergism was observed when Onc and n‐butyrate were added at the same time, in all further experiments (reported here) Onc and the differentiating agent were administered into exponentially growing cultures at the same time and the cells were harvested either after 48 or 72 h. Special care was exercised to collect all cells from the treated cultures: because apoptotic cells in adherent cultures detach from the surface of the flasks, the trypsinized cells were pooled with the cells that were floating in the media ( Darzynkiewicz et al. 1997 ).
Identification of apoptotic cells
Apoptotic cells were identified, and their frequency quantified by three different flow cytometric methods ( Darzynkiewicz et al. 1997 ). The first one was based on the analysis of cellular DNA content following fixation of the cells in ethanol and extraction of the fragmented low molecular weight DNA with phosphate‐citrate buffer of high molarity ( Gong, Traganos & Darzynkiewicz 1993). The cellular DNA content, after cell staining with DNA specific fluorochrome 4,6‐diamidino‐2‐phenylindole (DAPI), was measured by ICP‐22 flow cytometer (Ortho Instruments, Westwood, MA, USA) using mercury lamp UV light illumination. In the second method the cells were permeabilized with nonionic detergent Triton X‐100 (Sigma) and cellular DNA and RNA were differentially stained with metachromatic fluorochrome acridine orange (AO; Molecular Probes, Eugene, OR, USA) as described before ( Darzynkiewicz 1994) and their fluorescence was measured with a FACScan flow cytometer (Becton Dickinson, San Jose, CA, USA). In both methods apoptotic cells were distinguished on the DNA content frequency histograms as the cells with fractional DNA content (‘sub‐G1’ cell subpopulation) and quantified using a MultiCycle deconvolution software (Phoenix Flow Systems, San Diego, CA). The third method of identification of apoptotic cells was based on in situ DNA strand break labelling with digoxygenin‐tagged dUTP using exogenous terminal deoxynucleotidyl transferase as described by us before ( Gorczyca et al. 1992 ), initially employing ApopTag kit provided by ONCOR Inc. (Gaithersburg, MD, USA) and subsequently the APO‐DIRECT kit offered by Phoenix Flow Systems.
Immunocytochemical detection of Bcl‐2 and Bax
The cells were rinsed with PBS and prefixed in suspension in 1% formaldehyde in PBS for 15 min on ice. The cells were then rinsed again and resuspended in ice‐cold 80% ethanol for up to 24 h. After fixation the cells were rinsed twice with PBS containing 0.25 Triton X‐100 (Sigma) and 1% bovine serum albumin (BSA; Sigma), centrifuged and the cell pellet (∼ 106 cells) suspended in 100 µl 1% of BSA in PBS containing 1 : 100 diluted anti Bcl‐2 mAb (clone 124, DAKO, Carpintiera, CA, USA) and incubated overnight at 4 °C. The cells were then centrifuged, and the pellet suspended in 100 µl 1% of BSA in PBS containing FITC conjugated goat antimouse Ab [(Fab)2 fragment] at 1 : 30 titre. The cells were incubated for 30 min at room temperature in the dark then counterstained with 10 µg/ml propidium iodide (PI; Molecular Probes) containing 0.1% RNase A (Sigma). To detect Bax, the cells were treated as described above except that mouse antihuman Bax Ab (Coulter/Beckman, Miami, FL, USA) at 1 : 200 titre was used. Control cells were incubated with the same batch of isotypic antibody. The bivariate green (FITC) red (PI) fluorescence was measured by FACScan flow cytometer (Becton Dickinson, San Jose, CA, USA). The mean values of Bax and Bcl‐2 immunofluorescence of the measured cell populations (after subtraction of the background fluorescence of the cells stained with isotype IgG Ab) were also calculated to measure a change in Bax/Bcl‐2 ratio after the treatments. Each experiment was repeated at least twice.
RESULTS
Several methods have been used in the present study to identify and quantify apoptotic cells and also to detect changes in the cell cycle distribution of the treated cells. Figure 1 illustrates representative cellular DNA content frequency histograms of HL‐60 cells untreated and treated with Onc or RA alone or with Onc and RA together. Apoptotic cells having fractional DNA content are distinguished by their characteristic ‘sub‐G1’ position on these histograms ( Darzynkiewicz et al. 1997 ). As it is evident, the frequency of apoptotic cells was many‐fold increased in the HL‐60 culture that was treated with both Onc + RA compared to the cultures exposed to Onc or RA alone ( Fig. 1). Actually, treatment with RA as a single agent while lowering the proportion of cells in S and G2/M had a minimal effect on the induction of apoptosis for up to 72 h. For example in the experiment shown in Fig. 1 fewer than 1% apoptotic cells were present in the untreated culture whereas in the Onc‐, RA‐ and Onc + RA‐treated cultures were 23, 1 and 57% such cells, respectively.
Figure 1.
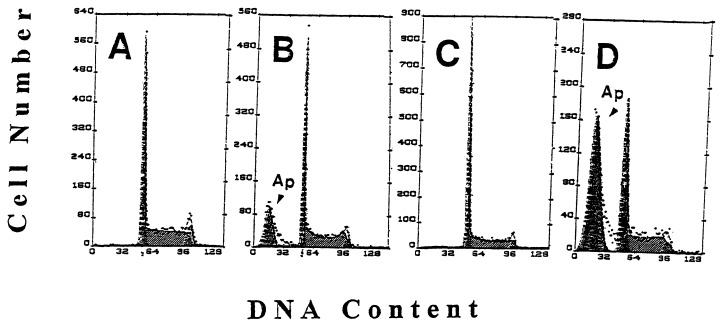
Effect of Onc, RA and combined treatment with Onc and RA acid on cell cycle and apoptosis of HL‐60 cells; univariate analysis of DNA content. Cellular DNA content frequency histograms of HL‐60 cells, untreated (a) and treated with Onc (b), RA (c) and Onc + RA (d) for 48 h. Apoptotic cells (Ap, arrowheads), having fractional DNA content are recognized as the ‘sub‐G1’ cell subpopulation (review: Darzynkiewicz et al. 1997 ). A decrease in proportion of S and G2/M‐phase cells in the culture treated with RA (c) and high frequency of apoptotic cells in the culture treated with Onc + RA (d) are apparent.
Figure 2 presents results of the experiment similar to that shown in Fig. 1 except that the cells were counterstained with the metachromatic fluorochrome AO. Simultaneous differential staining of RNA and DNA with AO also reveals apoptotic cells as the cells with fractional DNA content ( Darzynkiewicz 1994). In the scatterplots shown in Fig. 2 these apoptotic cells are located in the gating region 1 (R1). Moreover, the very late apoptotic cells (‘necrotic phase’ of apoptosis) have a DNA content further decreased compared to the cells represented by the cluster located in R1 and are marked on these scatterplots by the arrows. In this experiment the frequency of apoptotic cells in the untreated cultures was 4% while in the cultures treated with RA Onc, and Onc + RA was 24, 3, and 47%, respectively. These data also convincingly demonstrate that while the treatment with RA alone resulted in diminished proportion of cells in S and G2/M but had no significant effect on apoptosis, and Onc treatment led to a modest increase in frequency of apoptotic cells, the combined treatment with Onc + RA induced massive apoptosis.
Figure 2.
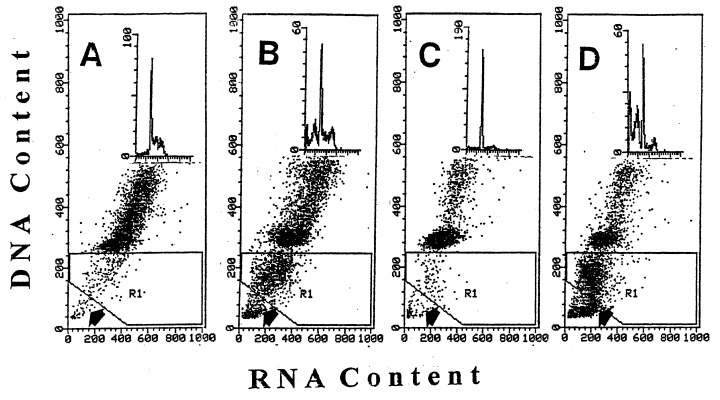
Effect of Onc, RA, and combined treatment with Onc + RA on cell cycle and apoptosis of HL‐60 cells: bivariate analysis of cellular DNA and RNA content. Bivariate distributions (scatterplots) of DNA vs. RNA (stained with AO) of HL‐60 cells, untreated (a) and treated with Onc (b), RA (c) and Onc + RA (d) for 72 h. Apoptotic cells are recognized as the cells with fractional DNA content (located in region 1; R1).Very late apoptotic cells (necrotic phase of apoptosis) have minimal DNA content ( Darzynkiewicz et al. 1997 ) and are located below the R1 gate. Insets show the DNA content histograms of these cells.
The third method of identification of apoptotic cells presently used, based on detection of the in situ DNA strand breaks (‘TUNEL’ assay; Gorczyca et al. 1992 ), has an advantage that in addition to providing the quantitative estimate of the frequency of apoptosis it offers a possibility to correlate apoptosis with the cell cycle position. Figure 3 illustrates the effects of Onc, RA and n‐ butyrate, each administered alone, and the latter two in combination with Onc, analysed by the TUNEL assay. In support of the data shown in Figs 1 and 2, these bivariate DNA content vs. DNA strand break contour plots also show that while RA alone essentially had no effect, and Onc or n‐ butyrate induced apoptosis in relatively small proportion, a combination of Onc either with RA or with n‐butyrate led to the apparent rise in the percentage of apoptotic cells in HL‐60 cell cultures. This synergistic effect also is evident in the case of prostate cancer JCA‐1 cells treated with Onc and phenylbutyrate ( Fig. 4).
Figure 3.
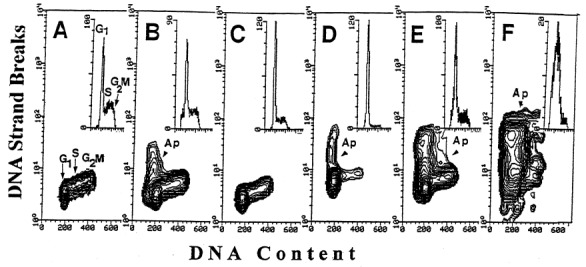
Effect of Onc (b), RA (c), n‐butyrate (d), Onc + RA (e) and Onc plus n‐butyrate (f) on cell cycle and apoptosis of HL‐60 cells: bivariate analysis of cellular DNA content and DNA strand breaks ( Gorczyca et al. 1992 ). Apoptotic cells (Ap) are identified by the presence of DNA strand breaks. Their increased frequency in the cultures treated with Onc + RA (e) and Onc plus n‐ butyrate (f) for 72 h is apparent. (a) cells from the untreated, control culture. Insets show the DNA content frequency histograms of these cells.
Figure 4.
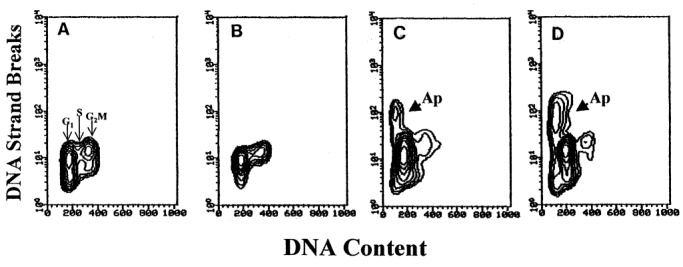
Bivariate analysis of cellular DNA content and DNA strand breaks of JCA‐1 cells untreated (a) and treated for 48 h with phenylbutyrate alone (b), Onc alone (c) and Onc + phenylbutyrate (d).
Analysis of the cell cycle distribution revealed the increase in proportion of G1 cells in all cultures treated with Onc alone, with each of the differentiating agents alone, or treated with Onc in combination with each of the differentiating agents. However, no significant differences between the apoptotic and nonapoptotic cell populations in cell cycle distribution were observed (data not shown). Morphological examination confirmed the apoptotic mode of cell death in the cultures treated with Onc in combination with differentiating agents ( Fig. 5).
Figure 5.
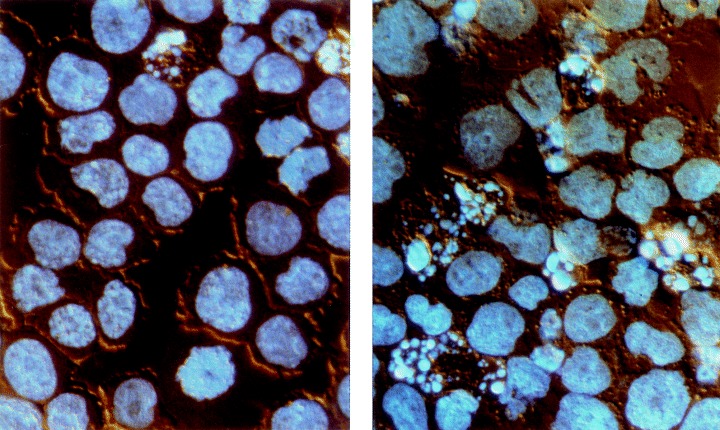
Photomicrographs illustrating morphology of HL‐60 cells, untreated (left) and treated with 0.42 µm Onc plus 20 n m RA for 48 h (right). The cells were stained with the DNA fluorochrome DAPI and viewed under an incident UV excitation and differential interference contrast (Nomarski) combined illumination. As is evident, apoptotic cells, characterized by extensive chromatin condensation, DNA hyperchromicity and nuclear fragmentation, are more frequent in the treated culture. Nikon Microphot FXA, ×40 objective.
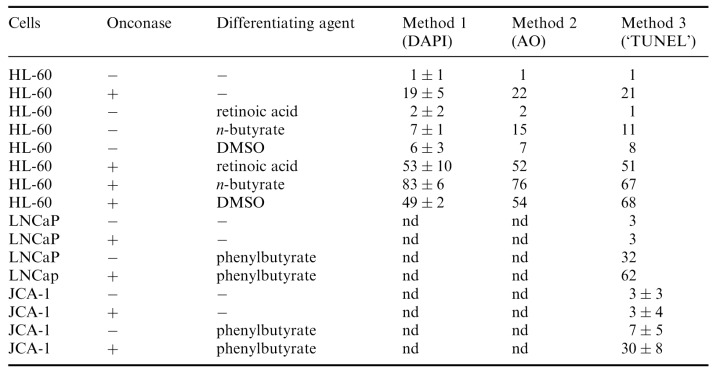
Table 1 summarizes the results of many experiments in which various differentiating agents were studied and apoptotic cells were discriminated by three different methods. The data indicate that regardless of the method used the frequency of apoptotic cells in the cultures treated with a combination of Onc and either of the differentiating agents was greater than it would be expected from the additive effects of Onc and each of these agents if acting alone.
Table 1.
Percent of apoptotic cells in HL‐60, LNCaP and JC‐1 cultures untreated and treated with 0.42 µM Onc in the absence or presence of differentiating agents. Apoptotic cells were identified by two methods utilizing different DNA fluorochromes, DAPI and acridine orange (AO), and the third one, based on the presence of DNA strand breaks ( Gorczyca et al. 1992 ) as shown in 2, 3, 4. Their frequency was estimated by flow cytometry, as described in Materials and Methods. nd, not done
Administration of Onc alone, phenylbutyrate alone or Onc plus phenylbutyrate into JCA‐1 cultures had a relatively modest effect on expression of Bcl‐2: a decrease by 10–30% in mean values of Bcl‐2 immunofluorescence was observed (not shown). Expression of Bax, however, was increased in the cells from the Onc, phenylbutyrate, and Onc plus phenylbutyrate treated cultures ( Fig. 6, panels A‐D). Bax/Bcl‐2 ratio was increased approximately by two‐fold in JCA‐1 cells incubated with Onc or phenylbutyrate, but nearly four‐fold in the cells treated with Onc plus phenylbutyrate ( Fig. 6, bars diagram).
Figure 6.
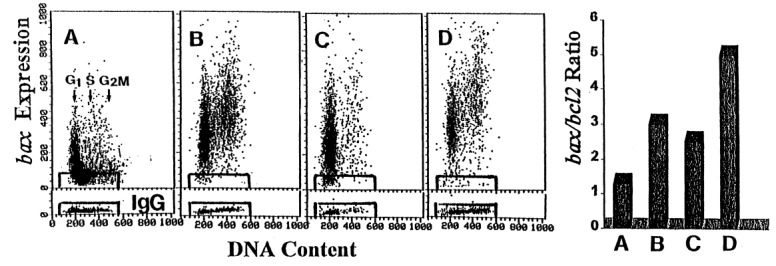
Effect of Onc, phenylbutyrate and Onc + phenylbutyrate on expression of Bax and Bcl‐2 proteins in JCA‐1 cells. Panels a‐d: Bivariate distributions of Bax immunofluorescence vs. DNA content of the untreated JCA‐1 cells (a), JCA‐1 cells incubated in the presence of 42 µM Onc (b), 1 m m phenylbutyrate (c) and 42 µM Onc plus 1 m m phenylbutyrate (d), all for for 72 h. Cells immunostained with isotype IgG served as control; the rectangles that delineate the limits of the IgG background fluorescence are superimosed on the scatterplots. Right panel (bar diagram) Expression of Bcl‐2 in JCA‐1 cells was measured (not shown) similar to that of Bax (shown in panels a‐d), the mean values of Bax and Bcl‐2 immunofluorescence were calculated for the measured cell populations, and plotted as a ratio of Bax:Bcl‐2. These ratios are presented in the bar diagram. (a) untreated cells, (b) Onc, (c) phenylbutyrate, and (d) Onc plus phenylbutyrate‐treated cells.
DISCUSSION
The present data demonstrate that administration of Onc together with differentiating agents led to potentiation of apoptosis. The results were similar regardless of the method of assaying apoptosis, and apoptotic mode of cell death was confirmed by observing changes in cell morphology ( Fig. 5). It should be noted, however, that of the three flow cytometric methods of identification of apoptotic cells used in this study the one utilizing AO provided the most distinct resolution of apoptotic cells ( Fig. 2). The potentiation of apoptosis was observed with each differentiating agent (n‐butyrate, phenylbutyrate, RA, DMSO) and with each cell type (HL‐60, LNCaP, JCA‐1) under the conditions when differentiating agents alone either did not induce apoptosis at all (e.g. RA) or had minimal effect ( Table 1).
Since the end‐stage of the terminally differentiated cell is often death by apoptosis it is not surprising that differentiation is associated with the increased cell predilection to apoptosis ( Krajewski et al. 1996 ; Adam et al. 1997 ; Wang & Studzinski 1997; Watson et al. 1997 ; Hung & Chuang 1999). In general, both the regulatory (e.g. Bcl‐2/Bax family of proteins) and the execution (e.g. caspases) machinery of apoptosis is altered during the differentiation process in the direction that facilitates apoptosis. Thus, the down‐regulation of antiapoptotic and up‐regulation of pro‐apoptotic proteins of Bcl‐2/Bax family is quite common during cell differentiation (e.g. Xu et al. 1993 ). In the present study we observed that while the level of Bcl‐2 was relatively little changed the expression of Bax was increased in JCA‐1 cells treated with Onc, phenylbutyrate and Onc plus phenylbutyrate. The Bax/Bcl‐2 ratio was maximally increased in cultures treated with Onc and phenylbutyrate ( Fig. 6, bar diagram). While it is possible that other members of the Bcl‐2/Bax protein family also are modulated by Onc and the differentiating agents, differently than Bcl‐2 and Bax in JCA‐1 cells, it was not in the scope of the present study to analyse the whole panel of these proteins.
Although differentiating agents such as RA or vitamin D3 alone play a role in treatment of certain tumour types their efficiency in inducing apoptosis is enhanced in combination with other drugs. Antitumour strategies therefore have been designed to combine differentiating agents with other treatments ( Studzinski et al. 1986 ; Solary et al. 1993 ; Del Bino et al. 1994 ; Huang & Waxman 1994; Bhatia et al. 1995 ; Bonnotte et al. 1998 ; Huang & Waxman 1998). Often the sequence of drug administration determines their efficiency. It was observed, for example, that induction of apoptosis was suppressed when the cells were initially treated with differentiating agents and subsequently with the classic antitumour drugs, particularly those that target DNA or DNA replication ( Del Bino et al. 1994 ). In contrast, apoptosis was potentiated when cells were pre‐exposed to DNA damaging drugs prior to induction of differentiation ( Bhatia et al. 1995 ; Huang & Waxman 1998). However, in the present study the synergistic effects of Onc and the differentiating agents were most pronounced when Onc and the agents were added into the cultures at the same time. Administration of Onc 24 h or more after induction of differentiation or vice versa, addition of the differentiating agents 24 h or more after Onc, were less effective (data not shown).
What mechanism may be responsible for the observed synergism between Onc and differentiating agents in induction of apoptosis? As mentioned, the synergism appears to be unrelated to the chemical nature of the differentiating agents. n‐ Butyrate and phenylbutyrate are inhibitors of desacetylase and they induce accumulation of hyperacetylated forms of histones resulting in gross and molecular changes in chromatin structure ( Darzynkiewicz et al. 1981 ; Wade, Pruss & Wolffe 1997; Luo & Dean 1999). RA or DMSO on the other hand, are not known to induce such types of changes in chromatin. RA acts quite specifically through receptors while the polar compound DMSO lacks the specificity. The common feature of all these agents is that they alter the pattern of cell transcription towards suppression of cell proliferation and the development of the differentiation‐associated cell phenotype. It is possible that the presence of Onc, an active ribonuclease, within the cell, interferes with the orderly transition of the transcriptional and translational patterns from proliferation to differentiation. Specifically, one may expect that Onc has a different affinity and accessibility to different RNA molecules and species (mRNA, tRNA, rRNA) in the cell, and thus hydrolyses them with different efficiency. As a result it induces an imbalance in relative proportions of different RNAs. The cells induced to differentiation, which are characterized by a changeable pattern of transcription and translation, thus, may be more vulnerable to such an imbalance than the cells that have more stable pattern of these activities such as the cells during constant exponential phase of their growth.
Both Onc as well as many differentiating agents are already in clinical trials, and compared with other chemotherapeutic agents, their toxicity is low and side‐effects relatively minor. Regardless of the mechanism of the observed synergism, the present data suggest that their clinical efficacy may be increased if used in combination.
Acknowledgements
This work was supported by National Cancer Institute Grant CA RO1 28704, ‘This Close’ Foundation for Cancer Research, Robert A. Welke Foundation for Cancer Research and a grant from Chemotherapy Foundation. Dr Murakami was on leave from Department of Pathology, Yamaguchi University, Ube, Japan
Correspondence: Dr Z. Darzynkiewicz, Brander Cancer Research Institute, New York Medical College, 19 Bradhurst Avenue, Hawthorne, N.Y. 10532, Fax: 914 3472804, E‐mail: darzynk@nymc.edu
REFERENCES
- Adam L, Crepin M, Israel L (1997). Tumor growth inhibition, apoptosis and Bcl‐2 down‐ regulation of MCF‐7 ras tumors by sodium phenylacetate and tamoxifen combination . Cancer Res. 57, 1023 1029. [PubMed] [Google Scholar]
- Ardelt W, Lee HS, Randolph G, Viera A, Mikulski SM, Shogen K (1994). Enzymatic characterization of onconase, a novel ribonuclease with anti‐tumor activity. Protein Sci. 3 (Suppl. 1), 137 147. [Google Scholar]
- Ardelt W, Mikulski SM, Shogen K (1991). Amino acid sequence of an anti‐tumor protein from Rana pipiens oocytes and early embryos. Homology to pancreatic ribonuclease. J. Biol. Chem 266, 245 251. [PubMed] [Google Scholar]
- Bernhard D, Loffler M, Hartmann BL, Yoshida M, Kofler R, Csordas A (1999). Interaction beteen dexamethasone and butyrate in apoptosis induction: non‐additive in thymocytes and synergistic in a T‐cell derived leukemia line. Cell Death Differ 6, 609 617. [DOI] [PubMed] [Google Scholar]
- Bhatia U, Traganos F, Darzynkiewicz Z (1995). Induction of cell differentiation potentiates apoptosis triggered by prior exposure to DNA damaging drugs. Cell Growth Differ 6, 937 944. [PubMed] [Google Scholar]
- Boix E, Wu Y‐N, Vasandani VM et al. (1996). Role of N terminus in RNase A homologues: Differences in catalytic activity, ribonuclease inhibitor interaction and cytotoxicity. J. Mol Biol. 257, 992 1007. [DOI] [PubMed] [Google Scholar]
- Bonnotte B, Favre N, Reveneaou S et al. (1998). Cancer cell sensitization to Fas‐ mediated apoptosis by sodium butyrate. Cell Death Differ 5, 480 487. [DOI] [PubMed] [Google Scholar]
- Constanzi J & Darzynkiewicz Z, et al. (1996). The use of ONCONASE (ONC) for patients (PTS) with advanced mesothelioma (MM). ASCO Proc., Abstract 1414(1996):. [Google Scholar]
- Darzynkiewicz Z (1994). Simultaneous analysis of cellular RNA and DNA content. Meth Cell Biol. 41, 401 420. [DOI] [PubMed] [Google Scholar]
- Darzynkiewicz Z, Carter SP, Mikulski SM, Ardelt WJ, Shogen K (1988). Cytostatic and cytotoxic effects of Pannon (P‐30 Protein), a novel anticancer agent. Cell Tissue Kinet 21, 169 182. [DOI] [PubMed] [Google Scholar]
- Darzynkiewicz Z, Juan G, Li X, Gorczyca W, Murakami Traganos F (1997). Cytometry in cell necrobiology: analysis of apoptosis and accidental cell death (necrosis). Cytometry 27, 1 20. [PubMed] [Google Scholar]
- Darzynkiewicz Z, Traganos F, Xue S, Melamed MR (1981). Effect of n‐butyrate on cell cycle and in situ chromatin structure of L1210 cells. Exp Cell Res. 136, 279 293. [DOI] [PubMed] [Google Scholar]
- Del Bino G, Li X, Traganos F, Darzynkiewicz Z (1994). Altered susceptibility of differentiating HL‐60 cells to apoptosis induced by antitumor drugs. Leukemia 6, 281 288. [PubMed] [Google Scholar]
- Deptala A, Halicka HD, Ardelt B, Ardelt W, Mikulski SM, Shogen K, Darzynkiewicz Z (1998). Potentiation of tumor necrosis factor induced apoptosis by onconase. Int J. Oncol. 13, 11 16. [DOI] [PubMed] [Google Scholar]
- Gong J, Traganos F, Darzynkiewicz Z (1993). A selective procedure for DNA extraction from apoptotic cells applicable for gel electrophoresis and flow cytometry. Anal Biochem. 218, 314 319. [DOI] [PubMed] [Google Scholar]
- Gorczyca W, Bruno S, Darzynkiewicz RJ, Gong J, Darzynkiewicz Z (1992). DNA strand breaks occuring during apoptosis: Their in situ detection by the terminal deoxynucleotidyl transferase and nick translation assays and prevention by serine protease inhibitors. Int J. Oncol. 1, 639 648. [DOI] [PubMed] [Google Scholar]
- Huang Y & Waxman S (1994). Enhanced apoptosis in leukemia cells following treatment with combination fluoropyrimidines and differentiation inducers. Mol Cell Differ 2, 83 100. [Google Scholar]
- Huang Y & Waxman S (1998). Enhanced growth inhibition and differentiation of fluorodeoxyuridine‐treated human colon carcinoma cells by phenylbutyrate. Clin. Cancer Res. 4, 2503 2509. [PubMed] [Google Scholar]
- Juan G, Ardelt B, Mikulski SM et al. (1998). G1 arrest of U937 cells by onconase is associated with suppression of cyclin D3 expression, induction of p16INK4A, P21WAF1/CIP1 and p27 and decreased pRb phosphorylation. Leukemia 12, 1241 1248. [DOI] [PubMed] [Google Scholar]
- Kozopas KM, Yang T, Buchan HL, Zhou PA, Craig RW (1993). MCL1, a gene expressed in programmed myeloid cell differentiation, has sequence similarity to Bcl2 . Proc. Natl. Acad. Sci. USA 90, 3516 3520. [DOI] [PMC free article] [PubMed] [Google Scholar]
- Krajewski S, Krajewska M, Reed JC (1996). Immunohistochemical analysis of in vivo patterns of Bak expression, a proapoptotic member of the Bcl‐2 protein family . Cancer Res. 56, 2849 2855. [PubMed] [Google Scholar]
- Lin JJ, Newton DL, Mikulski SM, Kung HF, Rybak SM (1994). Characterization of the mechanism of cellular and cell free protein synthesis inhibition by an anti‐tumor ribonuclease. Biochem. Biophys. Res. Commun 204, 156 162. [DOI] [PubMed] [Google Scholar]
- Lotem J & Sachs L (1993). Regulation by bcl‐2, c‐myc, and p53 of sussceptibiliy to induction of apoptosis by heat shock and cancer chemotherapy compounds in differentiation‐ competent and ‐defective leukemic cells. Cell Growth Differ 4, 41 47. [PubMed] [Google Scholar]
- Luo RZ & Dean DC (1999). Chromatin remodeling and transcriptional regulation. JNCI 91, 1288 1294. [DOI] [PubMed] [Google Scholar]
- McMahon G, Alsina JL, Levy SB (1984). Induction of a Ca2+, Mg2+ ‐dependent endonuclease activity during the early stages of murine erythroleukemia cell differentiation. Proc. Natl. Acad. Sci. USA 81, 7461 7465. [DOI] [PMC free article] [PubMed] [Google Scholar]
- Mikulski S, Bernstein E, Ardelt W, Shogen K, Menduke K (1990a). Striking increase in survival of mice bearing M109 Madison carcinoma treated with a novel protein from amphibian embryos. JNCI 82, 151 153. [DOI] [PubMed] [Google Scholar]
- Mikulski S, Chun H, Mittelman A et al. (1995). Relationship between response rate and median survival in patients with advanced non‐small cell lung cancer: comparison of ONCONASE with other anticancer agents. Int J. Oncol. 6, 889 897. [DOI] [PubMed] [Google Scholar]
- Mikulski S, Viera A, Ardelt W, Menduke H, Shogen K (1990b). Tamoxifen and trifluoroperazine (Stelazine) potentiate cytotostatic/cytotoxic effects of P‐30 Protein, a novel protein possesing anti‐tumor activity. Cell Tissue Kinet 32, 237 246. [DOI] [PubMed] [Google Scholar]
- Mikulski S, Viera A, Darzynkiewicz Z, Shogen K (1992a). Synergism between a novel amphibian oocyte ribonuclease and lovastatin in inducing cytostatic and cytotoxic effects in human lung and pancreatic carcinoma cell lines. Br. J. Cancer 66, 304 310. [DOI] [PMC free article] [PubMed] [Google Scholar]
- Mikulski SM, Viera A, Deptala A, Darzynkiewicz Z (1998). Enhanced in vitro cytotoxicity and cytostasis of the combination of onconase with a proteasome inhibitor. Int J. Oncol. 13, 633 644. [DOI] [PubMed] [Google Scholar]
- Mikulski S, Viera A, Shogen K (1992b). In vitro synergism between a novel amphibian oocytic ribonuclease (ONCONASE) and tamoxifen, lovastatin and cisplatin in human OVCAR‐3 ovarian carcinoma cell line. Int J. Oncol. 1, 779 785. [PubMed] [Google Scholar]
- Mosimann SC, Ardelt W, James MNG (1994). Refined 1.7 A X‐ray crystallographic structure of P‐30 protein, an amphibian ribonuclease with antitumor activity. J. Mol Biol. 236, 1141 1153. [DOI] [PubMed] [Google Scholar]
- Rybak SM & Newton DL (1999). Natural and engineered cytotoxic ribonucleases: therapeutic potential. Exp Cell Res. 253, 325 335. [DOI] [PubMed] [Google Scholar]
- Rybak SM, Newton DL, Mikulski SM, Viera A, Youle RJ (1993). Cytotoxic onconase and ribonuclease A chimeras: Comparison and in vitro characteristics. Drug Deliv 1, 3 10. [Google Scholar]
- Rybak S, Pearson J, Fogler W et al. (1996). Enhancement of vincristine cytotoxicity in drug‐resistant cells by simultaneous treatment with ONCONASE, an antitumor ribonuclease. JNCI 88, 747 753. [DOI] [PubMed] [Google Scholar]
- Solary E, Bertrand R, Kohn KW, Pommier Y (1993). Differential induction of apoptosis in undifferentiated and differentiated HL‐60 cells by DNA topoisomerase I and II inhibitors. Blood 81, 1359 1368. [PubMed] [Google Scholar]
- Studzinski GP, Bhandal AK, Brelvi ZS (1986). Potentiation by 1‐, 25‐hydroxyvitamin D3 of cytotoxicity to HL‐60 cells produced by cytarabine and hydroxyurea. JNCI 76, 641 648. [DOI] [PubMed] [Google Scholar]
- Wade PA, Pruss D, Wolffe AP (1997). Histone acetylation: chromatin in action. TIBS 22, 128 131. [DOI] [PubMed] [Google Scholar]
- Wang X & Studzinski GP (1997). Antiapoptotic action of 1,25‐dihydroxyvitamin D3 is associated with increased mitochondrial MCL‐1 and RAF‐1 proteins and reduced cytochrome c. Exp Cell Res. 235, 210 217. [DOI] [PubMed] [Google Scholar]
- Watson RW, Rothstein OD, Parodo J, Bitar R, Hackham D, Marshall JC (1997). Granulocytic differentiation of HL‐60 cells results in spontaneous apoptosis mediated by increased caspase expression. FEBS Lett 412, 603 609. [DOI] [PubMed] [Google Scholar]
- Waxman S, Huang Y, Scher BM, Scher M (1992). Enhancement of differentiation and cytotoxicity of leukemia cells by combinations of fluorinated pyrimidines and differentiation inducers: development of DNA double‐strand breaks. Biomed & Parmacother 46, 183 192. [DOI] [PubMed] [Google Scholar]
- Wu Y, Mikulski SM, Ardelt W, Rybak SM, Youle RJ (1993). A cytotoxic ribonuclease. Study of the mechanism of onconase cytotoxicity. J. Biol. Chem 268, 10686 10693. [PubMed] [Google Scholar]
- Wu Y, Saxena SK, Ardelt W et al. (1996). A study of the intracellular routing of cytotoxic ribonucleases. J. Biol. Chem 270, 17476 17481. [DOI] [PubMed] [Google Scholar]
- Xu H‐M, Tepper CG, Jones JB, Fernandez CE, Studzinski GP (1993). 1,25‐ dihydroxyvitamin D3 protects HL60 cells against apoptosis but down‐regulates the expression of the bcl‐2 gene . Exp Cell Res. 209, 367 374. [DOI] [PubMed] [Google Scholar]