Abstract
Objectives
Here we present an application, in two tumour cell lines, based on the Sensing Cell Culture Flask system as a cell culture monitoring tool for pericellular oxygen sensing.
Materials and methods
T‐47D (human breast cancer) and T98G (human brain cancer) cells were cultured either in atmospheric air or in a glove‐box set at 4% oxygen, in both cases with 5% CO2 in the gas phase. Pericellular oxygen tension was measured with the help of an integrated sensor chip comprising oxygen sensor arrays.
Results
Obtained results illustrate variation of pericellular oxygen tension in attached cells covered by stagnant medium. Independent of incubation conditions, low pericellular oxygen concentration levels, usually associated with hypoxia, were found in dense cell cultures.
Conclusions
Respiration alone brought pericellular oxygen concentration down to levels which could activate hypoxia‐sensing regulatory processes in cultures believed to be aerobic. Cells in culture believed to experience conditions of mild hypoxia may, in reality, experience severe hypoxia. This would lead to incorrect assumptions and suggests that pericellular oxygen concentration readings are of great importance to obtain reproducible results when dealing with hypoxic and normoxic (aerobic) incubation conditions. The Sensing Cell Culture Flask system allows continuous monitoring of pericellular oxygen concentration with outstanding long‐term stability and no need for recalibration during cell culture experiments. The sensor is integrated into the flask bottom, thus in direct contact with attached cells. No additional equipment needs to be inserted into the flask during culturing. Transparency of the electrochemical sensor chip allows optical inspection of cells attached on top of the sensor.
Introduction
Solid tumours with large regions of hypoxic (low oxygen tension) areas are associated with poor prognosis for patients. Cancer cells in hypoxic regions are partially resistant to radiation as well as to many chemotherapeutic drugs. It is well known that low oxygen tension induces direct chemical protection against radiation, whereas recent cancer research is focusing on cell regulatory cascades induced by hypoxia 1.
To investigate these regulatory processes in vitro, cell cultures are used so that control of hypoxic conditions can be optimal. Typical tumour cell culture experiments establish hypoxia by reducing oxygen partial pressure in the gas phase of an incubator and compare such cultures with control cells cultured at higher oxygen levels (normoxic control). This approach may lead to irreproducible results and erroneous assumptions. In vivo, oxygenation of normal well‐oxygenated tissue varies, but pericellular oxygen concentration is typically in the order of 4% O2. When oxygenation is reduced to about 1% O2 in normal tissues, hypoxia‐responsive pathways regulated by HIF are usually activated 2.
In a typical in vitro experiment in which oxygen tension is controlled in the gas phase, pericellular oxygen concentration around cells settling at the bottom of a tissue culture vessel can be significantly lower than the value at the medium surface. Due to respiration cells act as a sink for oxygen, while oxygenation from the gas phase is limited by diffusion through the culture medium. This results in a concentration gradient from top to bottom of the medium and leads to pericellular oxygen concentration to be far lower than incubator atmosphere. Practical relevance of oxygen concentration gradients from top to bottom of the medium with respect to pericellular oxygen tension in typical tumour cell culture experiments has been demonstrated with microsensors moved stepwise down through the medium with micrometre‐sized steps, and by measuring in different heights above cells seated at the flask bottom 3. In the presented work, this effect has been investigated in more detail by means of integrated sensor chips, allowing continuous long‐term measurements.
Awareness of the complexity of pericellular oxygen tension in cell cultures dates back at least to 1970 4, 5, but monitoring oxygen tension has not yet become routine practice in cell culture laboratories, even today. The main reason for this is lack of availability of easy‐to‐use monitoring systems and reliable long‐term stable sensors, which can be integrated into typical formats such as tissue culture flasks. Handling of flasks equipped with sensors should in principle not differ from routine cell culture work, but has in reality involved complex sensor equipment.
Within the last three decades, much progress towards a robust and easy‐to‐use cell culture monitoring system has been achieved. Based on the light‐addressable potentiometric sensor 6, 7 of the 1980s, pericellular pH measurements were performed. This approach resulted in the commercial system Cytosensor® microphysiometer, enabling measurement of acidification rates of cells in a microfluid system 8, 9 at the beginning of the 1990s. This system, which can be seen as one of the first chip‐based cell culture monitoring systems, was further enhanced to enable multi‐parameter measurements 10, 11; however, it is no longer commercially available. Comparable approaches, culturing cells in a chamber connected to a microfluid system and monitoring of acidification and respiration with ISFETs, potentiometric or amperometric sensors have been presented 12, 13, 14, 15, 16, 17, 18, 19. In parallel, optical sensor systems for cell culture monitoring were developed. These systems mainly deal with oxygen and pH measurements 20, 21, 22.
Yet, there was lack of cell culture systems allowing multi‐parameter monitoring of real‐time values in cell culture, with the possibility of combining sensors for several major metabolic parameters (such as oxygen, pH, glucose, lactate), as well as parameters of interest in a specific field of cell research (for example, nitric oxide or neurotransmitters). Thus, we introduced the concept of the Sensing Cell Culture Flask (SCCF) in 2007 23, see Fig. 1. This monitoring system is comprised of a sensor chip mounted in a tissue culture flask, and a rack system with an electrical multiplexer to operate different working electrodes and flasks with a single‐channel potentiostat. The sensor chip is permanently mounted in the flask bottom so that the chip surface is level with the flask surface to which cells attach. No equipment has to be inserted or changed within the flask during an experiment.
Figure 1.
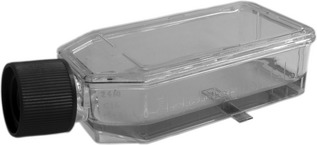
Sensing Cell Culture Flask: the transparent sensor chip is embedded in a conventional tissue culture flask.
The SCCF can be equipped with almost any type of electrochemical sensor during post‐processing of the sensor chips and as of now, sensors for oxygen, pH, NO and temperature measurements have been implemented 1, 24, 25, 26, 27. Oxygen and NO sensors are operated by amperometric measurement protocols (a defined potential is applied, current flow gives information about analyte concentration). pH sensor is an example for a potentiometric (no current flow, electrochemical equilibrium) setup. The possibility of integrating many different chemo‐ and biosensors on one platform is the distinct advantage of the electrochemical sensor approach. In comparison, optical sensor systems have lower capability for combination of multiple sensors measuring different parameters within the same arrangement.
This paper presents results from pericellular oxygen monitoring, key parameter in the field of hypoxic cell culture. The purpose of the experiments was to demonstrate oxygen monitoring capability of the SCCF in a typical cell culture experiment scenario showing variable oxygen levels around cells along the time course and due to different cell densities, with the same incubator conditions. Hypoxic conditions could occur in the presumable normoxic control (20% O2 in the incubator atmosphere) if cell density should be high.
Materials and methods
Sensor chip fabrication
The SCCF system was based on transparent sensor chips embedded in the bottom of a conventional tissue culture flask (BD Primaria™ TC, 25 cm2, 353813; BD Biosciences Discovery Labware, Franklin Lakes, NJ, USA) as shown in Fig. 2a. Chips were fabricated on 100 mm diameter glass wafers (Borofloat®; Schott AG, Mainz, Germany) 500 μm thick, enabling observation of cells using inverted microscopy. After deposition of 200 nm silicon nitride by plasma‐enhanced chemical vapour deposition (PECVD), metal layers (20 nm titanium, 100 nm platinum, 50 nm titanium) were formed by vapour deposition and structured using a lift‐off process. Subsequently, 800 nm silicon nitride and 200 nm silicon oxide were deposited by PECVD and structured using reactive ion etching. During this etching step, the top titanium layer was removed as well to form platinum electrodes.
Figure 2.
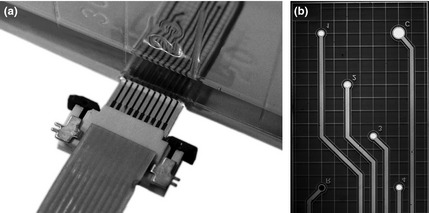
Detailed view of the Sensing Cell Culture Flask sensor chip embedded into the bottom of a conventional tissue culture (a). Micrograph of an Sensing Cell Culture Flask sensor chip before deposition of the hydrogel membrane (b). The small number and letters have been introduced into the metal layer of the sensor chip to simplify navigation during microscopy.
Reference electrodes were formed by electrodeposition of 10 μm silver in a cyanide‐based deposition bath (Arguna® S; Umicore Galvanotechnik GmbH, Schäbisch Gmünd, Germany), followed by partial electrochemical conversion of the silver to silver chloride in potassium chloride solution. These steps were performed at the wafer level, enabled by temporary structures connecting corresponding electrodes of each chip. Those temporary structures were cut during the dicing step (see Fig. 2b).
All electrodes (including the reference electrode) were covered with a hydrogel based on poly(2‐hydroxyethyl methacrylate) 28, which was distributed on the electrode surface using an automated dispensing machine and cross‐linked by UV exposure in an oxygen‐free environment.
Diced chips were mounted in a milled opening in the bottom of the tissue culture flask. To fix and seal the chips, UV‐curable glue (Loctite® 3201™; Henkel Loctite Europe, Düsseldorf, Germany) was used; this had been proved in prior tests to be cell culture compatible.
Oxygen sensor operation
In contrast to Clark‐type sensors 29, the presented direct amperometric oxygen sensor does not use a gas‐permeable membrane. The chronoamperometric pulse protocol with three levels, followed by a long off‐time, provides long‐time stability along with minimization of inherent oxygen consumption. These types of protocol have previously been described in detail 23.
For the first step (0.8 V with respect to the integrated reference electrode, 4 s duration), the working electrode was polarized to the region where formation of platinum oxide occurs; this was then reduced in the second step (−0.4 V, 3 s) and sensor readings were taken at the end of step three (−0.3 V, 3 s). One measurement cycle took 10 s per electrode. During off‐time, other working electrodes were connected to the potentiostat by means of a multiplexer. Off‐time was adjusted to obtain an overall acquisition rate of 5 min.
The custom‐designed, 16‐channel instrumentation hardware allowed operation of four individual SCCFs. The multiplexer circuit connected different electrodes with the single‐channel potentiostat EmStat OEM module from PalmSens BV (Utrecht, the Netherlands); current resolution was 0.01 nA. Each flask had four working, one counter and one reference electrode.
Results of oxygen measurements are reported with “% O2” as the unit of oxygen concentration, to be consistent with the majority of literature in this biological field. However, “% O2” does not express concentration of dissolved gas, but can be understood as concentration of dissolved oxygen equilibrated to a gas phase, which contains the corresponding fraction of oxygen at normal pressure. All oxygen sensor readings with cells were reported as mean value of data from two sensor points on the same SCCF sensor chip. 1% O2 corresponds to approximately 10 μm dissolved oxygen in cell culture medium 30.
Cell culture experiments
Three cell lines were used in this work: T‐47D and MCF‐7 breast cancer cells 31, 32, which show highly active metabolism, and T98G cells 33 isolated from a human glioblastoma multiforme, an aggressive brain tumour. T98G cells proliferate faster than T‐47D cells, but form less dense layers. Cells of all three lines were grown as monolayer cultures in RPMI 1640 medium (Gibco, Rockville, MD, USA), supplemented with 10% foetal calf serum (Gibco), 200 U/l insulin and penicillin/streptomycin (Gibco).
While designing the sensor chip, the question arose – which was the optimal top layer of the layer stack? From the perspective of the cells, this is the coating material on which they are supposed to settle and attach. Two materials have been favoured from the point of view of the sensor fabrication process: PECVD layers of silicon oxide (which was later chosen as the top layer) and PECVD layers of silicon nitride. These two coating materials were tested with respect to biocompatibility with T‐47D and MCF‐7 cells. After production of the sensor chips, oxygen measurements were performed with one of the breast cancer cell types (T‐47D), while the brain cancer cell line (T98G), was included in these measurements.
T‐47D and MCF‐7 cells were tested for cell population growth rate, by means of increase in cell number, and colony forming ability, as determined by plating efficiency in culture flasks of chips coated with either silicon oxide or silicon nitride. For measurement of colony formation by plating efficiency 34, three flasks with coated chips were seeded with 100 single cells each, and incubated for 11–14 days before colonies were fixed and stained. Colonies containing more than 50 cells were counted. For determination of cell proliferation, repeated images were taken from several randomly chosen but defined positions in each of two flasks with a computer‐controlled motor‐stage positioning system, for 48 h; cells inside the captured micrographs were counted for estimation of cell‐number doubling time.
After fabrication, SCCFs were sterilized in a 1000 Gy, 4 MeV electron beam from a clinical linear accelerator (Elekta Synergy, Stockholm, Sweden®). Before cell seeding, sensors were calibrated in cell culture medium equilibrated with the incubator atmosphere. A two‐point calibration was performed using batch values for the offset, together with values for individual sensors obtained for the incubator atmosphere immediately before cell measurements. During cell culturing, no recalibration was necessary.
0.5 × 10⁶ T‐47D cells and 0.5 × 10⁶ T98G cells were seeded in SCCFs with 25 cm2 cell culture area each, and cultured in air in a special walk‐in incubator room maintained at a temperature of 37 °C. SCCFs with tight caps encapsulated an atmosphere containing 20% O2 and 5% CO2. Cell consumption was negligible compared to the large gas volume in the closed flask so that atmospheric oxygen concentration in the flask could be assumed to be constant over the experimental period (see [Link] for estimation of amount of oxygen consumed during a typical cell culture experiment).
2 × 10⁶ and 6 × 10⁶ T‐47D cells, as well as 0.5 × 10⁶ T98G cells were seeded in SCCFs with 25 cm2 cell culture area. Cell‐seeding was performed in atmospheric air before flasks were placed into an INVIVO2 400 hypoxic workstation (Ruskinn Technology, Bridgend, UK) operated at 37 °C, with atmosphere containing 4% O2 and 5% CO2 These SCCFs had vented filter caps to allow the atmosphere in the flask to equilibrate with the atmosphere of the box.
Micrographs of cells were taken using a Nikon (Amsterdam, the Netherlands) TMS inverted microscope with 10× objective lens, 0.45× photo adapter and PAXcam3 camera from MIS (Villa Park, IL, USA).
Results
Biocompatibility testing: cell growth and survival
Cell growth rate as recorded by cell‐number doubling times and clonogenic cell survival assays were carried out in cell culture flasks with the whole flask bottom covered by silicon oxide or silicon nitride as top layer, respectively. Thus, in these biocompatibility tests, all cells observed were directly exposed to materials tested as cover for the chips. Figure 3 shows relative number of cells per cm2 of T‐47D and MCF‐7 cells as a function of time over a 48‐h time period for cells grown in normal Nunclon™ Δ (Roskilde, Denmark) flasks compared to cells grown in flasks where the whole flask bottom was coated with the silicon nitride or silicon oxide, respectively. Ordinate is logarithmic to ascertain that one can test growth rate by comparing slopes of the curves.
Figure 3.
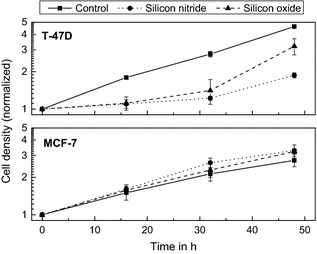
Number of T‐47D cells (top) and MCF ‐7 (bottom) as a function of time. Time zero here represents the time when all cells have attached, which was 6 h after seeding. The cell number is normalized to the amount of cells 6 h after seeding. The curves show results from chips with silicon nitride (●) and silicon oxide (▲) as top layer in comparison with the Nunclon™ Δ Surface (■) as control.
Colony counts are shown in Table 1 for each separate coated and control (Nunclon™ Δ) flask. Plating efficiency of T‐47D cells was 100% that of cells in a Nunclon™ Δ flask after growth in a flask with silicon oxide‐coated surface, while it was 80% after growth in a flask with silicon nitride‐coated surface.
Table 1.
Clonogenic survival rate of T‐47D cell on silicon oxide‐ or silicon nitride‐coated surface. Colonies are raised from 100 cells seeded into each flask.
| Colony | Counts | Average (%) | SE (%) | ||
|---|---|---|---|---|---|
| T‐47D control | 99 | 104 | 98 | 100.3 | 1.86 |
| T‐47D silicon nitride | 81 | 67 | 92 | 80.0 | 7.23 |
| T‐47D silicon oxide | 107 | 106 | 93 | 102.0 | 4.51 |
Sensor performance
To test for time to reach steady‐state conditions for the sensor with different liquids covering the flask bottom, oxygen sensor performance was evaluated both with phosphate buffered saline and with cell culture medium in SCCF‐flasks without cells. It was found that in cell culture medium, initial equilibration (run‐in) phase of at least 12 h was recommended to ensure stable operation. After the run‐in phase, sensor readings were found to be stable over more than 1 week without the need for recalibration.
Sensitivities of oxygen sensors were (−2.28 ± 0.56) μA/cm2/%O2 (n = 15) measured in cell culture medium at 37 °C. Sensor resolution was limited by current resolution of the potentiostat to 0.014% O2. During online measurements, control SCCFs operated without cells, but with identical incubation conditions, as the flasks with cells were always run in parallel with cell‐containing SCCFs. Drift‐rate of oxygen sensors was generally found to be less than 0.01% O2/day at 4% O2 sensor reading.
Oxygen measurement
20% oxygen incubation conditions
Figure 4 shows sensor‐reading as a function of time after seeding of T‐47D and T98G cells; zero of the time line reflects cell seeding time. Incubation took place in air atmosphere with 5% CO2. Within the first hour, oxygen concentration dropped to an almost constant level of approximately 15% O2 in the case of T‐47D cells and 18% O2 for T98G cells. This region is marked ‘A’ in the figure and lasted approximately 20 h.
Figure 4.
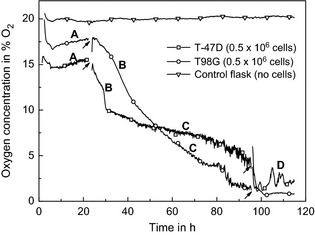
Pericellular oxygen level under conditions similar to a standard CO 2 incubator, with 20% O 2 and 5% CO 2 inside the incubation atmosphere. Calibrated readings from the sensors on the chip surface where T‐47D cells (□) or T98G cells (○) are attached, readings from a Sensing Cell Culture Flask without cells were collected at the same time points (∇). The indicated disturbances are correlated with media shaking due to moving of the flask onto the microscope for photo capturing. Details about the regions A–D can be found in the text. 1% O2 corresponds to approximately 10 μm dissolved oxygen in cell culture medium.
At 23 h, the flask was moved to a microscope stage so that cells could be photographed. Shortly after bringing each flask back from the microscope at time 23 h, pericellular oxygen tension in both cultures started to reduce significantly (region B). Over prolonged incubation time, oxygen tension decreased further (region C). For incubation of more than 100 h, pericellular oxygen concentration reached levels of less than 4% O2 (region D). For T98G cells, after the second microscopic phase (around 95 h) sensor readings dropped from significantly higher values, back to levels comparable to those before manipulation of the flask.
4% oxygen incubation conditions
Figure 5 shows pericellular oxygen tension in two cultures with T‐47D cells as well as one with T98G cells. Cells were seeded in atmospheric air and transferred to the incubator with 4% O2 atmosphere, zero point of the time line reflecting cell seeding time. Within the first 10 h after placement of flasks in the incubator, oxygen tension dropped steeply from higher values to values below readings from control flasks (region A). For T‐47D cells, results from two different cell culture flasks with different cell density are shown. In high‐density cell culture, a steep decrease and overall low pericellular oxygen concentration below 1% were observed after about 8 h incubation (region C).
Figure 5.
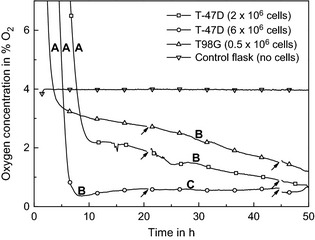
Pericellular oxygen level when sensor flasks were placed in an incubator with 4% O 2 and 5% CO 2. Two different starting cell densities of T‐47D cells 2 × 10⁶ cells (□) and 6 × 10⁶ cells (○) and 2 × 10⁶ T98G cells (∆) are included. The blank Sensing Cell Culture Flask without cells (∇) was placed into the incubator box 1 day prior to the flasks with cells and was already equilibrated at the start time point. The indicated disturbances are correlated with media shaking due to photo capturing on microscope. Details about the regions A–C can be found in the text. 1% O2 corresponds to approximately 10 μm dissolved oxygen in cell culture medium.
Results from cell counting during these experiments are shown in Fig. 6 and micrographs are presented in Fig. 7.
Figure 6.
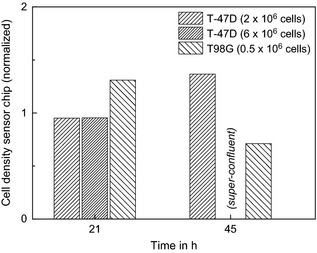
Density of attached cells on the sensor chips, normalized to cells on the bottom of a 25‐cm 2 flask beside the chip area at two different time points after seeding of cells. The images were taken during the oxygen measurements at 4% oxygen in the incubator, see Fig. 5. The cell numbers in brackets refer to the amount of cells seeded at time zero. The culture with 6 × 10⁶ T‐47D cells seeded was super‐confluent at 45 h. Therefore, no data could be taken from the microscopy images.
Figure 7.
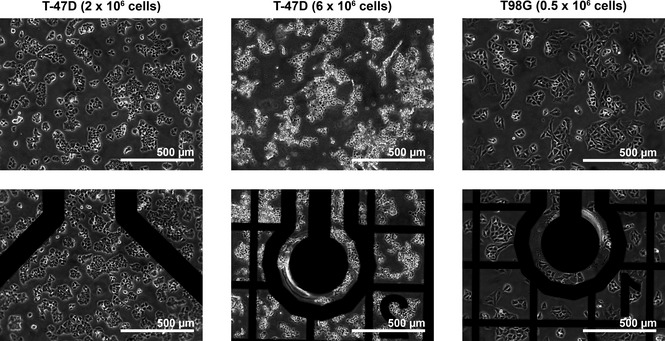
Microscopic pictures of the cells taken 45 h after seeding of cells. The flasks were incubated with 4% oxygen in the incubator atmosphere. The top row shows sections of the cells in the area of normal flask material. The bottom row shows part of the sensor chip respectively of the same flask as the one shown in the upper row. The cell numbers in brackets refer to the amount of cells seeded at time zero. The pictures are taken from the oxygen measurement experiment as represented in Fig. 5. In flasks with 6 × 10⁶ T‐47D cells seeded, the cells were super‐confluent and floating around.
Discussion
Biocompatibility testing: cell appearance, growth and survival
Biocompatibility testing to select coating material for sensor chips was performed using T‐47D and MCF‐7 cells. Cell growth data (Fig. 3) showed a lag period of 30 h for T‐47D cells grown on silicon nitride and silicon oxide in comparison with a control flask. In the case of silicon oxide, speed‐up of cell growth was observed after the lag. This lag phase was not observed for MCF‐7 cells where cell growth was equal to that of the control flask for the whole period.
Clonogenic survival rate of T‐47D cells (Table 1) showed no significant difference between silicon oxide and a control flasks; however, on silicon nitride, lower numbers of colonies were found. Both observations, cell growth data and clonogenic survival rate, suggested silicon oxide to be the preferred coating material for the sensor chips.
In flasks with a sensor chip, coating material was used to cover the chip, only. Thus, each flask bottom was largely a normal cell culture flask surface, while only the small area over the chip was coated. For oxygen measurement experiments represented in Fig. 5 with 4% O2 in the atmosphere, cell attachment and appearances of cells attached to the chip were compared to those on standard culture flask bottom of the same flask. There were no observable effects regarding morphology of cells attached to flask bottoms (Fig. 7 upper row) or to the chip (bottom row). Furthermore, cell density also was the same over the chip as outside chip area (Fig. 6), thus indicating that biocompatibility could be assumed for both T‐47D and T98G cells.
Sensor performance
The SCCF system proved to be able to monitor oxygen concentration in tumour cell culture experiments in situ, with different cell lines, under hypoxic and normoxic incubation conditions. No adverse effects such as cytotoxicity to cell growth or morphology were observed with coating of silicon oxide. Long‐term monitoring of oxygen without the need for recalibration was successfully performed in tumour cell culture experiments with 20% oxygen and 4% oxygen incubation atmospheres. It was found that a run‐in phase of the sensors in cell culture medium was needed to reach stable sensor operation. It is assumed that substances from cell culture medium reached equilibrium between adsorption and desorption on the electrode during these first hours of sensor operation.
Oxygen measurement
20% oxygen incubation conditions
In aerobic incubation (Fig. 4), oxygen tension in both flasks with cells dropped immediately to an almost constant level of around 15%O2 for T‐47D cells and 17%O2 for T98G cells (region A). A similar lag time with T‐47D cells after seeding on silicon oxide was observed during the cell growth experiments (see Fig. 3). Approximately 25 h after seeding, a prominent drop in oxygen concentration began (region B), indicating either elevated cell respiration or cell population growth. To obtain micrographs, cell culture flasks were moved to a microscopy stage and growth medium was shaken. This led to mechanical forces on the cells, as well as to disturbance in diffusion gradients, probably resulting in sudden changes in pericellular oxygen tension as well as other nutrient concentrations. Thus, it can be assumed that mechanical handling during microscopy may have caused this effect. Oxygen sensor reading from region C dropped further as one would expect with increasing cell density. Notable are low oxygen concentration values of around 1% O2 in region D. Such levels are usually associated with hypoxia, but were found with incubation in air as well, when cell density was high enough.
Sensors in the control flask (i.e. without cells) showed stable oxygen concentration of around 20% O2. Minor fluctuations are assumed to be due to possible temperature variations in the incubator room.
4% oxygen incubation conditions
Cells for 4% oxygen incubation conditions were seeded under aerobic conditions and thereafter brought into the incubator with 4% O2 (Fig. 5). Oxygen tension thus dropped while gas exchange occurred in the flask and dissolved oxygen diffused out of the medium (region A). Control flask without cells was placed inside the 4% oxygen incubator prior to flasks with cells. Thus, this curve does not show any drop from atmospheric oxygenation to incubator atmosphere.
Steady reduction in pericellular oxygen concentration after equilibration to the 4% O2 incubation conditions (region B) reflected cell growth and increased overall oxygen consumption leading to steeper oxygen gradients over time. These results are in agreement with findings of 2 and further results obtained with the same method.
Data presented here demonstrate both proof of concept and necessity of pericellular oxygen concentration monitoring during cell culture research. Comparison of monitoring results under different incubation conditions demonstrated that pericellular oxygen tension did not necessarily reflect incubation conditions (20% oxygen, 4% oxygen). Depending on cell density and cell respiration, pericellular oxygen levels with 20% incubation conditions could be found in such a low range, which would usually be associated with hypoxia. Therefore, it is indispensable for any standard cell culture experiment to access pericellular concentration values instead of relying on pre‐set values of the incubator, to obtain reproducible and reliable results. The presented SCCF system can be used for further investigations to understand the cell respiration in more detail, from a physical point of view.
Acknowledgements
The authors thank Gerhard Jobst, Jobst Technologies GmbH, Freiburg, Germany for the valuable discussion and helpful advice, as well as Torbjørn Furre at the Department of Medical Physics, Division of Cancer Medicine, Surgery & Transplantation, Oslo University Hospital for providing the accelerator facilities.
Financial support: Project no. LSCH‐CT‐2003‐502932, acronym “EUROXY”, in the 6th Framework Program, and project no. HEALTH‐F2‐2009‐222741, acronym “METOXIA”, in the 7th Framework Program of the European Union.
Calculation of oxygen consumed by cells in a closed flask.
During the cell culture experiments with air containing 5% CO2, the tissue culture flask was closed in an appropriate atmosphere and kept sealed with tight caps. To ensure that no significant amount of oxygen depletion in the gas atmosphere of the flask can occur, a simple calculation was done.
The number of oxygen molecules in the gas atmosphere is calculated with the partial pressure of oxygen, taking into account the composition of air (20.95% oxygen) and the 5% CO2 at normal pressure p norm = 101.325 kPa:
Assuming ideal gas, the number of oxygen molecules n flask in the gas atmosphere of the flask (volume V = 50 ml) at 37 °C can be calculated as:
where R = 8.314 J/mol/K is the molar gas constant, T is the absolute temperature and N A = 6.022×10²³ mol−1 the Avogadro's constant.
The number of oxygen molecules consumed by 0.5 × 10⁶ cells during a time period of 5 days can be estimated as:
The cellular consumption was assumed to be j cells = 200 × 10−15 mol/h/cell and the doubling time t dbl = 20 h.
The ratio between oxygen consumed by the cells and oxygen available in the gas atmosphere of a closed cell culture flask is n consumed/n flask = 6.63×10⁻⁷. This means that during 5 days with typical values of cell density and respiration, the oxygen concentration inside the gas atmosphere changes <1 ppm.
References
- 1. Ebbesen P, Pettersen EO, Gorr TA, Jobst G, Williams K, Kieninger J et al (2009) Taking advantage of tumor cell adaptations to hypoxia for developing new tumor markers and treatment strategies. J. Enzyme Inhib. Med. Chem. 24, 1–39. [DOI] [PubMed] [Google Scholar]
- 2. Ebbesen P, Eckardt K‐U, Ciampor F, Pettersen EO (2004) Linking measured intercellular oxygen concentration to human cell functions. Acta Oncol. 43, 598–600. [DOI] [PubMed] [Google Scholar]
- 3. Pettersen EO, Larsen LH, Ramsing NB, Ebbesen P (2005) Pericellular oxygen depletion during ordinary tissue culturing, measured with oxygen microsensors. Cell Prolif. 38, 257–267. [DOI] [PMC free article] [PubMed] [Google Scholar]
- 4. Boag JW (1970) Cell respiration as a function of oxygen tension. Int. J. Radiat. Biol. 18, 475–478. [DOI] [PubMed] [Google Scholar]
- 5. Chapman JD, Sturrock J, Boag JW, Crookall JO (1970) Factors affecting the oxygen tension around cells growing in plastic Petri dishes. Int. J. Radiat. Biol. 17, 305–328. [DOI] [PubMed] [Google Scholar]
- 6. Hafeman D, Parce J, McConnell H (1988) Light‐addressable potentiometric sensor for biochemical systems. Science 240, 1182–1185. [DOI] [PubMed] [Google Scholar]
- 7. Owicki JC, Bousse LJ, Hafeman DG, Kirk GL, Olson JD, Wada HG et al (1994) The light‐addressable potentiometric sensor: principles and biological applications. Annu. Rev. Biophys. Biomol. Struct. 23, 87–113. [DOI] [PubMed] [Google Scholar]
- 8. McConnell HM, Owicki JC, Parce JW, Miller DL, Baxter GT, Wada HG et al (1992) The cytosensor microphysiometer: biological applications of silicon technology. Science 257, 1906–1912. [DOI] [PubMed] [Google Scholar]
- 9. Hafner F (2000) Cytosensor microphysiometer: technology and recent applications. Biosens. Bioelectron. 15, 149–158. [DOI] [PubMed] [Google Scholar]
- 10. Eklund SE, Cliffel DE, Kozlov E, Prokop A, Wikswo J, Baudenbacher F (2003) Modification of the Cytosensor™ microphysiometer to simultaneously measure extracellular acidification and oxygen consumption rates. Anal. Chim. Acta 496, 93–101. [Google Scholar]
- 11. Eklund SE, Taylor D, Kozlov E, Prokop A, Cliffel DE (2004) A microphysiometer for simultaneous measurement of changes in extracellular glucose, lactate, oxygen, and acidification rate. Anal. Chem. 76, 519–527. [DOI] [PubMed] [Google Scholar]
- 12. Wolf B, Brischwein M, Baumann W, Ehret R, Kraus M (1998) Monitoring of cellular signalling and metabolism with modular sensor‐technique: the PhysioControl‐Microsystem (PCM). Biosens. Bioelectron. 13, 501–509. [DOI] [PubMed] [Google Scholar]
- 13. Baumann W, Lehmann M, Schwinde A, Ehret R, Brischwein M, Wolf B (1999) Microelectronic sensor system for microphysiological application on living cells. Sensor Actuat B‐CHEM 55, 77–89. [Google Scholar]
- 14. Lehmann M, Baumann W, Brischwein M, Gahle H, Freund I, Ehret R et al (2001) Simultaneous measurement of cellular respiration and acidification with a single CMOS ISFET. Biosens. Bioelectron. 16, 195–203. [DOI] [PubMed] [Google Scholar]
- 15. Ehret R, Baumann W, Brischwein M, Lehmann M, Henning T, Freund I et al (2001) Multiparametric microsensor chips for screening applications. Fresenius J. Anal. Chem. 369, 30–35. [DOI] [PubMed] [Google Scholar]
- 16. Henning T, Brischwein M, Baumann W, Ehret R, Freund I, Kammerer R et al (2001) Approach to a multiparametric sensor‐chip‐based tumor chemosensitivity assay. Anticancer Drugs 12, 21–32. [DOI] [PubMed] [Google Scholar]
- 17. Wiest J, Brischwein M, Ressler J, Otto AM, Grothe H, Wolf B (2005) Cellular assays with multiparametric bioelectronic sensor chips. Chimia 59, 243–246. [Google Scholar]
- 18. Mestres P, Morguet A (2009) The Bionas technology for anticancer drug screening. Expert Opin. Drug Discov. 4, 785–797. [DOI] [PubMed] [Google Scholar]
- 19. Weltin A, Kieninger J, Urban G, Moser I, Jobst G, Wego M et al (2010) A novel multiparametric microphysiometry system for dynamic cell culture monitoring. Proc. IEEE Sens. 2010, 2113–2116. [Google Scholar]
- 20. Kellner K, Liebsch G, Klimant I, Wolfbeis OS, Blunk T, Schulz MB et al (2002) Determination of oxygen gradients in engineered tissue using a fluorescent sensor. Biotechnol. Bioeng. 80, 73–83. [DOI] [PubMed] [Google Scholar]
- 21. Guarino RD, Dike LE, Haq TA, Rowley JA, Pitner JB, Timmins MR (2004) Method for determining oxygen consumption rates of static cultures from microplate measurements of pericellular dissolved oxygen concentration. Biotechnol. Bioeng. 86, 775–787. [DOI] [PubMed] [Google Scholar]
- 22. Lee S, Ibey BL, Coté GL, Pishko MV (2008) Measurement of pH and dissolved oxygen within cell culture media using a hydrogel microarray sensor. Sensor Actuat B‐CHEM 128, 388–398. [Google Scholar]
- 23. Kieninger J, Dannenberg A, Aravindalochanan K, Jobst G, Pettersen EO, Urban GA (2007) Amperometric oxygen sensor array with novel chronoamperometric protocols for hypoxic tumor cell cultures. TRANSDUCERS 2007, 1907–1910. [Google Scholar]
- 24. Aravindalochanan K, Kieninger J, Sandvik JA, Pettersen EO, Urban GA (2009) Optimising a nitric oxide sensing technique for hypoxic tumor cell cultures. TRANSDUCERS 2009, 1003–1006. [Google Scholar]
- 25. Aravindalochanan K, Kieninger J, Urban GA, Jobst G (2009) Simulation and design of a nitric oxide sensor array for cell cultures. Proc. IEEE Sens. 2009, 325–328. [Google Scholar]
- 26. Kieninger J, Aravindalochanan K, Urban GA, Sandvik JA, Pettersen EO, Jobst G (2010) Monitoring of peri‐cellular oxygen levels in tumor cell cultures by amperometric oxygen sensor array. Proc. IEEE Sens. 2010, 1234–1237. [Google Scholar]
- 27. Jobst G, Urban G, Jachimowicz A (1993) Thin‐film Clark‐type oxygen sensor based on novel polymer membrane systems for in vivo and biosensor applications. Biosens. Bioelectron. 8, 123–128. [Google Scholar]
- 28. Jobst G, Moser I, Varahram M, Svasek P, Aschauer E, Trajanoski Z et al (1996) Thin‐film microbiosensors for glucose‐lactate monitoring. Anal. Chem. 68, 3173–3179. [DOI] [PubMed] [Google Scholar]
- 29. Clark LCJ (1956) Monitoring and control of blood and tissue oxygen tensions. Trans. Am. Soc. Art. Int. Org. 2, 41–48. [Google Scholar]
- 30. Probst H, Schiffer H, Gekeler V, Kienzle‐Pfeilsticker H, Stropp U, Stötzer K‐E et al (1988) Oxygen dependent regulation of DNA synthesis and growth of Ehrlich ascites tumor cells in vitro and in vivo. Cancer Res. 48, 2053–2060. [PubMed] [Google Scholar]
- 31. Soule HD, Vazguez J, Long A, Albert S, Brennan M (1973) A human cell line from a pleural effusion derived from a breast carcinoma. J. Natl. Cancer Inst. 51, 1409–1416. [DOI] [PubMed] [Google Scholar]
- 32. Keydar I, Chen L, Karby S, Weiss FR, Delarea J, Radu M et al (1979) Establishment and characterization of a cell line of human breast carcinoma origin. Eur. J. Cancer 15, 659–670. [DOI] [PubMed] [Google Scholar]
- 33. Stein GH (1979) T98G: an anchorage‐independent human tumor cell line that exhibits stationary phase G1 arrest in vitro. J. Cell. Physiol. 99, 43–54. [DOI] [PubMed] [Google Scholar]
- 34. Puck TT, Marcus PI (1956) Action of x‐rays on mammalian cells. J. Exp. Med. 103, 653–666. [DOI] [PMC free article] [PubMed] [Google Scholar]


