

Abstract
Objectives
Angiogenesis is closely associated with osteogenesis where reciprocal interactions between endothelial and osteoblast cells play an important role in bone regeneration. For these reasons, the aim of this work was to develop a co‐culture system to study in detail any time‐dependent interactions between human mesenchymal stem cells (HMSC) and human dermal microvascular endothelial cells (HDMEC), co‐cultured in a 2D system, for 35 days.
Materials and methods
HMSC and HDMEC were co‐cultured at a ratio of 1:4, respectively. Single‐cell cultures were used as controls. Cell viability/proliferation was assessed using MTT, DNA quantification and calcein‐AM assays. Cell morphology was monitored using confocal microscopy, and real time PCR was performed. Alkaline phosphatase activity and histochemical staining were evaluated. Matrix mineralization assays were also performed.
Results
Cells were able to grow in characteristic patterns maintaining their viability and phenotype expression throughout culture time, compared to HMSC and HDMEC monocultures. HMSC differentiation seemed to be enhanced in the co‐culture conditions, since it was observed an over expression of osteogenesis‐related genes, and of ALP activity. Furthermore, presence of calcium phosphate deposits was also confirmed.
Conclusions
This work reports in detail the interactions between HMSC and HDMEC in a long‐term co‐culture 2D system. Endothelial and mesenchymal stem cells cultured in the present co‐culture conditions ensured proliferation and phenotype differentiation of cell types, osteogenesis stimulation and over‐expression of angiogenesis‐related genes, in the same culture system. It is believed that the present work can lead to significant developments for bone tissue regeneration and cell biology studies.
Introduction
Different approaches have been proposed and developed as strategies to achieve successful bone regeneration, such as growth factor delivery systems and pre‐seeded co‐cultured cells in biomaterial/scaffolds 1, 2, 3, 4, 5, 6, 7, 8. These strategies need to be ample to allow rapid neo‐vascularization and bone cell population growth, due to high cell proliferation 1, 9. In tissue engineering, lack of functional microvasculature is associated with insufficient supply of oxygen and nutrients, and inadequate metabolic waste product removal, from porous, large implants' inner parts, leading to hypoxia, poor cell survival and cell death 4, 5, 10, 11, 12. Moreover, extensive vascular networks allow for continuous availability of precursor cells and biological mediators involved in cell‐to‐cell communication 4, 11, 13, 14. Furthermore, it is well known that angiogenesis and osteogenesis are intimately associated, where formation of a functional vascular network precedes osteogenesis, this new vasculature being the ‘point‐of‐reference’ for Harversian bone formation 13, 14, 15. Consequently, for bone‐regeneration strategies, it is important to understand interactions between endothelial cells/osteoblasts and mesenchymal stem cells (MSC) 4. MSC differ from osteoblasts, in that they are multipotential adult cells that have the ability to self‐renew and the capability of differentiation into a wide range of cell types (such as osteogenic, adipogenic and chondrogenic lineages) and can be modulate by signals from the local environment, that affect their differentiation 16, 17. MSC can be isolated from different sources such as bone marrow, umbilical cord, adipose tissue, skin and amniotic fluid. In the present study, bone marrow‐derived mesenchymal stem cells were used, as high‐quality results have been achieved in the clinic using this cell type for bone, cartilage and spinal cord regeneration 18, 19. Several co‐culture systems have been developed to recreate more closely the in vivo environment, compared to single‐cell cultures.
Co‐culture studies mostly involve short‐period protocols and have previously been assessed using osteoblast lineages 20, 21, 22, human primary osteoblasts 7, 23, 24 or osteoprogenitor cells 25, 26, 27 co‐cultured with endothelial cells isolated from macro‐vascularization 28, 29. Macrovascular endothelial cells are easier to isolate and to maintain in culture, compared to microvascular endothelial cells that require more intensive and time‐consuming labour 20. However, it is worth noting that inflammatory and angiogenic responses following biomaterial applications predominantly involve microvascular endothelial cells 29, 30, 31. Regarding this, Lang et al. have demonstrated evidence that supports phenotypic and physiological heterogeneity between microvascular and macrovascular endothelial cells 20. Furthermore, only a few studies have been conducted using cells not committed to the osteoblast phenotype, such as human mesenchymal stem cells. In addition, co‐culture studies have mainly addressed the influence of endothelial cells on osteoblast proliferation and differentiation 5, 12, 22, 31. However, the reciprocal situation, that is effects of osteoblast presence, on endothelial cell behaviour, has received less consideration.
In this context, the aim of the present study was to develop in vitro culture conditions in which human dermal microvascular endothelial cells' (HDMEC) and human mesenchymal stem cells' (HMSC) viability, morphology and phenotype gene expression were measured. For this, the time‐dependent interactions between HDMEC and HMSC in a long‐term 2D co‐culture system are reported in detail, to further apply this strategy for bone regeneration.
Materials and methods
Cell culture
Human dermal microvascular endothelial cells
HDMEC were purchased from Sciencell and were cultured on cell culture plates with endothelial (EC) culture basal medium (Sciencell, Carlsbad, CA, USA) containing 5% of foetal bovine serum (FBS; Sciencell), 10 units/ml penicillin, 10 μg/ml streptomycin (P/S solution; Sciencell) and endothelial cell growth supplement (ECGS; Sciencell). Incubation was carried out in a humidified atmosphere of 95% air and 5% CO2 at 37 °C.
Human mesenchymal stem cells
Human bone marrow was obtained from orthopaedic surgery procedures, with patient informed consent. Cell suspensions were cultured on cell culture plates with minimum essential Eagle's medium with alpha modification (α‐MEM; Sigma, St. Louis, MO, USA), containing 10% foetal bovine serum (FBS; Sigma), 100 μg/ml penicillin (Sigma) and 10 units/ml streptomycin (Sigma). Incubation was carried out in a humidified atmosphere of 95% air and 5% CO2 at 37 °C; cells used were from passage 3. HMSC characterized by flow cytometry positively expressed CD105, CD73 and CD90 and did not express CD45, CD34,CD14, CD19 and CD31.
Co‐culture of HDMEC and HMSC
HDMEC and HMSC, arising from the third subculture, were co‐cultured at cell density of 8 × 10³ cells/cm2 HDMEC and 2 × 10³ cells/cm2 HMSC, to final concentration of 104 cells/cm2. Medium used was 50:50 mixture of EC culture medium and HMSC culture medium. Cultures were maintained for 35 days on cell culture plates. Monocultures of HDMEC and HMSC, maintained in the same experimental conditions, were used as controls. HDMEC and HMSC monocultures were seeded at 104 cells/cm2, to result in the same final cell concentration as that used for the co‐cultures. Monocultures and co‐cultures were characterized throughout the incubation time, as follows.
Cell viability/proliferation
MTT assay
Mitochondrial dehydrogenase activity of cells was determined using the substrate 3‐(4,5‐di‐methylthiazol‐2‐yl)‐2,5‐diphenyl tetrazolium bromide (MTT; Sigma), which becomes reduced to a formazan reaction product accumulating in the cytoplasm of viable cells. Ten microlitres of MTT solution (5 mg/ml) was added to 96‐well culture dishes containing 100 μl of medium, and incubated at 37 °C in a humidified atmosphere of 95% air and 5% CO2 for 3 h. Formazan salts were dissolved with 200 μl dimethylsulphoxide and absorbance was measured at 550 nm, on an ELISA reader (Synergy HT; Bio‐Tek, Winooski, UT, USA) 11. MTT assay was performed at days 7, 14, 21 28 and 35.
DNA assay
Cell proliferation was evaluated using the PicoGreen DNA quantification assay (Quant‐iT™ PicoGreen® dsDNA Assay Kit; Molecular Probes Inc., Eugene, OR, USA), at 7, 14, 21, 28 and 35 days; cells were treated with Triton X‐100 (0.1%) (Sigma). After PicoGreen reagent was added to samples, fluorescence was measured using a plate reader (Synergy HT; Bio‐Tek) at excitation and emission wavelengths of 480 and 520 nm, respectively, and corrected for fluorescence of reagent blanks. Amounts of DNA were calculated by extrapolating from a standard curve obtained by running the assay with the given DNA standard.
Calcein‐AM assay
Cells were incubated in 0.1 μm calcein‐acetoxymethylester (Calcein‐AM; Molecular Probes) for 30 min at 37 °C. Calcein‐AM was converted by viable cells' intracellular esterases into membrane‐impermeable fluorescent calcein that spread throughout the cell cytoplasm. Fluorescence was visualized by confocal laser scanning microscopy (CLSM; Leica TCP SP2 AOBS, Mannheim, Germany) 11 and was conducted at days 7, 14, 21 28 and 35.
Immunostaining of F‐actin cytoskeleton, CD31 and nuclei
Cells were fixed in 4% formaldehyde (methanol‐free; Sigma) for 15 min, permeabilized with 0.1% Triton for 5 min, then incubated in 1% bovine serum albumin (BSA)/PBS for 1 h.
Monocultures of HMSC were stained for F‐actin, with Alexa‐Fluor‐conjugated phalloidin (Alexa Fluor® 488 Phalloidin; Molecular Probes) diluted 1:100 in 1% BSA/PBS for 60 min. Nuclei were stained with 10 μg/ml propidium iodide (Sigma) diluted in PBS for 10 min.
HDMEC and co‐cultures were incubated in primary CD31 antibody (PECAM‐1 (P2B1) sc‐20071; Santa Cruz Biotechnology, Santa Cruz, CA, USA) diluted 1:100 in 1% BSA/PBS for 45 min and then labelled with secondary antibody, anti‐mouse Alexa‐Fluor [Alexa Fluor 488 goat anti‐mouse IgG1 (ϒ1); Molecular Probes] diluted 1:1000 in 1% BSA/PBS for 45 min; after that specimens were counterstained in 10 μg/ml propidium iodide (Sigma) for 10 min. Samples were washed in PBS and covered with Vectashield (Vector Laboratories, Burlingame, CA, USA) 11. CLSM images were acquired on a Leica TCP SP2 AOBS, at days 7, 14 and 21.
Alkaline phosphatase activity and histochemical staining
Cell cultures were washed in PBS and cell lysis buffer containing 0.1% Triton X‐100 (Sigma). Then they were frozen at −20 °C and later thawed at 37 °C for 5 min to measure alkaline phosphatase (ALP) activity. Enzyme activity, measured at days 7, 14 and 21, was assayed by substrate hydrolysis (p‐nitrophenyl phosphate) (Sigma) in alkaline buffer solution (2‐amino‐2‐methyl‐1‐propanol) (Sigma), at pH 10.5. After 1‐h incubation at 37 °C, NaOH (1 m) was added to end the reaction and the hydrolysis product (p‐nitrophenol) was measured at 405 nm using an ELISA reader (Synergy HT; Bio‐Tek) 32.
For histochemical staining, cultures fixed in 1.5% glutaraldehyde in 0.14 m sodium cacodylate buffer, for 10 min, were incubated in the dark for 1 h at 37 °C in Na‐l‐naphtyl phosphatase/Fast blue salt (Sigma). After being rinsed in deionized water and air‐dried, for observation using a stereo microscope (model SZX10; Olympus) 33.
Histochemical staining of calcium deposition
For calcium staining, fixed cultures (1.5% glutaraldehyde in 0.14 m sodium cacodylate buffer, 10 min) were covered in 1% alizarin sodium solution (0.028% in NH4OH), pH = 6.4, for 2 min, then rinsed in distilled water and acid ethanol (ethanol, 0.01% HCL) 33; calcium deposits stained red. The assay was performed at days 7, 14 and 21. Samples were observed under a stereo microscope (model SZX10; Olympus).
Scanning electron microscopy
For scanning electron microscopic (SEM) observation, fixed cultures were dehydrated in graded series of alcohols and critical‐point dried. Samples were attached to carbon tape in an aluminium support and coated with colloidal gold for around 13 min, before being observed using a FEI Quanta 400FEG ESEM/EDAX Genesis X4M (Hilsboro, OR, USA) scanning electron microscope. Samples were collected from days 7, 14 and 21.
Flow cytometry – cell sorting
Fluorescence‐activated cell sorting (FACS) is a specialized method of flow cytometry that results in separation of different cell types. It is applied to automatic sorting of heterogeneous cell mixtures depending on fluorescence characteristics of individual cells, usually achieved by staining of different cell populations with fluorescence‐labelled antibodies against specific surface proteins, in this case FITC‐conjugated anti‐human CD31 antibody 34. HDMEC, HMSC and co‐cultured cells were detached with trypsin at different time‐points, days 7, 14 and 21. Single cells were suspended at 105–107 cells/ml and stained with FITC‐conjugated antibody anti‐human CD31 (PECAM‐1) (BD Biosciences, Franklin Lakes, NJ, USA), then washed and resuspended in a final volume of 250 μl. Using a BD FACSAria™ II system, CD31‐positive (labelled cells, CD31+) and negative (CD31−) populations were gated and sorted into different Eppendorf collectors. HDMEC and HMSC monocultures were used as controls, to confirm whether or not CD31 expression was present, and to evaluate any auto‐fluorescence. Populations of HDMEC cells from the co‐culture (cHDMEC) were gated in the CD31+ cell quadrant, sorted in exclusion mode, and collected into Eppendorf vessels. Population of HMSC cells from the co‐culture (cHMSC) were gated in the CD31‐cell quadrant, also sorted in exclusion mode, and collected into different Eppendorf vessels 34. Numbers of sorted events were 50 000 per sample. Data processing was performed using FlowJo software 8.7 (Ashland, OR, USA).
Real time gene expression by real‐time polymerase chain reaction
Real‐time polymerase chain reaction (RT‐PCR) amplification was performed for HDMEC and HMSC monocultures, and also, for cHDMEC and cHMSC (populations sorted by FACS from the co‐culture) at 7, 14 and 21 days. The following genes were assessed: COL 1, ALP, BMP2, ANGPT2, ANGPT1, VEGF‐165, RUNX2, vWF and VE‐cadherin. Total RNA was extracted using the NucleoSpin® RNA II kit (Macherey‐Nagel, Düren, Germany) according to the manufacturer′s instructions. Isolated RNA was dissolved in RNase‐free water, and final concentration of RNA was determined using a NanoDrop 1000 instrument (NanoDrop Technologies; NanoDrop 3.0.1 software, (Westlake Village, CA, USA) Coleman Technologies, Inc., Newtown Square, PA, USA).
Isolated RNA was reverse transcribed using the SuperScript® First‐Strand Synthesis System for RT‐PCR (Invitrogen, Carlsbad, CA, USA) into cDNA, according to the protocol provided by the supplier. cDNA (1 μl) was loaded in a 96‐well plate and components of SYBR‐Green Supermix (iQTM; Bio‐Rad, Hercules, CA, USA) were added, according to the manufacturer's instructions. Adopted primer conditions are summarized in Table 1. Data were analysed using iCycler IQTM software, and gene expression was quantified by calculating 2ΔCt values and ΔCt = (Ct, reference gene – Ct, target gene) 35.
Table 1.
Primers for PCR amplification
| Gene | GenBank | Primers sequences | T m (°C) |
|---|---|---|---|
| GAPDH | NM_00246 |
Forward 5′‐TAACTCTGGTAAAGTGGATATTG‐3′ Reverse 5′‐GAAGATGGTGATGGGATTTC‐3′ |
58 |
| COL1 | NM_000088 |
Forward 5′‐GGAATGAGGAGACTCGCAACC‐3′ Reverse 5′‐TCAGCACCACCGATGTCCAAA‐3′ |
58 |
| BMP2 | NM_001200 |
Forward 5′‐ATGAAGAATCTTTGGAAGAACTAC‐3′ Reverse 5′‐GGTGATGGAAACTGCTATTG‐3′ |
58 |
| vWF | NM_000552 |
Forward 5′‐AAGAAAATAACACAGGTGAA‐3′ Reverse 5′‐TACTCTCCTCTCTCATTGAC‐3′ |
58 |
| ALP | NM_001177530 |
Forward 5′‐AGCCCTTCACTGCCATCCTGT‐3′ Reverse 5′‐ATTCTCTCGTTCACCGCCCAC‐3′ |
58 |
| RUNX2 | NM_001024630 |
Forward 5′‐GGGTAACGATGAAAATTATTCT‐3′ Reverse 5′‐TTAATTGCTCTGTGATAGGTA‐3′ |
58 |
| ANGPT1 | NM_001199859 |
Forward 5′‐ACCGAGCCTATTCACAGTAT‐3′ Reverse 5′‐ACAGTTGTCATTATCAGCATCTT‐3′ |
58 |
| ANGPT2 | NM_001118888 |
Forward 5′‐GTGATTAGACAGAACACCTATGC‐3′ Reverse 5′‐AACAGTGCTCAGAAGAATGC‐3′ |
58 |
| VE‐cadherin | NM_001795 |
Forward 5′‐GCAATAGACAAGGACATAACA‐3′ Reverse 5′‐TAGGAAGTGGACCTTGGTAT‐3′ |
58 |
| VEGF‐165 | AB021221 |
Forward 5′‐TATGCGGATCAAACCTCACCA‐3′ Reverse 5′‐CACAGGGATTTTTCTTGTCTTGCT‐3′ |
58 |
Matrigel tube‐like formation assay
Matrigel (Sigma) was diluted 1:1 with cell culture medium, to cover 24‐well plates' bottoms. After 1 h at 37 °C, cells were seeded at final concentration of 1 × cells/cm2 (HDMEC). Phase‐contrast images were taken using an inverted microscope (Axiovert 200M; Zeiss, Jena, Germany), after 3 days of culture.
Statistical analysis
Triplicate experiments were performed and results are expressed as arithmetic mean ± SD. Analysis of results was carried out using IBM spss Statistics 19 (Armonk, NY, USA) and statistical analysis was performed using the one‐way ANOVA, with significance level of P < 0.05.
Results
Cell viability/proliferation and pattern of cell growth
MTT assay and DNA quantification
Data from MTT assays (Fig. 1a) indicated that cell viability of HDMEC and HMSC cultures increased up to day 21, decreasing slightly afterwards. HDMEC presented lower values compared to HMSC. Co‐cultures showed similar time‐dependent pattern, and values were similar to those found in HMSC, but at day 21, values were significantly higher.
Figure 1.
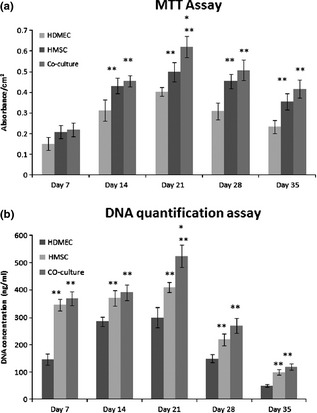
Cell viability and proliferation of monocultured and co‐cultured HMSC and HDMEC. (a) MTT assay and (b) DNA quantification. Assays were performed after 7, 14, 21, 28 and 35 days of culture. Values reported are the mean (±SD) [*Significantly different from HMSC, for the same culture time; **Significantly different from HDMEC, for the same culture time (P < 0.05; n = 3)].
Total DNA quantification assay, Fig. 1b, provided similar information. HDMEC, HMSC and co‐cultured cells proliferated during the first 3 weeks of culture, reaching a maximum peak at day 21, decreasing afterwards to day 28. HDMEC had the lowest proliferation values; less DNA being detected at all time points compared to HMSC monoculture and to co‐cultures. Co‐cultures presented values similar to HMSC, but higher proliferation at day 21. It seems HMSC and co‐culture cells had higher proliferation levels.
Calcein‐AM staining
Calcein‐AM staining (Fig. 2) indicated that HMSC and HDMEC maintained their viability throughout the culture time, both in monocultures and in co‐culture. In addition, the two cell types exhibited their normal morphology, that is elongated appearance for HMSC and smaller and rounded in shape for HDMEC; they presented extensive cell‐to‐cell contact. Cells were able to spread, and progressively they covered well surfaces showing typical cell population growth patterns, that is, formation of parallel orientation in HMSC cultures and a tendency for circular orientation in HDMEC cultures. In co‐cultures, the two cell types were easily identified based on their size and morphology. HDMEC maintained their typical circular orientation and HMSC appeared mainly located around HDMEC clusters. By day 28, clusters were getting bigger, and images show only frontiers between the two cell types. At day 35, lower cell viability was observed, this being in agreement with results of the MTT assay.
Figure 2.
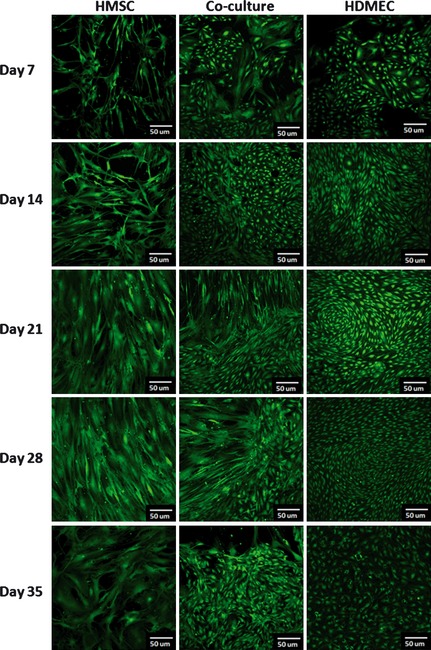
Confocal laser scanning microscopy ( CLSM ) images of monocultured and co‐cultured HMSC and HDMEC . Cells were incubated with Calcein AM and viable cells present a green fluorescence. Images were collected after 7, 14, 21, 28 and 35 days of culture.
Immunostaining of F‐actin, CD31 and nuclei
HMSC cultures were stained to demonstrate their F‐actin cytoskeleton and their nuclei. At day 7, cells had elongated morphology with well‐defined nuclei and cell‐to‐cell contacts. Cells adopted an apparently random growth pattern and converted to fibroblast‐like morphology at later time points. HDMEC cultures, stained intensively for CD31 and nuclei, demonstrated evident organization in cell clusters that expanded over the culture time. Similar to suggested after calcein‐AM staining, circular growth patterns were identified within these cell clusters. Also, co‐cultures, stained for CD31 and nuclei, indicated that HDMEC grew in tight clusters surrounded by HMSC. Figure 3 shows representative CLSM images.
Figure 3.
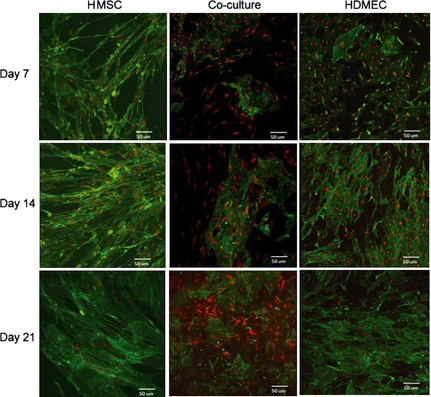
Confocal laser scanning microscopy (CLSM) images of monocultured and co‐cultured HMSC and HDMEC. Monocultures of HMSC were stained for F‐actin (36) and nuclei with propidium iodide (red). HDMEC and co‐cultures were stained for CD31 (36) and nuclei with propidium iodide (red). Images were collected after 7, 14 and 21 days of culture.
ALP activity
Figure 4a refers to ALP activity, an established osteoblastic parameter, measured in isolated and co‐cultured HDMEC and HMSC cultures. Enzymatic activity was assessed for 21 days, as MTT and calcein‐AM assays showed some deterioration of the cultures during the final week. ALP was detected in HDMEC, although at very low values. In HMSC cultures, ALP was synthesized during the culture time, but increased significantly between days 14 and 21. Comparatively, co‐cultures presented higher ALP activity at days 14 and 21. Histochemical staining (Fig. 4b) revealed presence of ALP positive HDMEC and HMSC in monoculture and co‐culture, for all time points of the cultures (days 7, 14 and 21). HMDEC monocultures presented weak positive reactions. Regarding HMSC monoculture, more positive cells were observed over the culture time. However, a higher amount of positive cells was detected in co‐cultured cells compared to HMSC monoculture, especially by day 21. These results are in agreement with those described previously for ALP activity.
Figure 4.
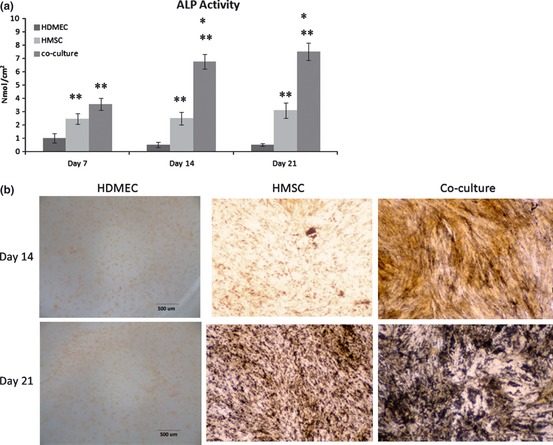
Alkaline phosphatase assays. (a) ALP activity, (b) ALP gene expression and ALP histochemical staining of monocultured and co‐cultured HMSC and HDMEC. Values reported are the mean (±SD) and assays were performed after 7, 14 and 21 days of culture [ALP activity – *significantly different from HMSC, for the same culture time; **significantly different from HDMEC, for the same culture time; ALP gene expression – *1, significantly different from HMSC, for the same culture time;*2 significantly different from HDMEC and cHDMEC, for the same culture time (P < 0.05; n = 3)].
Matrix mineralization
Alizarin red staining for presence of calcium deposits was positive for co‐cultured cells. Very intense colour was detected in the later days of culture, Fig. 5a. SEM observation of 21‐day co‐culture revealed abundant cell layers and presence of closely associated mineralized structures, showing presence of Ca and P peaks on X‐ray analysis, Fig. 5b.
Figure 5.
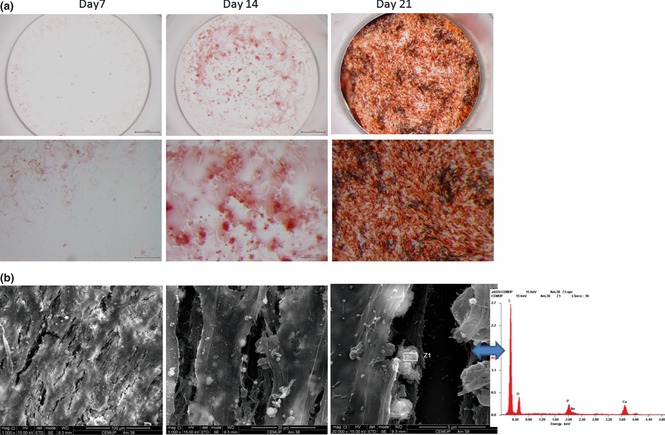
Matrix mineralization. (a) Alizarin red histochemical staining performed in co‐cultured cells, at 7, 14 and 21 days. (b) SEM images of HMSC and HDMEC co‐cultured after 21 days. Mineralized globular structures were identified in close association with cell layers, and EDS spectrum showed the presence of Ca and P peaks.
Osteoblasts and endothelial gene expression
Figure 6 shows results of RT‐PCR analyses performed on HMSC and HDMEC monocultures, and cHMSC and cHDMEC (populations sorted from co‐cultures), for time‐dependent expression of phenotype markers. Gene expression was evaluated throughout the 21 days. MTT assay and DNA quantification had higher values at day 21, reflecting high viability of the cell cultures; this was also confirmed by calcein‐AM staining. Cultures were assessed for COL 1, ALP and RUNX2, genes typically related to osteoblastic differentiation, and ANGPT1 and ANGPT2, angiogenesis factors that modulate endothelial cell differentiation, survival and stability. Two important growth factors, BMP2 and VEGF‐165, were assessed, as well as vWF and VE‐cadherin which are important endothelial markers.
Figure 6.
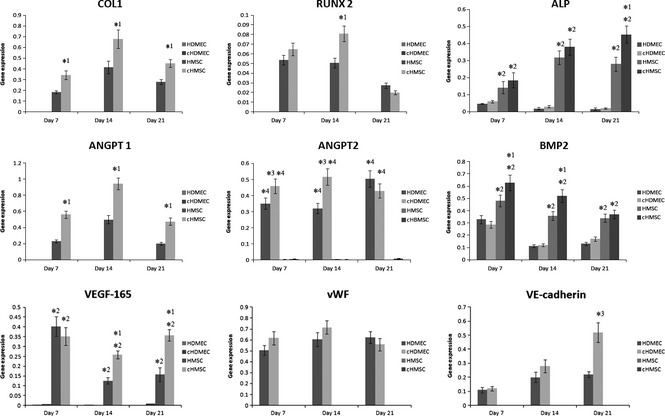
Real time PCR analyses. It was performed in HMSC and HDMEC monocultures, cHMSC and cHDMEC (the populations sorted from the co‐cultures) for gene expression related with osteoblastic and endothelial markers. Values reported are the mean (±SD) and assay was performed after 7, 14 and 21 days of culture [*1, significantly different from HMSC, for the same culture time; *2, significantly different from HDMEC and cHDMEC, for the same culture time; *3, significantly different from HDMEC, for the same culture time; *4, significantly different from HMSC and HMSC, for the same culture time (P < 0.05; n = 3)].
HMSC and cHMSC expressed COL 1, RUNX2, ALP, BMP2, ANGPT1 and VEGF‐165 in a time‐dependent manner. In HMSC, expression of COL 1 and ANGPT1 increased until day 14 and decreased afterwards, whereas expression of ALP also increased until day 14, but was approximately constant afterwards. Expression of RUNX2 was similar at days 7 and 14, and decreased at day 21. Higher level of expression for BMP2 was observed at day 7, decreasing afterwards and reaching similar levels at days 14 and 21. Maximum levels of VEGF‐165 were also attained at day 7, decreasing significantly between days 7 and 14, and increasing slightly afterwards. ANGPT2 was also expressed by these cells, but at very low levels. Comparatively, cHMSC had significantly higher levels of gene expression profiles of COL 1 (at all time‐points), RUNX2 (day 14), ALP (especially, day 21), BMP2 (days 7 and 14), ANGPT1 (all time‐points) and VEGF‐165 (days 14 and 21).
HDMEC and cHDMEC expressed endothelial genes such as vWF and VE‐cadherin with distinct time‐dependent profile. In HDMEC, high levels of expression of vWF was observed throughout culture times, increasing slightly after day 7, and with similar values at days 14 and 21. VE‐cadherin expression was low at day 7, but increased until day 14, being approximately constant afterwards. In addition, HDMEC cultures expressed ANGPT2 and BMP2. ANGPT2 expression levels were similar at days 7 and 14, by higher by day 21. Expression level of BMP2 was higher on day 7 and decreased slightly afterwards. However, levels were lower than those measured of HMSC. VEGF‐165 was barely detected. In comparison, cHDMEC presented higher expression levels for vWF (days 7 and 14, although without statistical significance), VE‐cadherin (day 21) and ANGPT2 (days 7 and 14, and maximum levels were attained earlier).
Matrigel tube‐like formation assay
HDMEC were able to form networks of capillary‐like tubes after only 3 days culture (Fig. 7).
Figure 7.
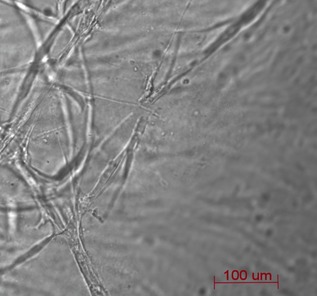
Capillary‐like tubes formed by HDMEC after 3 days of culture in Matrigel.
Discussion
Taking into account the available literature on co‐culture systems of endothelial and osteoblast cells, there is no consensus on optimal conditions for this type of co‐culture. Reports have described different experimental conditions regarding cell ratio and culture medium. Furthermore, most studies have compared co‐cultures to monocultures in terms of endothelial or osteoblast parameters, but none focused on both.
The work presented here is of an in vitro cell culture model system to ensure HDMEC and HMSC co‐culture viability, characteristic morphology and phenotype gene expression. This optimized cell culture model can be used for studying reciprocal regulations and functional interactions between these two cell types and on cell‐substrate interactions, concerning both osteogenic and angiogenic outcome parameters.
To guarantee continuous cell contact and interaction, the initial ratio of seeded cells (4:1, respectively HDMEC:HMSC) was decided upon, based on proliferation level of each cell type in the present culture conditions, and also, in flow cytometry studies showing that at this proportion, presence of HDMEC was guaranteed, even after 21 days culture, without affecting characteristic morphology and phenotype gene expression of either cell type. Cell proportions inferior to 4:1 resulted in overgrowth of HMSC with disappearance of HDMEC only after 14 days culture. Furthermore, these results are in accordance with the literature, where Unger et al. 3 co‐cultured HDMEC isolated from juvenile foreskin with MG‐63 and human osteoblasts, in endothelial medium, showing that ratios between 5:1 and 10:1 respectively, HDMEC:MG‐63 (or primary osteoblasts) resulted in presence of both cell types after 1 week of culture, whereas using other ratios, no endothelial cells would be present after this culture time. Also, Zang et al. 34 observed that initial levels were not constant over culture time and changes occurred in proportions of MG‐63 cells and HUVECs cultured together in endothelial medium. Over time, ratio of MG‐63 and HUVECs changed from 1:5 to 1:1 after 5 days culture. However, the aforementioned studies were conducted over short periods only, whereas in the present study, cultures were maintained for 35 days. Furthermore, none of their studies was conducted with HMSC and HDMEC.
Regarding the choice of cell‐culture medium, it is difficult to define a common medium for co‐cultures, in which all cell types would be able to grow. However, in this study, HDMEC were the more sensitive cell type, having higher demands for survival. So, a supplemented endothelial medium should be used to sustain HDMEC viability especially in monoculture, as one of the aims of the work was to compare HDMEC in monoculture with co‐cultured HDMECs. The medium used was a mixture (50:50) of EC culture medium (from Sciencell supplemented with ECGS) and HMSC culture medium (α‐MEM containing 10% FBS).
Results of MTT assays indicated that viability/proliferation of HDMEC and HMSC followed similar profiles, that is, they increased up to day 21 and started to decrease at day 28, in agreement with DNA quantification and CLSM observations; in addition, HDMSC over all time‐points exhibited lower values in both MTT and DNA assays, as expected for their lower proliferation ratio. Regarding co‐cultures, significantly higher values were observed at day 21 compared to monocultures. As cell plating density was similar in monocultures and co‐cultures, results suggest that co‐cultured cells achieved higher proliferation rates, at least after 3 weeks. This might be related to cell interactions involving direct cell‐cell contact or paracrine communication via soluble factors, known to modulate cell proliferation 15, 28.
Concerning cell population growth patterns, HMSC cultures adopted fibroblast‐like development and HDMEC cultures had circular orientation, as previously described for these cell types 11, 20. Regarding co‐cultures, HDMEC formed clusters and HMSC organized themselves around these groupments, suggesting that their growth pattern was conditioned by the endothelial cells. This organization might possibly reflect or be related to bone structure, where mineralized collagen fibres are arranged in concentric rings around blood vessels. Furthermore, in vivo, formation first of a microvascular network is required for osteogenesis to occur 20.
HMSC and cHMSC expressed genes typically related to osteoblast differentiation, such as COL 1, ALP and RUNX2. Also ANGPT1, an angiogenic factor that modulates endothelial cell differentiation, was expressed by these cells. BMP2 was also expressed by HMSC and HDMEC, in monoculture and co‐culture. HDMEC cHDMEC expressed vWF and VE‐cadherin – important endothelial markers. These results show that osteoblast and endothelial phenotypes were achieved and maintained in monoculture conditions. However, genetic profiles of cHMSC and cHDMEC were distinct from those observed in respective control monocultures, concerning time‐dependent expression, and in addition, most genes were over‐expressed in co‐cultures.
Type 1 collagen is the most abundant extracellular bone protein, and is also considered to be an early bone differentiation marker; it is the imperative pro‐angiogenic substrate being important to drive endothelial cell migration and proliferation 6. HMSC cultures, expressed high COL 1 gene levels and, comparatively, in cHMSC, COL 1 gene was significantly over‐expressed at all culture time‐points. These results suggest that expression of COL 1 was highly stimulated in presence of HDMEC from early co‐culture periods. This agrees with previous studies performed in co‐cultures with different types of cells where the gene for type 1 collagen was up‐regulated only after 21 days co‐culture, the single time‐point analysed 6.
ALP gene expression is a frequently used marker for early osteogenic differentiation 36. In the present study, HMSC cultures expressed ALP throughout the culture time, and ALP activity had a similar profile. HDMEC and cHDMEC also express ALP, although at low levels. Comparatively, cHMSC presented higher levels of ALP expression and ALP activity, indicating enhanced osteogenic differentiation. Anti‐ALP staining of co‐cultures also showed increased intensity compared to HMSC monocultures. These observations are consistent with previous studies conducted with different cell types and cell culture media 34, 36.
RUNX2 is an earlier marker of osteogenic differentiation, and higher levels were found until day 14, followed by reduction, suggesting early commitment of HMSC to the osteoblast phenotype. This gene was significantly over‐expressed in cHMSC.
Bone morphogenetic proteins (BMPs) induce osteoblast differentiation 37. In the present work, HMSC monoculture presented high levels of BMP2 expression, especially in the first week. This is in accordance with a previous study conducted by Stiehler et al., which showed decreasing expression levels of BMP2 over culture time, under static conditions, for 21 days, using osteogenic medium 38. In cHMSC, BMP2 expression was greatly induced at days 7 and 14. BMP2 was also detected in HDMEC with time‐dependent patterns similar to those of HMSC, although with significantly lower levels. Expression of this gene was similar in cHDMEC. Also, Bouletreau et al. showed that BMPs can be expressed by bovine capillary endothelial cells and pointed out that BMP‐2 expression can be up‐regulated under hypoxia or exogenous VEGF conditions 39, playing an angiogenic role at a fracture site. Furthermore, Deckers et al. have demonstrated that BMP‐2 stimulates angiogenesis through production of VEGF by osteoblasts 40. Although just a few pieces of work in the literature studied expression of BMP‐2 by endothelial cells, results of the present work show significant BMP‐2 expression by both HMSC and HDMEC monocultures, and in co‐culture conditions.
Vascular endothelial growth factor (VEGF) is expressed by osteoblasts and is involved in regulation of endothelial differentiation, proliferation, migration, and formation of functional vessels 41. In the present work, VEGF‐165 was expressed by HMSC and over‐expressed in cHMSC, suggesting an important role for osteoblasts in reciprocal interactions of both cell types. A previous study has also shown that VEGF is expressed by cHMSC, although that culture was studied for just a few hours 42. VEGF expression was also detected in HDMEC and cHDMEC, although at much lower levels.
Several studies in literature have looked at the complex bidirectional communications between bone marrow stromal cells or mesenchymal stem cells and endothelial cells, to understand ways they interact and roles of endothelial cells promoting osteogenic differentiation 8, 26, 27, 28, 31. Greillier et al. 28 proposed three different types of major way of communication between these cells, such as direct cell‐to‐cell mechanisms (gap junction communications; adherens and tight junctions communications) and secretion of diffusible factors that activate specific receptors on the target cells. Gap junctions are composed of aggregations of membrane channels, called connexons, providing direct cytoplasmic connections between adjacent cells 43. Villar et al. 36 have shown that functional inhibition of gap junction channel Cx43, expressed by HUVEC and HBMSC, decreased the effect of endothelial cells on HBMSC differentiation (ALP and COL 1 expression). Also, Li et al. 44 have shown that co‐cultured HBMSC with HUVEC (human umbilical vein endothelial cells) expressed higher neural‐cadherin (N‐cahderin) compared to monocultured cells. Furthermore, neutralization of N‐cahderin led to down‐regulation of ALP and COL 1 gene expression. In normal conditions (without N‐cahderin neutralization), earlier osteoblast differentiation of HBMSC was achieved when co‐cultured with HUVEC. Taking into account these studies, it seems that direct contact co‐culture is important to promote HMSC or HBMSC cells' differentiation. Cell‐cell contacts can be promoted in 2D surface or in 3D in vitro models. 3D scaffolds with 12 and without dynamic conditions 45 and 3D spheroid co‐culture systems 17, 46 can be used. Regarding diffusible factors, several have been pointed out to be determinant of interactions between these cells, such as BMP‐2, FGF, PDGF, TGF‐β, VEGF and IGF 28. Saleh et al. 46 studied the effects of paracrine factors produced by HUVEC on MSC, using serum‐free endothelial cell‐conditioned medium (CM). The results reported that these soluble factors were able to enhance MSC osteogenic differentiation, as expression levels of genes such as for ALP, osteonectin and osteopontin were increased when MSC were cultured in CM culture medium. Such soluble factors could be secreted by cells or released from the extracellular matrix 47.
In the present study, cHMSC were able to over‐express marker genes related to osteoblastic differentiation such as ALP, COL 1 and RUNX2. Regarding further osteoblast markers, as the ability to form a mineralized extracellular matrix, the last event of osteoblast differentiation, alizarin red assay and SEM observation showed presence of calcium phosphate deposits, with clear induction in co‐culture conditions.
It is believed that BMP‐2 and VEGF interaction have a primordial role in HMSC osteoblast differentiation, observed in the present work. The medium used (as described above) had VEGF in its composition, which could induce HDMEC to express BMP2. A previous study of Bouletreau et al. 39 has also shown that VEGF can induce BMP2 mRNA and protein expression in HDMEC. Furthermore, other studies have shown that BMP2 is an important growth factor to induce osteoblast differentiation and mineralization 48, 49. Jorgensen et al. 50 supplemented MEM basal culture medium with BMP2 and showed that presence of BMP2 was able to induce osteogenic differentiation in mineralized matrix bone marrow stromal cells. Also, Kaigler et al. 51 have shown that HDMEC significantly increase BMSC osteogenic differentiation in vitro and express BMP2. When BMP2 RNA expression was inhibited in HDMEC, BMSC osteogenic differentiation decreased. Several studies have also shown enhanced bone formation when VEGF and BMP2 were released or expressed simultaneously in vivo 52.
von Willebrand factor (vWF) is a glycoprotein found in endothelial cells, platelets and plasma, and it is stored in Weible‐Palade bodies 53 large rod‐shaped organelles specific to endothelial cells 54. This is also an endothelial marker as it is synthesized exclusively by endothelial cells and magakaryocytes 53, 55. In this study, vWF was expressed by HDMEC at very high levels from the first time‐point studied, keeping its levels high for 21 days. Slight increase in expression of its encoding gene was observed for cHDMEC at days 7 and 14, indicating that endothelial phenotype was maintained in both conditions.
It is known that inter‐endothelial cell contacts control and regulate permeability of blood vessel walls and angiogenesis. Adherens junctions between endothelial cells are formed by cell adhesion molecules such as VE‐cadherin 56, 57. VE‐cadherin is a Ca2+‐dependent adhesion molecules and is also involved in vascular morphogenesis and endothelial survival, being up‐regulated during vascular cell proliferation, essential for angiogenesis 55. The present work has shown that HDMEC cultures expressed VE‐cadherin, with increased levels from days 7 to 21. Over‐expression of this adhesion molecule was observed in cHDMEC, with a significantly high increase on day 21.
Angiopoietins (Ang) also play a major role in the whole angiogenesis process. ANGPT1 is related to blood vessel remodelling, maturation and stabilization 58, and ANGPT2 may regulate cell–matrix interactions in growing vessels, to facilitate sprouting 59. HMSC expressed ANGPT1, achieving maximum level at day 14, and it is worth noting that the significant increase in expression of its encoding gene in cHMSC during all culture times. No expression was detected on HDMEC and cHDMEC, since ANGPT1 is expressed by osteoblasts, as reported in the literature 60, 61. Expression of ANGPT2 was detected in HDMEC and over‐expressed in cHDMEC. HMSC and cHMSC also express its gene in very low levels, also found in previous studies 59, 62, where ANGPT2 was essentially expressed by endothelial cells. No experiments were conducted to evaluate expression of proteins encoded by these two genes with sorted cells from co‐cultures. Considering the role of the genes in endothelial cells, expression of ANGPT1 by HMSC and ANGPT2 by HDMEC, and their over‐expression in co‐culture conditions, the results strongly suggest importance of the reciprocal interactions between these cell types.
Different assays are used to study the angiogenic process. The most used models involve a 3D supportive matrix such as Matrigel 16, 63, where endothelial cells are able to organize themselves in a network of tubular‐like blood vessels. Furthermore, Lozito et al. 16 have shown that extra‐cellular matrix components like laminin, collagen and fibronectin alone (without growth factors or presence of other cell types) were not able to induce vascular differentiation. The same happened when vascular endothelial cell growth factors were used alone. Here, endothelial cells were seeded on Matrigel to evaluate the capacity of HDMEC to form capillary‐like structures, which occurred after 3 days culture. It seems that endothelial cells require a 3D matrix of extracellular components to organize themselves into capillary‐like structures, as many soluble growth factors important for vascular differentiation bind to the extracellular matrix. In summary, it seems that presence of 3D matrix and angiogenic growth factors is required for capillary‐like structure formation 16. Furthermore, cell number was quantified by flow cytometry in both monocultures and co‐cultures. Results obtained show that endothelial cell number in co‐culture decreased over culture time, as previously described in literature 22, 34. Possibly, for these reasons, no microvessel‐like structures were observed in our co‐culture system, although expression of genes associated with angiogenesis was not affected.
Recent studies have revealed that bone vascular endothelial cells are members of a complex interactive communication network within the bone microenvironment, which involves also osteoblasts, osteoclasts, macrophages and stromal cells 64, during bone development and remodelling. The present results provide detailed information regarding time‐dependent gene expression associated with endothelial and osteoblast cells, and also, effects of the reciprocal interaction of these cell types in their gene expression profiles. Results show that genes typically associated with osteoblast differentiation (COL 1, RUNX2 and ALP) and with endothelial cells (for vWF and VE‐cadherin) were expressed in monocultures of HMSC and HDMEC, respectively. In addition, results observed in HMSC and HDMEC sorted from co‐culture (cHMSC and cHDMEC) confirm differentiation of HMSC in co‐culture conditions and also a complex reciprocal interaction with evident induction of both phenotypes.
In conclusion, the conditions applied allowed for continuous interactions between HDMEC and HMSC co‐cultured for a considerably long period. Co‐cultured cells were able to maintain their viability, morphology, metabolic activity and individual functionality for up to 21 days. Time‐detail study of reciprocal relationships regarding expression of genes associated with endothelial and osteoblast differentiation seems to indicate that increase in endothelial marker expression is enhanced by presence of HMSC. At the same time, HMSC differentiation is induced in co‐culture conditions. This co‐culture system might be useful for studying reciprocal regulation and functional interaction between these two cell types, and possibly, for being applied as a strategy for bone regeneration.
Acknowledgements
M.S. Laranjeira thanks FCT – Fundação para a Ciência e Tecnologia (Portugal) for her PhD grant (SFRH/BD/29056/2006). The support of ADI through the project NanoforBone (NORTE‐01‐0202‐FEDER‐005372) and the contribution of FMDUP are also acknowledged. This work was also financed by FEDER funds through the Programa Operacional Factores de Competitividade – COMPETE and by Portuguese funds through FCT – Fundação para a Ciência e a Tecnologia in the framework of the project PEst‐C/SAU/LA0002/2011.
References
- 1. Santos M, Reis R (2010) Vascularization in bone tissue engineering: physiology, current strategies, major hurdles and future challenges. Macromol. Biosci. 10, 12–20. [DOI] [PubMed] [Google Scholar]
- 2. Grellier M, Granja PL, Fricain J‐C, Bidarra SJ, Renard M, Bareille R et al (2009) The effect of the co‐immobilization of human osteoprogenitors and endothelial cells within alginate microspheres on mineralization in a bone defect. Biomaterials 30, 3271–3278. [DOI] [PubMed] [Google Scholar]
- 3. Unger RE, Sartoris A, Peters K, Motta A, Migliaresi C, Kunkel M et al (2007) Tissue‐like self‐assembly in cocultures of endothelial cells and osteoblasts and the formation of microcapillary‐like structures on three‐dimensional porous biomaterials. Biomaterials 28, 3965–3976. [DOI] [PubMed] [Google Scholar]
- 4. Santos MI, Pashkuleva I, Alves CM, Gomes ME, Fuchs S, Unger RE et al (2009) Surface‐modified 3D starch‐based scaffold for improved endothelialization for bone tissue engineering. J. Mater. Chem. 19, 4029–4280. [Google Scholar]
- 5. Fuchs S, Jiang X, Schmidt H, Dohle E, Ghanaati S, Orth C et al (2009) Dynamic processes involved in the pre‐vascularization of silk fibroin constructs for bone regeneration using outgrowth endothelial cells. Biomaterials 30, 1329–1338. [DOI] [PubMed] [Google Scholar]
- 6. Santos MI, Unger RE, Sousa RA, Reis RL, Kirkpatrick CJ (2009) Crosstalk between osteoblasts and endothelial cells co‐cultured on a polycaprolactone–starch scaffold and the in vitro development of vascularization. Biomaterials 30, 4407–4415. [DOI] [PubMed] [Google Scholar]
- 7. Unger RE, Ghanaati S, Orth C, Sartoris A, Barbeck M, Halstenberg S et al (2010) The rapid anastomosis between prevascularized networks on silk fibroin scaffolds generated in vitro with cocultures of human microvascular endothelial and osteoblast cells and the host vasculature. Biomaterials 31, 6959–6967. [DOI] [PubMed] [Google Scholar]
- 8. Stahl A, Wenger A, Weber H, Stark GB, Augustin HG, Finkenzeller G (2004) Bi‐directional cell contact‐dependent regulation of gene expression between endothelial cells and osteoblasts in a three‐dimensional spheroidal coculture model. Biochem. Biophys. Res. Commun. 322, 684–692. [DOI] [PubMed] [Google Scholar]
- 9. Yu H, VandeVord PJ, Mao L, Matthew HW, Wooley PH, Yang S‐Y (2009) Improved tissue‐engineered bone regeneration by endothelial cell mediated vascularization. Biomaterials 30, 508–517. [DOI] [PubMed] [Google Scholar]
- 10. Amaral IF, Unger RE, Fuchs S, Mendonça AM, Sousa SR, Barbosa MA et al (2009) Fibronectin‐mediated endothelialisation of chitosan porous matrices. Biomaterials 30, 5465–5475. [DOI] [PubMed] [Google Scholar]
- 11. Silva Marques JM, Gomes PS, Silva MA, Silvério Cabrita AM, Santos JD, Fernandes MH (2009) Growth and phenotypic expression of human endothelial cells cultured on a glass‐reinforced hydroxyapatite. J. Mater. Sci. Mater. Med. 20, 725–731. [DOI] [PubMed] [Google Scholar]
- 12. Hofmann A, Ritz U, Verrier S, Eglin D, Alini M, Fuchs S et al (2008) The effect of human osteoblasts on proliferation and neo‐vessel formation of human umbilical vein endothelial cells in a long‐term 3D co‐culture on polyurethane scaffolds. Biomaterials 29, 4217–4226. [DOI] [PubMed] [Google Scholar]
- 13. Dwight AT (2008) The Osteogenic–Angiogenic Interface: novel Insights into the Biology of Bone Formation and Fracture Repair. Bone Biol. Struct. 6, 67–71. [DOI] [PubMed] [Google Scholar]
- 14. Soker S, Machado M, Atala A (2000) Systems for therapeutic angiogenesis in tissue engineering. World J. Urol. 18, 10–18. [DOI] [PubMed] [Google Scholar]
- 15. Villars F, Bordenave L, Bareille R, Amédée J (2000) Effect of human endothelial cells on human bone marrow stromal cell phenotype: role of VEGF? J. Cell. Biochem. 79, 672–685. [DOI] [PubMed] [Google Scholar]
- 16. Lozito TP, Kuo CK, Taboas JM, Tuan RS (2009) Human mesenchymal stem cells express vascular cell phenotypes upon interaction with endothelial cell matrix. J. Cell. Biochem. 107, 714–722. [DOI] [PMC free article] [PubMed] [Google Scholar]
- 17. Saleh F, Whyte M, Genever P (2011) Effects of endothelial cells on human mesenchymal stem cell activity in a three‐dimensional in vitro model. Eur. Cells Mater. 22, 242–257. [DOI] [PubMed] [Google Scholar]
- 18. Bajada S, Mazakova I, Richardson JB, Ashammakhi N (2008) Updates on stem cells and their applications in regenerative medicine. J. Tissue Eng. Regen. Med. 2, 169–183. [DOI] [PubMed] [Google Scholar]
- 19. Kolf CM, Cho E, Tuan RS (2007) Biology of adult mesenchymal stem cells: regulation of niche, self‐renewal and differentiation. Arthritis Res. Ther. 9, 204. [DOI] [PMC free article] [PubMed] [Google Scholar]
- 20. Lang I, Pabst MA, Hiden U, Blaschitz A, Dohr G, Hahn T et al (2003) Heterogeneity of microvascular endothelial cells isolated from human term placenta and macrovascular umbilical vein endothelial cells. Eur. J. Cell Biol. 82, 163–173. [DOI] [PubMed] [Google Scholar]
- 21. Ciardelli G, Gentile P, Chiono V, Mattioli‐Belmonte M, Vozzi G, Barbani N et al (2010) Enzymatically crosslinked porous composite matrices for bone tissue regeneration. J. Biomed. Mater. Res. A 92A, 137–151. [DOI] [PubMed] [Google Scholar]
- 22. Zhang Y, Andrukhov O, Bernerd S, Matejka M, Wieland M, Rausch‐Fan X et al (2010) Osteogenic properties of hydrophilic and hydrophobic titanium surfaces evaluated with osteoblast‐like cells (MG63) in coculture with human umbilical vein endothelial cells(HUVEC). Dent. Mater. 400, 284–292. [DOI] [PubMed] [Google Scholar]
- 23. Fuchs S, Ghanaati S, Orth C, Barbeck M, Kolbe M, Hofmann A et al (2009) Contribution of outgrowth endothelial cells from human peripheral blood on in vivo vascularization of bone tissue engineered constructs based on starch polycaprolactone scaffolds. Biomaterials 30, 526–534. [DOI] [PubMed] [Google Scholar]
- 24. Deb S, Mandegaran R, Di Silvio L (2010) A porous scaffold for bone tissue engineering 45S5 bioglass derived porous scaffolds for co‐culturing osteoblasts and endothelial cells. J. Mater. Sci. Mater. Med. 21, 893–905. [DOI] [PubMed] [Google Scholar]
- 25. Aguirre A, Planell JA, Engel E (2010) Dynamics of bone marrow‐derived endothelial progenitor cell/mesenchymal stem cell interaction in co‐culture and its implications in angiogenesis. Biochem. Biophys. Res. Commun. 26, 1043–1051. [DOI] [PubMed] [Google Scholar]
- 26. Grellier M, Ferreira‐Tojais N, Bourget C, Bareillke R, Guillemot F, Amédée J (2009) Role of vascular endothelial growth factor in the communication between human osteoprogenitors and endothelial cells. J. Cell. Biochem. 106, 390–398. [DOI] [PubMed] [Google Scholar]
- 27. Guillotin B, Bareille R, Bourget C, Bordenave L, Amédée J (2008) Interaction between human umbilical vein endothelial cells and human osteoprogenitors triggers pleiotropic effect that may support osteoblastic function. Bone 42, 1080–1091. [DOI] [PubMed] [Google Scholar]
- 28. Grellier M, Bordenave L, Amédée J (2009) Cell‐to‐cell communication between osteogenic and endothelial lineages: implications for tissue engineering. Trends Biotechnol. 27, 562–571. [DOI] [PubMed] [Google Scholar]
- 29. Kirkpatrick CJ, Peters K, Hermanns MI, Bittinger F, Krump‐Konvalinkova V, Fuchs S et al (2005) In vitro methodologies to evaluate biocompatibility: status quo and perspective. ITBM‐RBM 26, 192–199. [Google Scholar]
- 30. Peters K, Unger RE, Stumpf S, Schäfer J, Tsaryk R, Hoffmann B et al (2008) Cell type‐specific aspects in biocompatibility testing: the intercellular contact in vitro as an indicator for endothelial cell compatibility. J. Mater. Sci. Mater. Med. 19, 1637–1644. [DOI] [PubMed] [Google Scholar]
- 31. Guillotin B, Bourget C, Remy‐Zolgadri M, Bareille R, Fernandez P, Conrad V et al (2004) Human primary endothelial cells stimulate human osteoprogenitor cell differentiation. Cell. Physiol. Biochem. 14, 325–332. [DOI] [PubMed] [Google Scholar]
- 32. Laranjeira MS, Fernandes MH, Monteiro FJ (2010) Innovative macroporous granules of nanostructured‐hydroxyapatite agglomerates: bioactivity and osteoblast‐like cell behaviour. J. Biomed. Mater. Res. A 95A, 891–900. [DOI] [PubMed] [Google Scholar]
- 33. Gomes PS, Fernandes MH (2007) Effect of therapeutic levels of doxycycline and minocycline in the proliferation and differentiation of human bone marrow osteoblastic cells. Arch. Oral Biol. 52, 251–259. [DOI] [PubMed] [Google Scholar]
- 34. Zhang Y, Schedle A, Matejka M, Rausch‐Fan X, Andrukhov O (2010) The proliferation and differentiation of osteoblasts in co‐culture with human umbilical vein endothelial cells: an improved analysis using fluorescence‐activated cell sorting. Cell. Mol. Biol. Lett. 15, 517–529. [DOI] [PMC free article] [PubMed] [Google Scholar]
- 35. Shi X, Ren L, Tian M, Yu J, Huang W, Du C et al (2010) In vivo and in vitro osteogenesis of stem cells induced by controlled release of drugs from microspherical scaffolds. J. Mater. Chem. 20, 9140–9148. [Google Scholar]
- 36. Villars F, Guillotion B, Amedee T, Dutoya S, Bordenave L, Bareille R et al (2002) Effect of HUVEC on human osteoprogenitor cell differentiation needs heterotypic gap junction communication. Am. J. Physiol. Cell Physiol. 282, C775–C785. [DOI] [PubMed] [Google Scholar]
- 37. Kanczler J, Oreffo R (2008) Osteogenesis and angiogenesis: the potential for engineering bone. Eur. Cell Mater. 15, 100–114. [DOI] [PubMed] [Google Scholar]
- 38. Stiehler M, Bunger C, Baatrup A, Lind M, Kassem M, Mygind T (2007) Effect of dynamic 3‐D culture on proliferation, distribution, and osteogenic differentiation of human mesenchymal stem cells. J. Biomed. Mater. Res. A 89A, 96–107. [DOI] [PubMed] [Google Scholar]
- 39. Bouletreau P, Warren S, Spector J, Peled Z, Gerrets R, Greenwald J, Longaker M (2002) Hypoxia and VEGF up‐regulate BMP‐2 mRNA and protein expression in microvascular endothelial cells: implications for fracture healing. Plast. Reconstr. Surg. 109, 2384–2397. [DOI] [PubMed] [Google Scholar]
- 40. Deckers M, van Bezooijen R, van der Horst G, Hoogendam J, van der Bent C, Papapoulos S, Löwik C (2002) Bone morphogenetic proteins stimulate angiogenesis through osteoblast‐derived vascular endothelial growth factor A. Endocrinology 143, 1545–1553. [DOI] [PubMed] [Google Scholar]
- 41. Whelan MC, Senger DR (2003) Collagen I initiates endothelial cell morphogenesis by inducing actin polymerization through suppression of cyclic AMP and protein kinase A. J. Biol. Chem. 278, 327. [DOI] [PubMed] [Google Scholar]
- 42. Li H, Daculsi R, Grellier M, Bareille R, Bourget C, Remy M, Amedee J (2011) The role of vascular actors in two dimensional dialogue of human bone marrow stromal cell and endothelial cell for inducing self‐assembled network. PLoS ONE 6, e16767. [DOI] [PMC free article] [PubMed] [Google Scholar]
- 43. Beyer EC, Paul DL, Goodenough DA (1990) Connexin family of gap junction proteins. J. Membr. Biol. 116, 187–194. [DOI] [PubMed] [Google Scholar]
- 44. Li H, Daculsi R, Grellier M, Bareille R, Bourget C, Amedee J (2010) Role of neural‐cadherin in early osteoblastic differentiation of human bone marrow stromal cells cocultured with human umbilical vein endothelial cells. Am. J. Physiol. Cell Physiol. 299, C422–C430. [DOI] [PubMed] [Google Scholar]
- 45. Kyriakidou K, Lucarini G, Zizzi A, Salvolini E, Mattioli Belmonte M, Mollica F, Gloria A, Ambrosio L (2008) Dynamic co‐seeding of osteoblast and endothelial cells on 3D polycaprolactone scaffolds for enhanced bone tissue engineering. J. Bioact. Compat. Polym. 23, 227. [Google Scholar]
- 46. Saleh FA, Whyte M, Ashton P, Genever PG (2010) Regulation of mesenchymal stem cell activity by endothelial cells. Stem Cells Dev. 20, 391–403. [DOI] [PubMed] [Google Scholar]
- 47. Lozito TP, Taboas JM, Kuo CK, Tuan RS (2009) Mesenchymal stem cell modification of endothelial matrix regulates their vascular differentiation. J. Cell. Biochem. 107, 706–713. [DOI] [PubMed] [Google Scholar]
- 48. Aubin JE, Heersche JNM (2000) Osteoprogenitor cell differentiation to mature bone‐forming osteoblasts. Drug Dev. Res. 49, 206–215. [Google Scholar]
- 49. Hoemann CD, El‐Gabalawy H, McKee MD (2009) In vitro osteogenesis assays: influence of the primary cell source on alkaline phosphatase activity and mineralization. Pathol. Biol. (Paris) 57, 318–323. [DOI] [PubMed] [Google Scholar]
- 50. Jørgensen NR, Henriksen Z, Sørensen OH, Civitelli R (2004) Dexamethasone, BMP‐2, and 1,25‐dihydroxyvitamin D enhance a more differentiated osteoblast phenotype: validation of an in vitro model for human bone marrow‐derived primary osteoblasts. Steroids 69, 219–226. [DOI] [PubMed] [Google Scholar]
- 51. Kaigler D, Krebsbach PH, West ER, Horger K, Huang YC, Mooney DJ (2005) Endothelial cell modulation of bone marrow stromal cell osteogenic potential. FASEB J. 19, 665–667. [DOI] [PubMed] [Google Scholar]
- 52. Kempen DHR, Lu L, Heijink A, Hefferan TE, Creemers LB, Maran A, Yaszemski MJ, Dhert WJA (2009) Effect of local sequential VEGF and BMP‐2 delivery on ectopic and orthotopic bone regeneration. Biomaterials 30, 2816–2825. [DOI] [PubMed] [Google Scholar]
- 53. Müller AM, Hermanns MI, Skrzynski C, Nesslinger M, Müller K‐M, Kirkpatrick CJ (2002) Expression of the endothelial markers PECAM‐1, vWf, and CD34 in vivo and in vitro. Exp. Mol. Pathol. 72, 221–229. [DOI] [PubMed] [Google Scholar]
- 54. Bouïs D, Hospers G, Meijer C, Molema G, Mulder N (2001) Endothelium in vitro: a review of human vascular endothelial cell lines for blood vessel‐related research. Angiogenesis 4, 91–102. [DOI] [PubMed] [Google Scholar]
- 55. Martin TA, Watkins G, Lane J, Jiang WG (2005) Assessing microvessels and angiogenesis in human breast cancer, using VE‐cadherin. Histopathology 46, 422–430. [DOI] [PubMed] [Google Scholar]
- 56. Augustin HG, Kozian DH, Johnson RC (1994) Differentiation of endothelial cells: analysis of the constitutive and activated endothelial cell phenotypes. Bioessays 16, 901–906. [DOI] [PubMed] [Google Scholar]
- 57. Vestweber D (2000) Molecular mechanisms that control endothelial cell contacts. J. Pathol. 190, 281–291. [DOI] [PubMed] [Google Scholar]
- 58. Talavera‐Adame D, Ng TT, Gupta A, Kurtovic S, Wu GD, Dafoe DC (2011) Characterization of microvascular endothelial cells isolated from the dermis of adult mouse tails. Microvasc. Res. 82, 97–104. [DOI] [PubMed] [Google Scholar]
- 59. Saharinen P, Alitalo K (2011) The yin, the yang, and the Angiopoietin‐1. J. Clin. Investig. 121, 2157–2159. [DOI] [PMC free article] [PubMed] [Google Scholar]
- 60. Bogdanovic E (2010) Regulation of Tie‐2 by Angiopoietin‐1 and Angiopoietin‐2 in Endothelial Cells. Toronto: University of Toronto. [Google Scholar]
- 61. Suzuki T, Miyamoto T, Fujita N, Ninomiya K, Iwasaki R, Toyama Y, Suda T (2007) Osteoblast‐specific Angiopoietin 1 overexpression increases bone mass. Biochem. Biophys. Res. Commun. 362, 1019–1025. [DOI] [PubMed] [Google Scholar]
- 62. Yuan HT, Khankin EV, Karumanchi SA, Parikh SM (2009) Angiopoietin 2 is a partial agonist/antagonist of Tie2 signaling in the endothelium. Mol. Cell. Biol. 29, 2011. [DOI] [PMC free article] [PubMed] [Google Scholar]
- 63. Shilo S, Roy S, Khanna S, Sen CK (2008) Evidence for the involvement of miRNA in redox regulated angiogenic response of human microvascular endothelial cells. Arterioscler. Thromb. Vasc. Biol. 28, 471–477. [DOI] [PubMed] [Google Scholar]
- 64. Collin‐Osdoby P (1994) Role of vascular endothelial cells in bone biology. J. Cell. Biochem. 55, 304–309. [DOI] [PubMed] [Google Scholar]