

Abstract
Objective: The maintenance of pluripotency of human embryonic stem cells (hESCs) requires a high efficiency of self‐renewal. During in vitro propagation, however, hESCs have a propensity to differentiate spontaneously. In this study, we assessed the nature of hESC responses to hypoxic conditions.
Materials and methods: Human embryonic stem cells were grown in normoxic and hypoxic conditions, and the cells expressing Oct4 and stage‐specific embryonic antigen‐1 were identified by indirect immunofluorescence. The transcriptional expression of Nanog, Notch1, and Oct4 was determined by a real‐time reverse transcription–polymerase chain reaction, and the inhibition of Notch‐mediated signalling was achieved with a γ‐secretase inhibitor.
Results: In contrast to culture at 21% oxygen, where the colonies displayed a marked degree of differentiation, we found that during exposure to 5% oxygen, the hESC colonies displayed a homogenous and flat morphology that was consistent with the presence of Oct4‐positive phenotype, indicating no spontaneous differentiation. When cultured at 5% oxygen for either 4 weeks or up to 18 months, high levels of Nanog and Notch1 transcriptional expression were detected, albeit the expression was significantly lower during longer exposure. The suppression of differentiation was rapidly reversed on transfer of the hypoxic cultures to normoxic conditions. Looking into the molecular mechanisms of the maintenance of self‐renewal at low oxygen tensions, we found that inhibition of Notch signalling fully abrogated the hypoxic induction of undifferentiated phenotype.
Conclusion: Our data, thus, indicate that hypoxic exposure has the capacity to sustain long‐term self‐renewal of hESCs and that this effect is mediated through activation of Notch.
Introduction
In order to harness the potential of human stem cells for clinical applications, a thorough understanding of the processes governing their differentiation is essential. Regarding the use of somatic stem cells, haematopoietic stem cells have been used clinically for decades, and several clinical trials using mesenchymal stem cells (MSCs) for a variety of applications are ongoing (1). However, the scarcity of stem cells of endodermal and ectodermal origin makes regeneration of, that is, neural, hepatic, or endocrine tissues with somatic stem cells almost impossible. From this standpoint, human embryonic stem cells (hESCs) appear especially appealing. They possess a universal differentiation capacity, pluripotency, that makes them a unique source for all cells in the adult organism (2).
To grow hESCs in vitro for basic studies, clinical trials, and also industrial applications, it is desirable that a homogenous population is available. hESCs have basically indefinite proliferative capacity; however, this significant feature cannot be fully exploited since during in vitro passaging the cells often will spontaneously segregate into a differentiated phenotype, at least when growing the cells in conditions completely without animal‐derived products (3). A great effort has been invested into optimizing and standardizing the growth conditions so that spontaneous differentiation of hESC is prevented. At present, the growth conditions may, nevertheless, differ grossly regarding the use of support media and feeder cells (4, 5), growth media and growth factors (6, 7), and a passaging procedure that may reside on manual microdissection or trypsinization (8). It is also important to keep in mind that individual lines of hESCs differ to a certain degree and they may respond differently to specific growth environments (9).
The mechanisms specifically involved in the control of spontaneous hESC differentiation have not been identified as of yet, although a great deal of information is available regarding the associated differentiation events. Several principal signalling cascades have been described that lead to endodermal, mesodermal, and ectodermal differentiation of ESCs. Most notably, activation of bone morphogenetic, Wnt, Hedgehog, and Notch superfamilies has been shown to be central to these processes (10, 11, 12, 13, 14, 15). Currently, there are numerous experimental protocols that attempt to guide differentiation along specific pathways towards highly specialized, mature phenotypes by using a wide variety of inducing substances. In addition to biochemical mediators, oxygen has recently been demonstrated to be a factor that can modulate the progression of differentiation in murine ESCs (16), hESCs (17), as well as MSCs (18). In our own laboratory, we have previously studied the effect of hypoxia on adipogenic, chondrogenic, and osteogenic differentiation of MSCs, and found that several processes were promoted by varying levels of oxygen (19, 20, 21).
Recently, it was reported that exposure to low oxygen partial tension can support the maintenance of the undifferentiated hESC phenotype for up to 2 weeks (22). However, it still remains to be explained, how long‐term culturing in hypoxia affects hESCs. In this context, it appears relevant that in a model system based on myoblastic precursor cells and neuronal stem cells, a mechanistic basis for the prevention of terminal differentiation by hypoxia has been proposed (23).
In the current study, we report for the first time, a comparative analysis of short‐ and long‐term adaptation of hESCs to continuous hypoxia, and provide evidence that for maintenance of self‐renewal in these conditions, the Notch signalling is necessary.
Materials and methods
Cell cultures
The human embryonic stem cell lines CLS1 and CLS2 were propagated by microdissection on a monolayer of γ‐irradiated human foreskin fibroblasts (HFF‐1; American Type Culture Collection no. SCRC‐1041; http://www.lgcpromochem‐atcc.com/) in Knockout Dulbecco's modified Eagle's medium (Invitrogen, Carlsbad, CA, USA; http://www.invitrogen.com), supplemented with 20% Knockout Serum Replacement (Invitrogen), 2 mm l‐glutamine, 0.1 mmβ‐mercaptoethanol, 1% non‐essential amino acids, 4 ng/mL recombinant human basic fibroblast growth factor (Biosource Europe, Nivelles, Belgium; http://www.biosource‐diagnostics.com), and antibiotics, as described previously (24). The colonies were sub‐cultured in 4‐week intervals, and the medium was changed every other day. The standard conditions that were also referred to as normoxic corresponded to 20% oxygen in the culture atmosphere supplemented with 5% carbon dioxide. For hypoxic cultures, the air was balanced with nitrogen to achieve 1%, 5%, 10%, and 15% oxygen concentrations. The incubations were done simultaneously in individually controlled chambers of the hypoxic cell culture facility (Xvivo System; BioSpherix, Redfield, NY, USA; http://www.biospherix.com). Using this facility, it was possible to monitor the cells as well as perform all handling steps at a constant level of hypoxia without sudden episodes of re‐oxygenation. Two additional cell lines, CSL1‐LT and CLS2‐LT, that have previously been maintained in such an uninterrupted manner at 5% oxygen for more than 18 months were also included. In experiments where inhibition of Notch activation was assayed, γ‐secretase inhibitor (L‐685 458; Sigma‐Aldrich, Brøndby, Denmark; http://www.sigmaaldrich.com) was used in 1 µm concentration throughout the whole duration of the experiment. The dark‐field recordings were done with a SteREO Lumar.V12 stereo microscope (Carl Zeiss, Göttingen, Germany; http://www.zeiss.de) featuring a wide‐range zoom capability (magnification ×6.4 to ×150) that was fitted with an AxioCam MRm camera (Zeiss). The cells were prior to experiments confirmed devoid of chromosomal aberrations by karyotype analysis and free of mycoplasma contamination.
Indirect immunofluorescence
The expression of Oct4 and stage‐specific embryonic antigen‐1 (SSEA1) was analysed by a two‐colour indirect immunofluorescence assay (IFA). Before fixation with 4% buffered formaldehyde, the nuclei were stained with Hoechst 33342 (Molecular Probes, Carlsbad, CA, USA; http://www.invitrogen.com) at a concentration of 10 µg/mL for 30 min. For staining with SSEA1, the Hoechst 33342 staining was followed by an incubation with a blocking solution of 2% bovine serum albumin (BSA) for 10 min, and SSEA1‐specific mouse monoclonal IgM (sc‐21702, Santa Cruz Biotechnology, Santa Cruz, CA, USA; http://www.scbt.com) in 200‐fold dilution for 1 h coupled with a Cy‐5‐labelled secondary antibody (AP130S Millipore, Copenhagen, Denmark; http://www.millipore.com) in 200‐fold dilution for 30 min. To detect Oct4, the cells were first permeabilized by incubating with 0.2% Triton X‐100 diluted in 4% BSA, for 1 h at 37 °C, and then sequentially incubated with Oct4‐specific antibody (ab19857; Abcam, Cambridge, UK; http://www.abcam.com) in 200‐fold dilution and FITC‐labelled secondary antibody (ab6717, Abcam) diluted 1 : 300. The incubation times followed those already optimized for SSEA1. Finally, the cells were washed and stored in phosphate‐buffered saline (PBS) at 4 °C until the time of analysis.
Three‐channel full resolution tiled images, based on 2.5‐ or 10‐fold magnification with a variable number of frames, were taken by Axio Observer.Z1 epi‐fluorescence system (Zeiss) with an AxioCam MRm camera. The quantitative image analysis to determine areas associated with specific markers was done using the AxioVision software (Zeiss). For presentation, the images were digitally processed in Photoshop (Adobe Systems, San Jose, CA, USA; http://www.adobe.com), and also AxioVision software packages.
[3H]‐Thymidine incorporation
Thymidine [methyl‐3H] triphosphate ammonium (TRK 242; Amersham Biosciences, Piscataway, NJ, USA; http://www.amersham.com) was added to the hESC cultures to achieve final activity 825 µCi/mL and further incubated for 4 h. After a thorough washing, the colonies of hESCs were dissected free from the feeder layer and incubated with 0.5% sodium dodecyl sulfate for 30 min at 37 °C. Following this incubation, the genomic DNA was precipitated with an equal volume of 10% w/v trichloroacetic acid during 10 min at room temperature. The precipitates were further washed with trichloroacetic acid, and finally the DNA samples were denatured with 100 µL of 0.1 N sodium hydroxide. The samples were directly mixed with 4 mL of scintillation cocktail (Ultima Gold; PerkinElmer, Waltham, MA, USA; http://www.perkinelmer.com) and measured in a scintillation counter (RackBeta; PerkinElmer).
Bromodeoxyuridine incorporation
The cultures of hESCs were incubated with 10 µm bromodeoxyuridine (BrdU; Sigma‐Aldrich) for 1 h at 37 °C, after which they were fixed with 4% buffered formaldehyde for 20 min at room temperature. The cells were then washed with PBS and the proteins were denatured with 2 N hydrochloric acid for 30 min. Before immunostaining, a blocking with 2% BSA was carried out for 30 min to minimize unspecific antibody binding, and the cell membranes were permeabilized with 0.2% Triton X‐100 in 4% BSA for 20 min. The anti‐BrdU mouse monoclonal antibody (A‐21300, Invitrogen) in 20‐fold dilution was incubated with the cells for 1 h at room temperature. This step was followed by a 35‐min incubation with Alexa 488‐conjugated secondary antibody (A‐11001, Invitrogen) diluted 1 : 200. The nuclei were counterstained with Hoechst 33342, as described above, and after the final wash, the dishes were stored in PBS at 4 °C.
Two‐channel full resolution tiled images based on 10‐fold magnification, with variable number of frames were taken by Axio Observer.Z1 wide‐field fluorescence system equipped with AxioCam MRm camera. The AxioVision software was used to manually determine colony total area, and the segmentation algorithm was used to determine the size of proliferating areas. For presentation, the images were digitally processed in AxioVision and Photoshop software packages.
Real‐time RT‐PCR
Total RNA was isolated from hESCs with the aid of the Aurum Total RNA Mini Kit (Bio‐Rad Laboratories, Hercules, CA, USA; http://www.bio‐rad.com) according to manufacturers’ recommendations and the yield was assessed spectrophotometrically (ND‐1000; NanoDrop Technologies, Wilmington, DE, USA; http://www.nanodrop.com). The synthesis of first‐strand cDNA was initiated on equalized RNA input using an iScript cDNA synthesis kit (Bio‐Rad Laboratories). For amplification reaction, an 8‐µL cDNA aliquot was applied together with 13 µL of iQ SYBR Green Supermix (Bio‐Rad Laboratories) reaction components, and 0.03 pmol of 18S primers or 0.192 pmol of gene‐specific primers in a total volume of 25 µL in translucent microtitre plates (iCycler iQ PCR plates, Bio‐Rad Laboratories). The samples were run on MyIQ single‐colour real‐time PCR detection system (Bio‐Rad Laboratories) using a two‐step amplification cycle. The profile consisted of a single annealing/extension step of 30 s at 60 °C and a denaturation step of 15 s at 95 °C, for a total number of 40 cycles. Prior to the gene‐specific analysis, the samples were evaluated for the contents of 18S rRNA that served as an internal endogenous standard. After normalization with respect to the 18S rRNA, the relative transcriptional levels were determined for each sample and gene in a semiquantitative fashion by referring to a standard dilution series prepared from a pooled sample using MyIQ software (Bio‐Rad Laboratories). To confirm the quality of each run, the occurrence of primer dimers was monitored by invoking a melting curve function of the programme. All samples were analysed in duplicates, with individual replicates being placed remotely from each other.
The following primer pairs were used (official gene symbol is given in square brackets): Oct4 [POU5F1]: upstream 5′‐CTGGTTCGCTTTCTCTTTCG‐3′ and downstream 5′‐GGGGGTTCTATTTGGCAAGG‐3′; Nanog [NANOG]: upstream 5′‐AGGAAGAGTAGAGGCTGGGGTAGGTAGGTG‐3′ and downstream 5′‐CAACTGGCCGAAGAATAGCAATGGTGT‐3′; Notch1 [NOTCH1]: upstream 5′‐TGGAGACGGGCAACAGCGAGGAA‐3′ and downstream 5′‐GCCCGTGCGGTCTGTCTGCTTGTG‐3′; and 18S ribosomal RNA: upstream 5′‐AGGACCGCGGTTCTATTTTGTTGG‐3′ and downstream 5′‐CCCCCGGCCGTCCCTCTTA‐3′. The primers were designed using Lasergene (DNASTAR, Madison, WI, USA; http://www.dnastar.com) software package and were custom synthesized by DNA Technology A/S (Aarhus, Denmark; http://www.dna‐technology.dk).
Statistics
The data are presented as a mean and standard error of mean. Pairwise testing for the difference between sample means was done with two‐tailed t‐test. The general linear model univariate procedure was used to analyse more than two independent samples that were further sub‐grouped by an additional variable factor. To obtain information regarding the differences among specific group means, a battery of post hoc tests was employed to perform multiple pairwise comparisons. The statistical significance was assigned to the 0.05 level. All routines were part of SPSS 14.0 software package (SPSS Inc., Chicago, IL, USA; http://www.spss.com).
Results
Short‐ and long‐term hypoxic treatment promotes an undifferentiated morphology of hESC colonies that is reversible on re‐oxygenation
In order to assess the effect of different levels of hypoxia on the morphology of hESCs, the cells were subjected to various levels of oxygen. During the short‐term hypoxic exposure that lasted for a period of 4 weeks, the growth progression in each of the five gaseous conditions, including 20%, 15%, 10%, 5%, and 1% oxygen, was determined by following the development of colonies over the whole period (Fig. 1a, left panel). Representative data using the CLS1 line are presented. In order to provide detailed morphology, a variable zoom was used. The magnification spanned a range from ×142 at the first week to ×22 at the last week of the culture. In atmospheres containing 10%, 15%, or 20% oxygen, pericentral thick zones, which appear in the dark field as light‐breaking white areas, are present. They indicate spontaneous differentiation, and are obvious already during the second week of culturing. In 5% oxygen, the colonies are homogenous and thinner, and without a pericentral thickening. A thin monolayer of feeders is visible too in the background. In 1% oxygen concentration, the initial colony seeds in most cases did not survive beyond 2 weeks. However, when they survived the full culture period, they appeared homogenous as well. The size of the colonies at the end of culture interval decreased significantly at and below 5% oxygen concentration. The colonies at 1% oxygen remained strikingly small.
Figure 1.
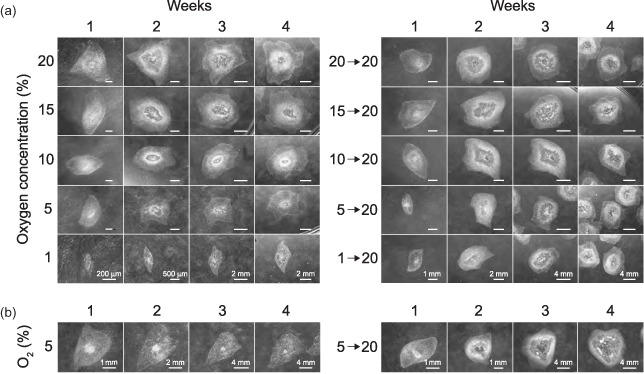
The effect of short‐ and long‐term hypoxic exposure and re‐oxygenation on the morphology of hESC colonies. (a) The CLS1 line was sub‐cultured by mechanical dissection and grown for a period of 4 weeks in five different concentrations of atmospheric oxygen, covering the range from 1% to 20%. After the initial treatment, colonies from all conditions were grown at oxygen concentration of ambient air for additional 4 weeks. (b) The CLS1‐LT line has been continuously maintained in hypoxic conditions corresponding to 5% oxygen for over 18 months. The development of colony morphology between regular passaging intervals is shown over the course of 4 weeks. The response to re‐oxygenation corresponding to the oxygen concentration of ambient air was followed during the course of additional 4 weeks. For each gaseous condition, the development of a representative colony is shown. The images were taken with a maximum zoom, given the size of a particular colony, and stereo microscope illumination settings were adjusted to a dark field observation. Image scalings at the bottom line images apply to all images within the specific week. hESC, human embryonic stem cell.
The reversibility of the hypoxic effect was tested on transferring the cultures back to the normoxic conditions after an initial 4‐week culture in hypoxia. Similarly as above, the response to re‐oxygenation was captured under a variable zoom encompassing magnification from ×10 to ×36 (Fig. 1a, right panel). The undifferentiated colony seeds originating from all hypoxic conditions started to attain the differentiated zones already after the first week. At the end of the 4‐week re‐oxygenation interval, the colonies reached a size comparable with cultures from control ambient air conditions. Similar results, both during hypoxia and re‐oxygenation, were obtained with CLS2 cell line (data not shown).
Regarding the long‐term hypoxic exposure, colonies that have previously been maintained at 5% over a period of 18 months (CLS1‐LT), displayed structural development over the period of 4 weeks that was similar to that of colonies exposed to 5% oxygen for the first time (Fig. 1b, left panel).
During re‐oxygenation (Fig. 1b, right panel), the colonies accelerated their growth and began to assume a mixed differentiated and undifferentiated phenotype already from the second week, in a fashion typical for standard passaging at ambient air oxygen concentration. At the end of the culture interval, the colonies attained a size comparable with the cells recuperating from short‐term hypoxic culture. CLS2‐LT cell line displayed the same pattern of hypoxic and re‐oxygenation responses (data not shown).
Hypoxic exposure restricts the spontaneous differentiation and size of human embryonic stem colonies in a manner dependent on the severity of the oxygen limitation
The rate of spontaneous differentiation was inferred from the extent of undifferentiated, Oct4‐positive areas (25), which were revealed by IFA and quantitatively assessed using image analysis. The differentiated, SSEA1‐1 (26), colony areas were also visualized and presented simultaneously as a complement to the undifferentiated zones. Representative images obtained from the CLS1 cell line during short‐term hypoxic exposure are shown in Fig. 2a. The analysis demonstrated that during the 4‐week culture period the proportion of undifferentiated area relative to the total colony dropped progressively from around 100% to approximately 60% when cells were cultured at 10% and 15% oxygen concentration. This decline was comparable to that of the control cultures at ambient oxygen concentration. At lower oxygen concentrations, represented by 5% and 1%, the spontaneous differentiation was inhibited at a statistically significant level. It is interesting to note that at 5% oxygen, some level of differentiation persisted until the third week, but nearly completely subsided 1 week later. In the highest level of hypoxia (1% oxygen), although the colonies displayed an entirely undifferentiated phenotype, the lack of oxygen appeared to be a serious impediment to the proliferation.
Figure 2.
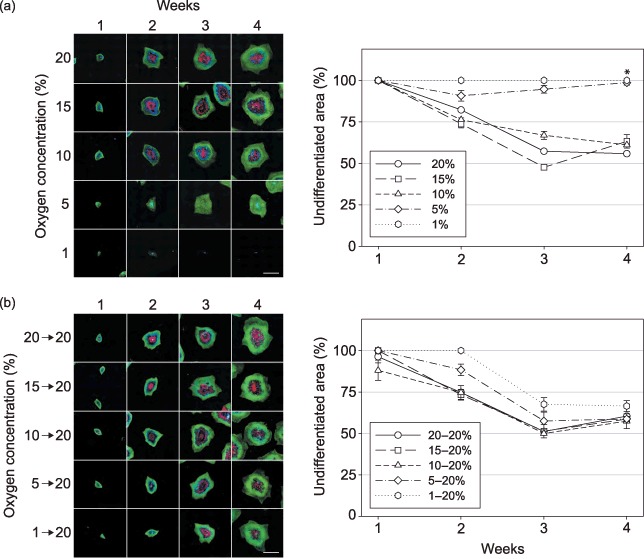
The effect of short‐term hypoxic treatment and re‐oxygenation on the frequency of spontaneous differentiation of hESCs. (a) The CLS1 line was sub‐cultured by microdissection and grown for a period of 4 weeks at four different levels of hypoxia, covering the range from 1% to 15% of oxygen in the atmosphere. The undifferentiated zones were revealed through the expression of Oct4 (green), the areas of differentiation by detection of SSEA1 (red), and nuclei were counterstained with Hoechst 33342 (blue). The progress of spontaneous differentiation was determined by comparing the extent of Oct4‐positive areas to the total surface of respective colonies. (b) After having been grown for a period of 4 weeks in hypoxic conditions, the CLS1 line was passaged and transferred to oxygen concentration of ambient air. The analysis of spontaneous differentiation was done as with hypoxic cultures (a). The images are mosaics of 20 single fields at 2.5‐fold magnification, and the scale bars correspond to 4 mm. Each point on the graphs represents an average of two independent experiments, where error bars denote standard error of mean. Asterisk indicates a significant difference (P < 0.05) between hypoxic culture at 5% and control normoxic culture 20% oxygen. SSEA, stage‐specific embryonic antigen; hESC, human embryonic stem cell.
Re‐oxygenation of the hypoxic cultures (Fig. 2b) resulted in the transition of the original uniformly undifferentiated phenotype into a mixed one. This occurred rather rapidly after the first week, with only the colonies that were transferred from the lowest hypoxia (1% oxygen) showing a slight delay. Nevertheless, at the end of the culture interval, a reversal to approximately 60% proportion for the undifferentiated zone occurred at all re‐oxygenation scenarios. CLS2 line underwent the same pattern of hypoxic and re‐oxygenation responses (data not shown).
The CLS1‐LT line had been maintained at 5% oxygen continuously for over 18 months. The representative colony development during the culture interval is presented in Fig. 3a. Intriguingly, the micrographs show minute central areas of differentiation that appear to be, at least in part, associated with transformed residues from the original seed. The small central differentiated area persisted throughout the culture period; however, towards the end it became so small relatively to the size of the colony that in numerical expression it equalled less that 0.5% of the total surface area. For the colonies that were exposed to re‐oxygenation, the differentiation was elicited as promptly as in the cells recovering from short‐term hypoxia of 5% oxygen.
Figure 3.
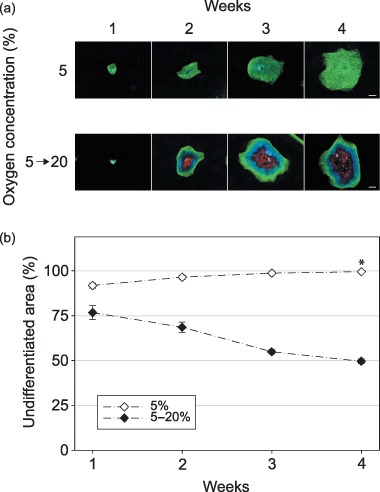
The effect of long‐term hypoxic treatment and re‐oxygenation on the frequency of spontaneous differentiation within the colonies of hESCs. Prior to this experiment, the CLS1‐LT line was maintained in hypoxia of 5% oxygen for over 18 months. (a) After sub‐culturing by mechanical microdissection, and further growth in identical hypoxic conditions or replacing into normoxic conditions corresponding to ambient air, the undifferentiated zones were revealed through the expression of Oct4 (green), the areas of differentiation by detection of SSEA1 (red), and nuclei were counterstained with Hoechst 33342 (blue). The images are mosaics of 144 single fields at 10‐fold magnification, and the scale bars correspond to 1 mm. (b) The progress of spontaneous differentiation was determined from the ratio of Oct4‐positive areas to the total surface of respective colonies. The plots are based on averages from two independent experiments and error bars denote standard error of mean. Asterisk indicates a significant difference (P < 0.05). SSEA, stage‐specific embryonic antigen; hESC, human embryonic stem cell.
Quantitative analysis in Fig. 3b further confirmed that the patterns of responses during long‐term hypoxic culturing and re‐oxygenation were practically identical to those observed in short‐term hypoxic experiments. Furthermore, these results were also confirmed using CLS2‐LT cell line (data not shown).
Short‐ and long‐term incubation at 5% oxygen concentration influences the transcription and translation of differentiation markers
Immunodetection of the pluripotency‐associated transcription factor Oct4 and the differentiation‐specific marker SSEA1 revealed intriguing information about the effect of hypoxia on the structure of hESC colonies (Fig. 4). From representative images obtained with the CLS1 line, it appears that in standard oxygen concentration (20%) only the circumferential zone remains undifferentiated, whereas the pericentral area harbours SSEA1‐positive cells. In the intermediate zone between these two areas, the undifferentiated cells penetrate into the central differentiated zone in the form of discrete foci. Interestingly, accumulations of cells negative for either marker are apparent in this zone as well (indicated by arrowheads).
Figure 4.
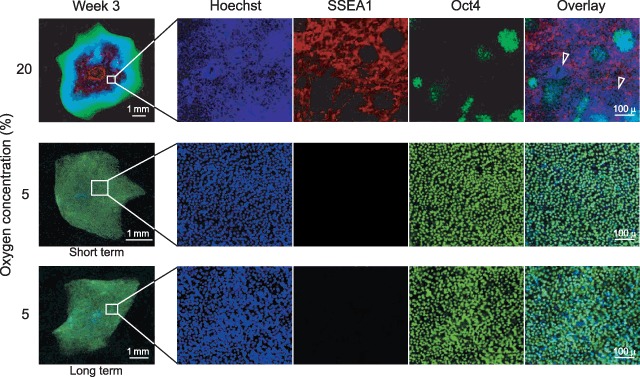
Structure of hESC colonies maintained at ambient air oxygen concentration or exposed to moderate hypoxia during short‐ or long‐term culture. CLS1 line was routinely grown in the presence of 20% oxygen, and for short‐term hypoxic exposure it was cultured in 5% of oxygen atmosphere for 3 weeks. CLS1‐LT cell line, that has previously been maintained in long‐term (>18 months) hypoxic conditions corresponding to 5% oxygen, has also been sub‐cultured in 5% oxygen for 3 weeks. The nuclei are rendered in blue (Hoechst 33342), undifferentiated areas in green (Oct4+), and differentiated areas in red (SSEA1+). Arrowheads indicate accumulations of cells negative for both Oct4 and SSEA1. The overview images are mosaics, entailing from 30 to up to 120 single fields, at 10‐fold magnification. SSEA, stage‐specific embryonic antigen; hESC, human embryonic stem cell.
In contrast to normoxic conditions, in an atmosphere of 5% oxygen, the colonies assume a thin and homogenous appearance, consisting nearly exclusively of undifferentiated phenotype. Sparse cells negative for both Oct4 and SSEA1 can also be found scattered throughout the colony. Comparison of short‐ and long‐term hypoxic exposures indicates that the hypoxic adaptation is accomplished during the course of the first 4 weeks, after which time, the morphological features of the colonies become perpetuated during sub‐culturing cycles.
To establish the expression of selected differentiation‐related genes at the transcriptional level in the differentiated and undifferentiated zones of colonies, a semiquantitative real‐time RT‐PCR analysis was performed (Fig. 5). The samples from discrete areas of the hESC colonies were dissected from the feeder layer under visual control using a stereo microscope and pooled. The same source cDNA was used to detect Oct4‐, Nanog‐, and Notch1‐specific messages. The profile of Oct4 mRNA kinetics indicates only minor difference between undifferentiated areas from normoxic and short‐term hypoxic conditions; however, the differentiated zones of normoxic cultures contained a 4‐fold lower level of Oct4 message. This pattern is well in concordance with the in situ distribution of Oct4 transcription factor, as was shown previously by IFA in 2, 4. The expression of Nanog followed a similar pattern; however, Nanog appeared to be present in a higher amount in the colonies grown at 5%.
Figure 5.
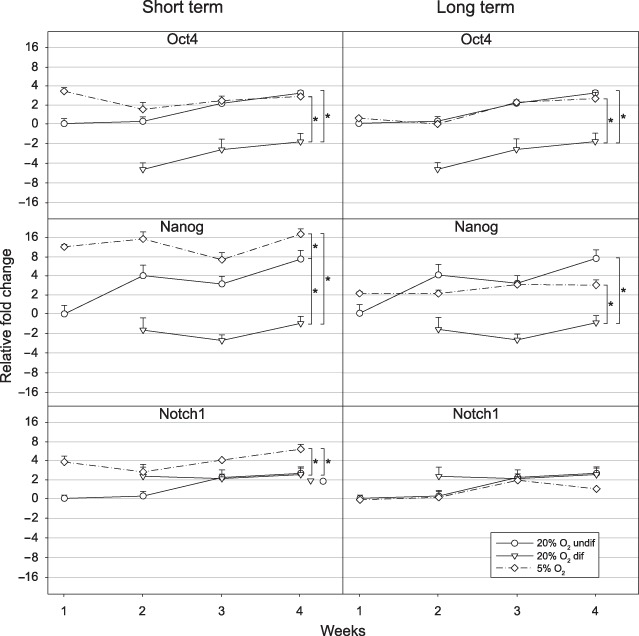
Kinetics of expression of Oct4‐, Nanog‐, and Notch1‐specific messages in hESCs during short‐ and long‐term hypoxic exposure by real‐time RT‐PCR. The CLS1 and CLS2 hESCs lines were grown in the normoxic conditions of ambient air or in short‐term hypoxia of 5% oxygen concentration. CLS1‐LT and CLS2‐LT cell lines, that have previously been maintained in long‐term (>18 months) hypoxic conditions corresponding to 5% oxygen, have also been sub‐cultured in 5% oxygen for 4 weeks. For the analysis in normoxic conditions, the differentiated and undifferentiated parts of the colonies were separated from feeder layer. In hypoxic conditions, whole, feeder‐free, colonies were analysed. The expression levels were normalized to the undifferentiated cells from control cultures at the first week. The error bars denote standard error of mean and they are shown only in positive direction. Asterisks indicate a significant difference (P < 0.05). undif, undifferentiated; dif, differentiated; hESC, human embryonic stem cell.
Similar analysis done on the lines propagated in hypoxic conditions in the long term (CLS1‐LT and CLS2‐LT) revealed that the undifferentiated areas were distinguished from differentiated ones by high levels of Oct4‐ and Nanog‐ but not Notch1‐specific mRNAs. Interestingly, the cell lines adapted to long‐term hypoxic culture at 5% oxygen were consistently expressing lower levels of Nanog and Notch1 messages than their counterparts exposed to a short‐term hypoxia.
Short‐ and long‐term incubation at 5% oxygen concentration restricts growth rate and promotes homogeneity of cell proliferation across whole colonies of hESCs
The proliferative capacity of the CLS1 and 2 cells, as determined by incorporation of [3H]‐thymidine, showed that in normoxic conditions the cells proliferated in a linear fashion over the 4‐week sub‐culture period at a rate that was significantly higher than that of the lines maintained in hypoxic conditions (Fig. 6a, left panel). At 5% oxygen, the cells reached a plateau at the third week, and the rate of proliferation in both the short‐ and long‐term experiments was at the same level.
Figure 6.
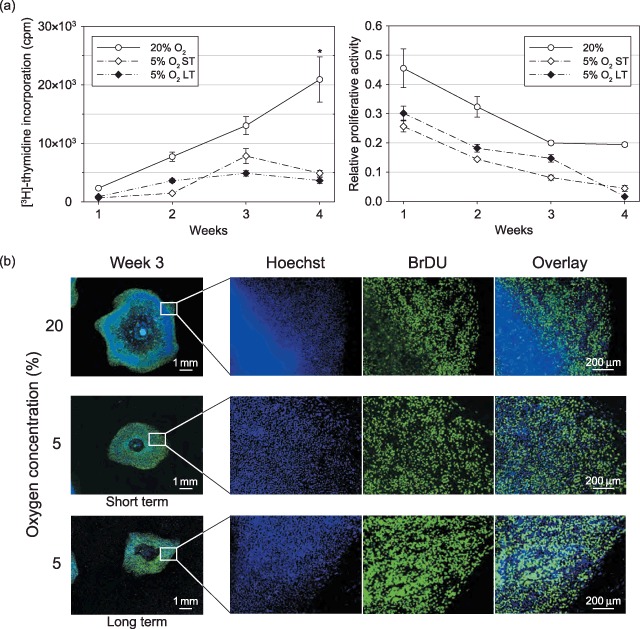
Proliferation of hESCs grown for short‐ or long‐term in hypoxic conditions. The CLS1 cells were routinely grown at 20% oxygen, and exposed to 5% oxygen during a short‐term 4‐week culture. The CLS1‐LT cell line was grown for 4 weeks at 5% oxygen following a previous long‐term (>18 months) propagation in hypoxia. (a) The rate of the colony growth was determined from incorporation of [3H]‐thymidine (left panel) and the relative proliferative activity as a ratio of proliferating areas to the total colony surface was determined from incorporation bromodeoxyuridine (right panel). The plots are based on averages from two independent experiments, and the error bars denote standard error of mean. The asterisk indicates a significant difference (P < 0.05). (b) Microscopic analysis of the proliferation pattern was done both at an overview magnification and a higher resolution at 3 weeks post‐sub‐culturing. The overview images are mosaics of 144 single fields at 10‐fold magnification. ST, short‐term; LT, long‐term; hESC, human embryonic stem cell.
The incorporation of BrdU was conveniently used to identify the regions in the colonies, where cell division took place. The plots in the right panel of Fig. 6a were constructed by normalizing the proliferating areas to the total colony surface. This presentation of data underscores the fact that both in the normoxic and hypoxic conditions the specific mitotic rate is declining with culture time at the same rate.
Imaging studies, coupling capturing of whole colonies with more detailed microscopic visualization, revealed that at 20% oxygen concentration, the colonies were essentially expanding through proliferation in a fringe zone (Fig. 6b). In hypoxia, on the other hand, it was apparent from the representative images of CLS1 cells, which the growth was supported through mitotic activity taking place over the major part of the colonies, except for a small pericentral area.
The hypoxia‐induced undifferentiated phenotype is reversed after inhibition of Notch activation
In order to examine the involvement of the Notch pathway in the suppression of spontaneous differentiation by hypoxia, the cultures of hESCs were incubated with γ‐secretase inhibitor. The γ‐secretase inhibitor exerts its effect on Notch‐mediated signalling through preventing the cleavage of Notch intracellular domain (NICD), which is released and transported to nucleus where it participates in active transcriptional complex, as a result of Notch binding with its specific ligand. The representative images from experiment with CLS1 cells clearly demonstrate that the inhibition of Notch cleavage results in a dramatic reversal of undifferentiated phenotype into mixed type colonies (Fig. 7a).
Figure 7.
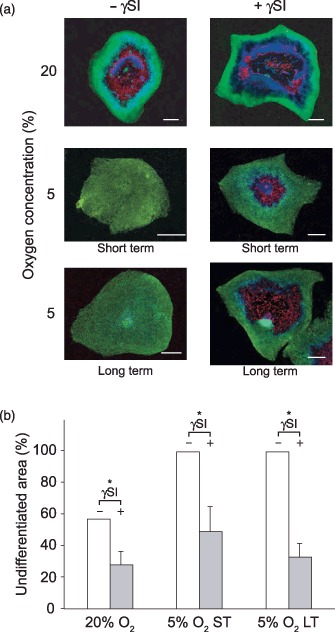
Reversal of undifferentiated hESC phenotype induced by short‐ or long‐term hypoxia through inhibition of Notch1 signalling. The CLS1 line was treated with γSI during a 3‐week normoxic or short‐term hypoxic culture involving 20% or 5% oxygen concentrations, respectively. The cell line CLS1‐LT that has previously been propagated at 5% oxygen in long term (>18 months) was included as well. (a) The extent of undifferentiated zones was revealed through the expression of Oct4 (green), the areas of differentiation by detection of SSEA1 (red), and nuclei were counterstained with Hoechst 33342 (blue). The images are mosaics, comprised of 30 to up to 72 single fields, at 10‐fold magnification. Scale bars indicate 1 mm. (b) The effect of inhibition of Notch1 activation was evaluated from the suppression of the proportion of undifferentiated area versus the total colony surface. The plots are based on averages from two independent experiments and error bars denote standard error of mean. Asterisk indicates a significant difference (P < 0.05). γSI, γ‐secretase inhibitor; ST, short‐term; LT, long‐term; hESC, human embryonic stem cell.
Quantitative image analysis further confirmed that the inhibition resulted in an average proportion of undifferentiated colony areas even smaller than that previously found in normoxic growth conditions (Fig. 7b). Surprisingly, blocking of Notch activation in the control conditions at 20% oxygen also resulted in highly significant suppression of undifferentiated phenotype, in concordance with hypoxic experiments.
Discussion
Until very recently, the importance of oxygen when carrying out in vitro cell culturing has generally been underestimated. However, the last few years have seen a dramatic rise in the number of studies exploring the regulatory role of oxygen both from basic biological as well as applied aspects. With such progress in the understanding of cell regulations, a realization has come about that oxygen is as much an intrinsic bioactive molecule as other control factors of non‐gaseous nature. Our results are the first to demonstrate the responses of hESCs that have been exposed to uninterrupted hypoxia ranging from only a short duration of one 4‐week passage to an extended period for over 18 months. Most of the previous studies did not account for the effect of re‐oxygenation, and furthermore, the long‐term hypoxic adaptation beyond 2–4 weeks has, to the best of our knowledge, not been explored. Providing a stable culture atmosphere that would eliminate deleterious effects of re‐oxygenation during passaging was an essential feature of our experimental setup. Re‐oxygenation has previously been shown to trigger generation of reactive oxygen species and precipitously up‐regulates a number of genes (27), what eventually has an undesirable impact on the hypoxic adaptation.
In the current study, the investigation of multiple oxygen tensions was also carried out for the first time in a systematic fashion. Based on our previous experience with various MSCs (data not published), we opted to use 1% oxygen as the lowest level that can still sustain the cells. Although this level of hypoxia was only marginally tolerable and in some instances it resulted in demise of the culture, it reproducibly produced the most robust responses. Oxygen concentration of 5% provided a useful level at which the best balance between cell survivability and the range of biological responses was observed. The last two oxygen concentrations, 10% and 15% were included to detect any responses to moderate hypoxia. The present report demonstrates that hypoxia, below a threshold of approximately 5% oxygen, renders the cells with a more uniform phenotypic profile. It is important to note that this phenomenon is paralleled with a decrease in cell proliferative rate. In the face of these observations, it seems possible that a fine tuning between growth and differentiation can be achieved. It is conceivable that by lowering oxygen concentration below 5%, the inhibition of differentiation can be improved until the point where the tradeoff with decreased growth rate will become unacceptable. The inhibition of hESC growth by hypoxia is an intriguing observation since in our previous studies on fat tissue‐derived MSCs; we have, in contrast, observed a stimulatory effect of low oxygen concentration (Pia Lund, personal communication). When interpreting the hESC behaviour, one has to keep in mind that MSCs represent quite a disparate cell system. However, when considering a rather homogenous group of ESCs, it seems conceivable that hypoxic exposure may elicit a broad spectrum of responses. Previously, for example, oxygen concentration as low as 1% has not been found to interfere with hESC survival (22), and in studies on murine ESCs various degrees of hypoxia have been shown to both promote proliferation (28) as well as inhibiting self‐renewal (16). The variability of the observed responses may in addition to the cell type and species depend also on different growth conditions and means of propagation, such as trypsinization or dissection, and also inadvertent re‐oxygenation during handling stages. Thus, although the general significance of hypoxia for the maintenance of pluripotential state of hESCs seems at this point firmly established, further studies employing different cell lines and standardized growth conditions would be necessary to truly appreciate the significance of a particular discrete hypoxic level.
The hallmark of both short‐ and long‐term hypoxic settings at 5% oxygen concentrations was preservation of undifferentiated phenotype, for which Oct4 expression was used as a surrogate marker. Although Oct4 is essential, there have been several other markers identified, which correlate with the pluripotential status in hESCs (29, 30). The analysis of Nanog and Notch1 transcriptional expression during short‐ and long‐term hypoxia indicated that the cells, although principally being pluripotent, represent phenotypical variants. More profiling appears necessary to assess the actual scope of this discrepancy. However, because especially the long‐term hypoxic cultures may be an attractive source of precursor cells in specific differentiation applications, their further detailed analysis is highly warranted.
The molecular mechanisms that mediated the maintenance of hESCs pluripotential status at 5% oxygen hypoxia in the current investigation remain unclear at this point. Gustafsson et al. (23) discovered that stabilization of HIF‐1 is necessary to support the undifferentiated phenotype by hypoxia. In our own preliminary experiments, however, we have found that HIF‐1 was present only in the first days after the initiation of hypoxia. Thus, although involvement of HIF‐1 can provide a plausible explanation of the observed hypoxic effect during short‐term exposure, the transitional nature of its stabilization rules out a role for HIF‐1 in a scenario with hypoxic incubation extended over several months. Irrespective of the presence of HIF‐1, it is likely that hypoxia exerts its effect via a cross‐talk with Notch signalling pathway. Notch signalling is well recognized for its involvement in differentiation of hESCs (31, 32). Whether it is induced activation of Notch signalling through facilitation of NICD cleavage or increased transcriptional activity of NICD itself that results from hypoxic exposure needs to be determined. By the same token, other differentiation‐related pathways should be considered for possible involvement. Taken together, the available evidence indicates that hypoxia‐mediated but HIF‐1‐independent regulation involving Notch pathway is essential for long‐term support of hESCs self‐renewal.
Acknowledgements
The authors wish to recognize financial support from The John and Birthe Meyer, Carlsberg, and Toyota Foundations, and EU grant no. LSHC‐CT‐2003–502932 (EUROXY). Special thanks are extended to Meg Duroux for critically revising the manuscript. The expert technical assistance of Ole Jensen, Helle Skjødt Møller, and Mette Bøgh Ringgaard is highly appreciated.
References
- 1. Giordano A, Galderisi U, Marino IR (2007) From the laboratory bench to the patient's bedside: an update on clinical trials with mesenchymal stem cells. J. Cell. Physiol. 211, 27–35. [DOI] [PubMed] [Google Scholar]
- 2. Odorico JS, Kaufman DS, Thomson JA (2001) Multilineage differentiation from human embryonic stem cell lines. Stem Cells 19, 193–204. [DOI] [PubMed] [Google Scholar]
- 3. Xu RH, Peck RM, Li DS, Feng X, Ludwig T, Thomson JA (2005) Basic FGF and suppression of BMP signaling sustain undifferentiated proliferation of human ES cells. Nat. Methods 2, 185–190. [DOI] [PubMed] [Google Scholar]
- 4. Gerecht S, Burdick JA, Ferreira LS, Townsend SA, Langer R, Vunjak‐Novakovic G (2007) Hyaluronic acid hydrogel for controlled self‐renewal and differentiation of human embryonic stem cells. Proc. Natl. Acad. Sci. USA 104, 11298–11303. [DOI] [PMC free article] [PubMed] [Google Scholar]
- 5. Bigdeli N, Andersson M, Strehl R, Emanuelsson K, Kilmare E, Hyllner J et al (2007) Adaptation of human embryonic stem cells to feeder‐free and matrix‐free culture conditions directly on plastic surfaces. J. Biotechnol. 133, 146–153. [DOI] [PubMed] [Google Scholar]
- 6. Wang L, Schulz TC, Sherrer ES, Dauphin DS, Shin S, Nelson AM et al (2007) Self‐renewal of human embryonic stem cells requires insulin‐like growth factor‐1 receptor and ERBB2 receptor signaling. Blood 110, 4111–4119. [DOI] [PMC free article] [PubMed] [Google Scholar]
- 7. Chen HF, Kuo HC, Chien CL, Shun CT, Yao YL, Ip PL et al (2007) Derivation, characterization and differentiation of human embryonic stem cells: comparing serum‐containing versus serum‐free media and evidence of germ cell differentiation. Hum. Reprod. 22, 567–577. [DOI] [PubMed] [Google Scholar]
- 8. Ellerstrom C, Strehl R, Noaksson K, Hyllner J, Semb H (2007) Facilitated expansion of human embryonic stem cells by single‐cell enzymatic dissociation. Stem Cells 25, 1690–1696. [DOI] [PubMed] [Google Scholar]
- 9. Adewumi O, Aflatoonian B, Ahrlund‐Richter L, Amit M, Andrews PW, Beighton G et al (2007) Characterization of human embryonic stem cell lines by the International Stem Cell Initiative. Nat. Biotechnol. 25, 803–816. [DOI] [PubMed] [Google Scholar]
- 10. Bakre MM, Hoi A, Mong JC, Koh YY, Wong KY, Stanton LW (2007) Generation of multipotential mesendodermal progenitors from mouse embryonic stem cells via sustained Wnt pathway activation. J. Biol. Chem. 282, 31703–31712. [DOI] [PubMed] [Google Scholar]
- 11. Toh WS, Yang Z, Liu H, Heng BC, Lee EH, Cao T (2007) Effects of culture conditions and bone morphogenetic protein 2 on extent of chondrogenesis from human embryonic stem cells. Stem Cells 25, 950–960. [DOI] [PubMed] [Google Scholar]
- 12. Metallo CM, Ji L, De Pablo JJ, Palecek SP (2008) Retinoic acid and bone morphogenetic protein signaling synergize to efficiently direct epithelial differentiation of human embryonic stem cells. Stem Cells 26, 372–380. [DOI] [PubMed] [Google Scholar]
- 13. Davidson KC, Jamshidi P, Daly R, Hearn MT, Pera MF, Dottori M (2007) Wnt3a regulates survival, expansion, and maintenance of neural progenitors derived from human embryonic stem cells. Mol. Cell. Neurosci. 36, 408–415. [DOI] [PubMed] [Google Scholar]
- 14. Mfopou JK, De Groote V, Xu X, Heimberg H, Bouwens L (2007) Sonic hedgehog and other soluble factors from differentiating embryoid bodies inhibit pancreas development. Stem Cells 25, 1156–1165. [DOI] [PubMed] [Google Scholar]
- 15. Schroeder T, Meier‐Stiegen F, Schwanbeck R, Eilken H, Nishikawa S, Hasler R et al (2006) Activated Notch1 alters differentiation of embryonic stem cells into mesodermal cell lineages at multiple stages of development. Mech. Dev. 123, 570–579. [DOI] [PubMed] [Google Scholar]
- 16. Jeong CH, Lee HJ, Cha JH, Kim JH, Kim KR, Yoon DK et al (2007) Hypoxia‐inducible factor‐1 alpha inhibits self‐renewal of mouse embryonic stem cells in vitro via negative regulation of the leukemia inhibitory factor‐STAT3 pathway. J. Biol. Chem. 282, 13672–13679. [DOI] [PubMed] [Google Scholar]
- 17. Ferguson JE 3rd, Wu Y, Smith K, Charles P, Powers K, Wang H, Patterson C (2007) ASB4 is a hydroxylation substrate of FIH and promotes vascular differentiation via an oxygen‐dependent mechanism. Mol. Cell. Biol. 27, 6407–6419. [DOI] [PMC free article] [PubMed] [Google Scholar]
- 18. Fehrer C, Brunauer R, Laschober G, Unterluggauer H, Reitinger S, Kloss F et al (2007) Reduced oxygen tension attenuates differentiation capacity of human mesenchymal stem cells and prolongs their lifespan. Aging Cell 6, 745–757. [DOI] [PubMed] [Google Scholar]
- 19. Chen L, Fink T, Ebbesen P, Zachar V (2006a) Hypoxic treatment inhibits insulin‐induced chondrogenesis of ATDC5 cells despite upregulation of DEC1. Connect. Tissue Res. 47, 119–123. [DOI] [PubMed] [Google Scholar]
- 20. Fink T, Abildtrup L, Fogd K, Abdallah BM, Kassem M, Ebbesen P et al (2004) Induction of adipocyte‐like phenotype in human mesenchymal stem cells by hypoxia. Stem Cells 22, 1346–1355. [DOI] [PubMed] [Google Scholar]
- 21. Chen L, Fink T, Ebbesen P, Zachar V (2006b) Optimized chondrogenesis of ATCD5 cells through sequential regulation of oxygen conditions. Tissue Eng. 12, 559–567. [DOI] [PubMed] [Google Scholar]
- 22. Ezashi T, Das P, Roberts RM (2005) Low O2 tensions and the prevention of differentiation of hES cells. Proc. Natl. Acad. Sci. USA 102, 4783–4788. [DOI] [PMC free article] [PubMed] [Google Scholar]
- 23. Gustafsson MV, Zheng X, Pereira T, Gradin K, Jin S, Lundkvist J et al (2005) Hypoxia requires notch signaling to maintain the undifferentiated cell state. Dev. Cell 9, 617–628. [DOI] [PubMed] [Google Scholar]
- 24. Lysdahl H, Gabrielsen A, Minger SL, Patel MJ, Fink T, Petersen K et al (2006) Derivation and characterization of four new human embryonic stem cell lines: the Danish experience. Reprod. Biomed. Online 12, 119–126. [DOI] [PubMed] [Google Scholar]
- 25. Babaie Y, Herwig R, Greber B, Brink TC, Wruck W, Groth D et al (2007) Analysis of Oct4‐dependent transcriptional networks regulating self‐renewal and pluripotency in human embryonic stem cells. Stem Cells 25, 500–510. [DOI] [PubMed] [Google Scholar]
- 26. Henderson JK, Draper JS, Baillie HS, Fishel S, Thomson JA, Moore H et al (2002) Preimplantation human embryos and embryonic stem cells show comparable expression of stage‐specific embryonic antigens. Stem Cells 20, 329–337. [DOI] [PubMed] [Google Scholar]
- 27. Danielsson BR, Danielsson C, Nilsson MF (2007) Embryonic cardiac arrhythmia and generation of reactive oxygen species: common teratogenic mechanism for IKr blocking drugs. Reprod. Toxicol. 24, 42–56. [DOI] [PubMed] [Google Scholar]
- 28. Lee SH, Heo JS, Han HJ (2007) Effect of hypoxia on 2‐deoxyglucose uptake and cell cycle regulatory protein expression of mouse embryonic stem cells: involvement of Ca2+ /PKC, MAPKs and HIF‐1alpha. Cell. Physiol. Biochem. 19, 269–282. [DOI] [PubMed] [Google Scholar]
- 29. Pan G, Thomson JA (2007) Nanog and transcriptional networks in embryonic stem cell pluripotency. Cell Res. 17, 42–49. [DOI] [PubMed] [Google Scholar]
- 30. Sun Y, Li H, Yang H, Rao MS, Zhan M (2006) Mechanisms controlling embryonic stem cell self‐renewal and differentiation. Crit. Rev. Eukaryot. Gene Expr. 16, 211–231. [DOI] [PubMed] [Google Scholar]
- 31. Sahlgren C, Lendahl U (2006) Notch signaling and its integration with other signaling mechanisms. Regen. Med. 1, 195–205. [DOI] [PubMed] [Google Scholar]
- 32. Dreesen O, Brivanlou AH (2007) Signaling pathways in cancer and embryonic stem cells. Stem Cell Rev. 3, 7–17. [DOI] [PubMed] [Google Scholar]