

Abstract
Abstract. Embryonal carcinoma cells are pluripotent stem cells derived from teratocarcinomas and are considered to be the malignant counterparts of human embryonic stem cells. As there are few reliable experimental systems available to study the molecular mechanisms governing normal embryogenesis, well‐characterized human embryonal carcinoma stem cell lines may provide a robust and simple model to study certain aspects of pluripotency and cellular differentiation. Here, we have analysed NTERA‐2 cL.D1 cells at molecular and cellular levels during expansion and differentiation, via formation of cell aggregates similar to embryoid bodies in embryonic stem cells. Thus, human embryonal carcinoma cells may provide a valuable insight into cell fate determination, into the embryonic ectoderm, mesoderm and endoderm and their downstream derivatives.
INTRODUCTION
Pluripotent stem cells derived from the inner cell mass of a blastocyst have the ability to self‐renew in vitro and maintain their ability to differentiate into all three lineages: ectoderm, mesoderm and endoderm. Since 1998, remarkable progress has been achieved regarding the derivation, maintenance and expansion of undifferentiated human embryonic stem cells in vitro (Thomson et al. 1998; Reubinoff et al. 2000). Much of what we currently know about pluripotent stem cells is based on research performed on nonhuman primate embryonic stem (ES) cells and cells derived from embryonal carcinoma (EC) cells.
For many years, EC cells have served as convenient means for the investigation of molecular mechanisms by which stem cells commit to lineage selection during embryonic development. Also, human EC cells have provided an excellent model for standardization of characterization tests in human ES cells. Pluripotent EC cells are derived from teratocarcinomas that arise from transformed germ cells. EC cells are stem cells of such tumours and are generally considered to be the malignant counterparts of ES cells (Andrews et al. 2001). The NTERA‐2 cL.D1 cell line is a pluripotent human testicular embryonal carcinoma cell line derived by cloning the NTERA‐2 cells established from a nude mouse xenograft of the TERA‐2. The TERA‐2 cell line was originally derived from a metastasis of a human testicular teratocarcinoma (Andrews et al. 1984; Dewji & Singer 1997). This cell line has been shown to differentiate along neuroectodermal lineages after exposure to retinoic acid or hexamethylene bisacetamide (1984, 1990) and the gene regulation during neuronal differentiation has also been documented (Ackerman et al. 1994). Recently, Dr Mahendra Rao and his group have demonstrated the differentiation of dopaminergic neurones from NTERA‐2 cells (Schwartz et al. 2005). Although, EC stem cells can provide a simple and robust experimental model, their differentiation potential is often limited, unlike ES cell differentiation (Przyborski et al. 2004).
Being overwhelmed with the potential of ES cell technology, we must also realize that many challenges lie ahead. For example, culture of the several existing human ES cell lines is reliant on their growth and maintenance on mouse embryonic fibroblast feeder cells (Martin 1981; Thomson et al. 1998; Reubinoff et al. 2000). Furthermore, the topic of manipulation of human ES cell differentiation to produce a specialized tissue type is poorly understood, and data on mouse ES cells do not translate well to human ES cells. Although extensive research is being conducted to address these issues, experiments using human EC cells as a model of early embryogenesis remain a useful and viable alternative (Przyborski et al. 2004). The availability and accessibility of human ES cell research materials is also limiting. Thus, the availability of EC lines for comparative studies will enable the establishment of more standardized methods of propagation, expansion and differentiation, and better refinement of characterization criteria, ultimately shortening the time to begin to explore therapeutic efficacy with the ES cells.
To gain a better understanding of the differentiation potential of the NTERA‐2 cL.D1 cell line, genetic and protein‐based assays were carried out and the data were compared to an established pluripotent human ES line, BG01 (Mitalipova et al. 2003). We suggest that NTERA‐2 cells can be useful as an additional or alternative human ES cell resource in the field of embryonic stem cell biology complementing variant human ES cell lines.
MATERIALS AND METHODS
Culture of the NTERA‐2 cell line
The NTERA‐2 cL.D1cell line was obtained from the American Type Culture Collection (ATCC#CRL‐1973). Cryopreserved cells were thawed and were plated onto 60‐mm tissue culture dishes (Nunc, Roskilde, Denmark) containing no feeder layer. They were maintained in growth medium consisting of DMEM (Gibco‐BRL, Grand Island, NY, USA) supplemented with 10% FBS (Gibco‐BRL), 2 mm l‐glutamine (Gibco‐BRL), MEM non‐essential amino acids 1X (Gibco‐BRL), 0.1 mmβ‐mercaptoethanol (Gibco‐BRL) and penicillin 100 IU/ml and streptomycin (100 µg/ml) at 37 °C, 5% CO2. The medium was changed on alternate days. Cells were expanded by passaging every 2–3 days using 0.05% trypsin‐EDTA (Gibco‐BRL).
Generation of cell aggregates
NTERA‐2 cells were grown in suspension at a concentration of 4 × 10⁵ cells per 60 mm bacteriological dish for 6–14 days, in the media as described above. Within 48 h of incubation, the cells started forming compact spheroid cell aggregates, which grew bigger with time and appeared similar to embryoid body configurations of ES cells. We then checked the multilineage differentiation potential of these cell aggregates by gene expression and by immunofluorescence analyses, at progressive days of differentiation.
RNA extraction and reverse transcription–PCR analysis
Reverse transcription–PCR (RT–PCR) was carried out as described in an earlier report from our laboratory (Pal & Khanna 2005). The expression of a set of stem cell markers including Oct‐4, Nanog, Rex1, Sox‐2, FGF4, Utf1, Thy1, Cripto1, ABCG2, Dppa5, TERT, connexin 43, connexin 45, typical of undifferentiated cells; lineage‐specific markers including keratin 5, keratin 15, keratin 18, Sox‐1, NFH (ectoderm), brachyury, Msx1, MyoD, HAND1, cardiac actin (mesoderm), GATA4, AFP, HNF‐4alpha, HNF‐3beta, albumin and PDX1 (endoderm) (please refer to Table 1 for details of primers); and a set of signalling molecules, namely FGF‐8, IGF‐1, TGF‐beta1, BMP‐2, BMP‐4, FGFR2, FGFR3, EGFR and beta‐catenin were checked (please refer Table 1 for details of primers). For all the genes, PCRs were performed for 35 cycles, consisting of an initial denaturation at 94 °C for 1 min, then 94 °C for 30 s, annealing temperature of the respective gene primer for 45 s (for annealing temperature values of individual primers please refer Table 1) and 72 °C for 1 min followed by termination by final extension at 72 °C for 5 min.
Table 1.
Details of primers
| Gene | Primer sequence | Annealing temperature (°C) | Expected product size (bp) |
|---|---|---|---|
| Housekeeping gene | |||
| GAPDH | 5′‐TGAAGGTCGGAGTCAACGGATTTGGT‐3′ | 60 | 892 |
| 5′‐CATGTGGGCCATGAGGTCCACCAC‐3′ | |||
| Pluripotent stem cell markers | |||
| Oct‐4 | 5′‐CGRGAAGCTGGAGAAGGAGAAGCTG‐3′ | 58 | 247 |
| 5′‐CAAGGGCCGCAGCTTACACATGTTC‐3′ | |||
| Nanog | 5′‐CCTCCTCCATGGATCTGCTTATTCA‐3′ | 52 | 262 |
| 5′‐CAGGTCTTCACCTGTTTGTAGCTGAG‐3′ | |||
| Rex1 | 5′‐GCGTACGCAAATTAAAGTCCAGA‐3′ | 56 | 306 |
| 5′‐CAGCATCCTAAACAGCTCGCAGAAT‐3′ | |||
| Sox2 | 5′‐CCCCCGGCGGCAATAGCA‐3′ | 55 | 448 |
| 5′‐TCGGCGCCGGGGAGATACAT‐3′ | |||
| Thy1 | 5′‐CATGAGAATACCAGCAGTTCACCCA‐3′ | 55 | 272 |
| 5′‐CACTTGACCAGTTTGTCTCTGAGCA‐3′ | |||
| FGF 4 | 5′‐CTACAACGCCTACGAGTCCTACA‐3′ | 53 | 370 |
| 5′‐GTTGCACCAGAAAAGTCAGAGTTG‐3′ | |||
| ABCG2 | 5′‐GTTTATCCGTGGTGTGTCTGG‐3′ | 62 | 684 |
| 5′‐CTGAGCTATAGAGGCCTGGG‐3′ | |||
| Dppa5 | 5′‐ATGGGAACTCTCCCGGCACG‐3′ | 62 | 353 |
| 5′‐TCACTTCATCCAAGGGCCTA‐3′ | |||
| Utf1 | 5′‐ACCAGCTGCTGACCTTGAAC‐3′ | 60 | 230 |
| 5′‐TTGAACGTACCCAAGAACGA‐3′ | |||
| Cripto1 | 5′‐ACAGAACCTGCTGCCTGAAT‐3′ | 62 | 217 |
| 5′‐ATCACAGCCGGGTAGAAATG‐3′ | |||
| hTERT | 5′‐AGCTATGCCCGGACCTCTAT‐3′ | 60 | 165 |
| 5′‐GCCTGCAGCAGGAGGATCTT‐3′ | |||
| Gap junction proteins | |||
| Connexin 43 | 5′‐TACCATGCGACCAGTGGTGCGCT‐3′ | 64 | 295 |
| 5′‐GAATTCTGGTTATCATCGGGGAA‐3′ | |||
| Connexin 45 | 5′‐CTATGCAATGCGCTGGAAACAACA‐3′ | 64 | 819 |
| 5′‐CCCTGATTTGCTACTGGCAGT‐3′ | |||
| Ectodermal markers | |||
| Keratin 8 | 5′‐TGAGGTCAAGGCACAGTACG‐3′ | 60 | 161 |
| 5′‐TGATGTTCCGGTTCATCTCA‐3′ | |||
| Keratin 15 | 5′‐CACAGTCTGCTGAGGTTGGA‐3′ | 62 | 196 |
| 5′‐GAGCTGCTCCATCTGTAGGG‐3′ | |||
| Keratin 18 | 5′‐GGAGGTGGAAGCCGAAGTAT‐3′ | 60 | 164 |
| 5′‐GAGAGGAGACCACCATCGCC‐3′ | |||
| Sox‐1 | 5′‐TACAGCCCCATCTCCAACTC‐3′ | 60 | 201 |
| 5′‐GCTCCGACTTCACCAGAGAG‐3′ | |||
| NFH | 5′‐TGAACACAGACGCTATGCGCTCAG‐3′ | 58 | 400 |
| 5′‐CACCTTTATGTGAGTGGACACAGAG‐3′ | |||
| Mesodermal markers | |||
| Brachyury | 5′‐TAAGGTGGATCTTCAGGTAGC‐3′ | 60 | 251 |
| 5′‐CATCTCATTGGTGAGCTCCCT‐3′ | |||
| MyoD | 5′‐GTCGAGCCTAGACTGCCTGT‐3′ | 60 | 217 |
| 5′‐GGTATATCGGGTTGGGGTTC‐3′ | |||
| Msx1 | 5′‐CCTTCCCTTTAACCCTCACAC‐3′ | 62 | 287 |
| 5′‐CCGATTTCTCTGCGCTTTTC‐3′ | |||
| HAND1 | 5′‐GCCTAGCCACCACTGCGCTTTTC‐3′ | 62 | 389 |
| 5′‐CGGCTCACTGGTTTAACTCC‐3′ | |||
| Cardiac‐actin | 5′‐TCTATGAGGGCTACGCTTTG‐3′ | 50 | 630 |
| 5′‐CCTGACTGGAAGGTAGATGG‐3′ | |||
| Endodermal markers | |||
| AFP | 5′‐AGAACCTGTCACAAGCTGTG‐3′ | 62 | 577 |
| 5′‐GACAGCAAGCTGAGGATGTC‐3′ | |||
| GATA4 | 5′‐CTCCTTCAGGCAGTGAGAGC‐3′ | 52 | 680 |
| 5′‐GAGATGCAGTGTGCTCGTGC‐3′ | |||
| HNF‐4alpha | 5′‐TCTCATGTTGAAGCCACTGC‐3′ | 50 | 501 |
| 5′‐GGTTTGTTTCTCGGGTTGA‐3′ | |||
| HNF‐3beta | 5′‐GACAAGTGAGAGAGCAAGTG‐3′ | 56 | 237 |
| 5′‐ACAGTAGTGGAAACCGGAG‐3′ | |||
| Albumin | 5′‐CCTTTGGCACAATGAAGTGGGTAACC‐3′ | 58 | 450 |
| 5′‐CAGCAGTCAGCCATTTCACCATAGG‐3′ | |||
| PDX1 | 5′‐GTCCTGGAGGAGCCCAAC‐3′ | 62 | 362 |
| 5′‐GCAGTCCTGCTCAGGCTC‐3′ | |||
| Signalling molecules | |||
| FGF8 | 5′‐CTCATCCGGACCTACCAACTCT‐3′ | 55 | 390 |
| 5′‐GCTTCATGAAAGTGGACCTCACG‐3′ | |||
| IGF‐1 | 5′‐TGTCCTCGCATCTCTCTCTCTTCTAC‐3′ | 56 | 268 |
| 5′‐CGCAATACATCTCCAGCCTCCTTA‐3′ | |||
| TGF‐b1 | 5′‐GAGCCTGAGGCCGACTACTA‐3′ | 55 | 235 |
| 5′‐GCTGGTACAGCTCCACGTGCT‐3′ | |||
| BMP‐2 | 5′‐GGAAGACTACCAGAAACGAG‐3′ | 56 | 657 |
| 5′‐AGATGATCAGCCAGAGGAAAA‐3′ | |||
| BMP‐4 | 5′‐ACCTGAGACGGGGAGAAAA‐3′ | 56 | 313 |
| 5′‐TTAAAGAGGAAACGAAAAGCA‐3′ | |||
| FGFR2 | 5′‐TGACAGCCTCTGACAACACAAC‐3′ | 50 | 329 |
| 5′‐GAAATCAAAGAACCTGTGGGC‐3′ | |||
| FGFR3 | 5′‐ATCCTCGGGAGATGACGAAGAC‐3′ | 64 | 306 |
| 5′‐GGATGCTGCCAAACTTGTTCTC‐3′ | |||
| EGFR | 5′‐CAGTCGTCAGCCTGAACATAACATCC‐3′ | 58 | 402 |
| 5′‐AGGTTGCACTTGTCCACGCATTCCC‐3′ | |||
| Beta‐catenin | 5′‐ATGGAACCAGACACACAAAAGC‐3′ | 50 | 197 |
| 5′‐GCTACTTGTTCTGAGTGAAG‐3′ | |||
Immunochemistry
Immunostaining was performed similar to the method described in our earlier report (Pal & Khanna 2005). Here, we have checked a panel of undifferentiated stem cell markers like Oct‐4, SSEA‐3, SSEA‐4, TRA‐1‐60, TRA‐1‐81, alkaline phosphatase, connexin 43, E‐cadherin, and a group of markers of differentiated such as nestin (ectoderm), smooth muscle actin and myoglobin (mesoderm), GATA4 and HNF‐4alpha (endoderm) (please refer to Table 2 for details of antibodies). After mounting, the cells were observed under a fluorescence microscope (Nikon Eclipse E600, Kanawaga, Japan) to evaluate immunopositive areas. Similarly, colocalization of two proteins was shown by dual staining of Oct‐4/SSEA‐4 and Oct‐4/connexin 43 markers. Negative controls, in all cases, were achieved by omitting primary antibodies (data not shown).
Table 2.
Details of antibodies
| Name of the antibody | Company | Dilution used |
|---|---|---|
| Oct‐3/4 | Santa Cruz, USA | 1 : 100 |
| SSEA‐1 | ES cell characterization kit (Chemicon; cat. no. SCR001) | 1 : 40 |
| Ssea‐3 | ||
| SSEA‐4 | ||
| TRA‐1–60 | ||
| TRA‐1–81 | ||
| Alkaline phosphatase | ||
| E‐cadherin | Santa Cruz, USA | 1 : 200 |
| Connexin 43 | Santa Cruz, USA | 1 : 200 |
| Nestin | Chemicon, USA | 1 : 200 |
| Smooth muscle actin | Santa Cruz, USA | 1 : 100 |
| GATA4 | Santa Cruz, USA | 1 : 100 |
| Myoglobin | Santa Cruz, USA | 1 : 200 |
| HNF‐4alpha | Santa Cruz, USA | 1 : 200 |
Flow cytometry
Immunophenotyping of cultured NTERA‐2 cells was carried out using flow cytometry. The cells were first trypsinized into single cell suspension, washed with 1× PBS and incubated with 100 µL of diluted primary antibody, followed by treatment with the respective conjugate, tagged to FITC for 30 min at 4 °C (1 : 500). About 100 µL of cell suspension containing 1 × 10⁶ cells was incubated with the same set of antibodies including SSEA‐1, SSEA‐4, SSEA‐3, TRA‐1‐60 and TRA‐1‐81 (Chemicon Inc., Temecula, CA, USA; 1 : 400) along with an appropriate isotype matched control. Results were acquired and analysed on a FACS Calibur flow cytometer (Becton Dickinson, Franklin Lakes, NJ, USA) equipped with a 488‐nm argon laser. A total of 20 000 events were acquired in each case to determine the percentage expression of different cell surface markers.
In vitro differentiation potential of NTERA‐2
To initiate differentiation, NTERA‐2 cells were induced to embryoid body formation similar to human ES cells in suspension culture as mentioned earlier. The age of the cell aggregates or embryoid bodies, for differentiation induction into multiple phenotypes belonging to different germ layers, was decided on the basis of expression profile of the lineage‐specific markers in the cell aggregates as evidenced by RT–PCR.
Mesodermal differentiation
After induction of suspension culture, 6‐day‐old embryoid bodies were seeded onto 35‐mm tissue culture dishes (Nunc) precoated with 0.1% gelatin (Sigma, St Louis, MO, USA) in 80% DMEM media supplemented with 15% FBS, 1% none‐ssential amino acid, 1 mm l‐glutamine, 0.1%β‐mercaptoethanol and 12.5 ng/ml human basic fibroblast growth factor. Change in morphology of the cells towards a myocyte‐like phenotype was observed between the 10th and 15th day of differentiation and the cells were collected for further analysis after 21 days in differentiation conditions.
Endodermal differentiation
To induce endodermal differentiation, 8‐day‐old embryoid bodies were plated onto 35‐mm plastic tissue culture plates (Nunc) precoated with 1% matrigel (BD Biosciences) and allowed to differentiate for 20–25 days. The growth factors were added either alone or in combination as early‐, mid‐ and late‐stage growth factors. The final composition of the optimized endoderm differentiation medium contained, DMEM (high glucose), 10% FBS, 1 mm l‐glutamine, 1% non‐essential amino acids, 0.1 mmβ‐mercaptoethanol, 20 ng/ml hepatocyte growth factor, 50 ng/ml aFGF, 10 ηg/ml human oncostatin and 1× insulin‐transferrin‐selenious acid. After 20–25 days of differentiation, cell pellets were collected for gene expression analysis. For immunofluorescence analysis, 2‐well chamber slides were prepared.
RESULTS
NTERA‐2 cells are capable of forming cell aggregates typical of embryoid bodies in ES cells
Following thawing and plating, the NTERA‐2 cells initially required 4–5 days to recover and become confluent. Passaging with 0.05% trypsin‐EDTA was possible every 2–3 days indicating efficient expansion of the cell line. These EC cells exhibited uniform morphology (Fig. 1c) and a predictable growth rate. NTERA‐2 cells, upon growing in suspension culture, started forming cell aggregates within 48 h of incubation and could be successfully maintained for up to 14 days in culture (Paquet‐Durand et al. 2003). These cell aggregates further demonstrated formation of dense ‘blood islands’ typical of embryoid bodies derived from ES cells, which increased during differentiation starting from the 6th day onwards (Fig. 4a).
Figure 1.
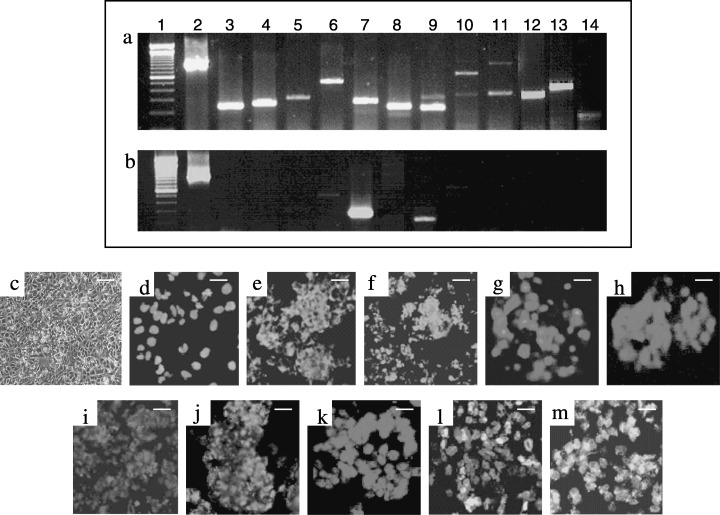
Assessment of undifferentiated state of the NTERA‐2 cells by RT–PCR and immunofluorescence analyses. (a) Comprehensive expression of pluripotent stem cell markers including Oct‐4, Nanog, Rex1, Sox‐2, FGF4, Utf1, Thy1, Cripto1, ABCG2, Dppa5 and TERT; GAPDH; lane 2 is used as a housekeeping gene control; (b) HEF cells are used as negative control; (c) confluent mono‐layered NTERA‐2 cells after 4 days in culture; lane 1 shows 100 bp DNA marker. Immunofluorescence analysis of NTERA‐2 cells with undifferentiated stem cell markers including (d) Oct‐4, (e) SSEA‐3, (f) SSEA‐4, (g) TRA‐1‐60, (h) TRA‐1‐81, (i) alkaline phosphatase and gap junction proteins, (j) Connexin 43, and (k) E‐cadherin; coexpression of (l) Oct‐4 (Texas‐red) with SSEA‐4 (FITC‐green) and (m) Oct‐4 (Texas‐red) with Connexin 43 (FITC‐green) proteins shown by double labelling; scale bars, 50 µm.
Figure 4.
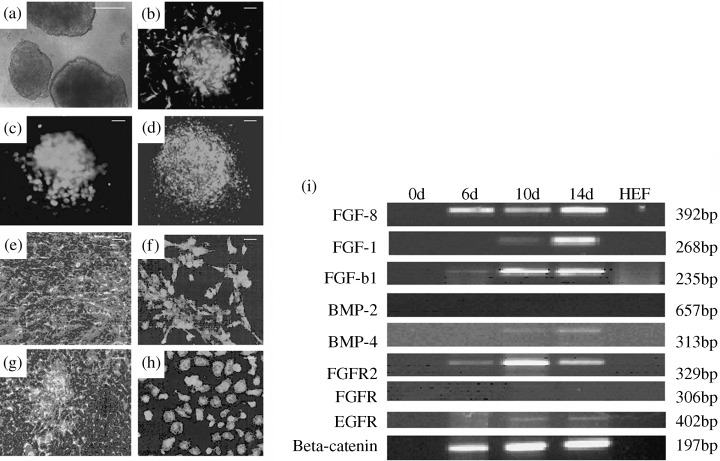
Evaluation of differentiation potential of NTERA‐2 cell line by immunofluorescence analysis and sequential activation of signalling molecules in inducing differentiation of NTERA‐2. (a) Cell aggregates with dense accumulation of blood islands after 14 days of differentiation (scale bar, 100 µm); 14‐day cell aggregates showing positive green immunostaining for (b) Nestin (ectoderm); (c) Myoglobin (mesoderm) and (d) GATA4 (endoderm); (e) phase‐contrast micrograph of 15‐day‐old mesodermal cells; (f) mesodermal cells showing positive immunostaining with antimyoglobin antibody; (g) phase‐contrast micrograph of 21‐day‐old endodermal cells; (h) endodermal cells showing positive immunostaining with anti‐HNF‐4alpha antibody (scale bars, 50 µm); (i) RT–PCR analysis depicting gene expression profile of a set of important signalling molecules and their receptors including FGF‐8, IGF‐1, TGF‐beta1, BMP‐2, BMP‐4, FGFR2, FGFR3, EGFR and beta‐catenin in 0‐, 6‐, 10‐ and 14‐day‐old cell aggregates implicating their inductive role in differentiation of NTERA‐2 cells into their subsequent lineages namely ectoderm, mesoderm and endoderm.
Differential pattern of gene regulation implicating maintenance of pluripotency and onset of cellular differentiation in NTERA‐2 cells
Gene expression analysis by RT–PCR using gene‐specific primers was carried out to assess the pluripotency and in vitro differentiation potential of the NTERA‐2 cells. These cells exhibited unambiguous expression of a set of important genes associated with pluripotency including Oct‐4, Nanog, Rex‐1, Sox‐2, Cripto1, FGF‐4, Thy1, Utf1, ABCG2, Dppa5, TERT and also the gap junction proteins such as connexin 43 and connexin 45 (Fig. 1a and Table 3). Human embryonic feeder cells, used as a negative control, were devoid of the expression of any of these markers (Fig. 1b). Furthermore, the expression profile of a set of genes related to lineage‐specific differentiation was evaluated with 0‐, 6‐, 10‐ and 14‐day‐old cell aggregates (Fig. 3). Consistent expression of early‐stage ectodermal markers such as keratin 8, keratin 15 and keratin 18, on 6–14 days of differentiation was observed, with no expression before differentiation. The late‐stage neuroectodermal markers, Sox‐1 and NFH, were present only on the 10th−14th days of differentiation. Among the mesodermal lineage markers, Msx1, a precardiac transcription factor, was expressed uniformly from day 6 through day 14 of differentiation. However, the other mesodermal markers, including brachyury, HAND1, MyoD and cardiac‐actin, demonstrated either weak expression or no expression at all in these NTERA‐2 cells. Similarly, the early endodermal cell markers including AFP, HNF‐4alpha and HNF‐3beta exhibited expression on the 6th and 10th days of cell aggregate formation, while GATA4 demonstrated a transient increase from the 10th day until the 14th day in suspension culture. Very weak expression of albumin and PDX1, or markers for mature hepatocytes and pancreatic islet cells was detected, indicating absence of mature endodermal derivatives. These data are consistent with those obtained from experiments on established human ES cell lines, namely, BG01, BG02, BG03 and H1, H7, H9, H14 (Bhattacharya et al. 2004; Brimble et al. 2004; Zeng et al. 2004).
Table 3.
Summary of gene expression analysis
| Serial number | Name of the gene | Observed expression | ||
|---|---|---|---|---|
| NTERA‐2 | BG01 human ES cell line (Brimble et al. 2004) | HEF | ||
| Housekeeping gene | ||||
| 1. | GAPDH | + | + | + |
| Pluripotent stem cell markers | ||||
| 2. | Oct−3/4 | + | + | – |
| 3. | Nanog | + | + | – |
| 4. | Rex1 | + | + | – |
| 5. | TDGF1 | + | + | – |
| 6. | Thy1 | + | NR | + |
| 7. | Sox‐2 | + | + | – |
| 8. | FGF4 | + | NR | – |
| 9. | Utf1 | + | + | – |
| 10. | ABCG2 | + | + | – |
| 11. | Dppa5 | + | + | + |
| 12. | Cripto | + | + | – |
| 13. | TERT | + | + | – |
| Gap junction proteins | ||||
| 14. | Connexin 43 | + | + | – |
| 15. | Connexin 45 | + | + | – |
| Ectodermal markers in cell aggregates | ||||
| 16. | Keratin 8 | + | + | – |
| 17. | Keratin 15 | + | + | – |
| 18. | Keratin 18 | + | + | – |
| 19. | NFH | + | + | – |
| 20. | Sox‐1 | + | + | – |
| Mesodermal markers in cell aggregates | ||||
| 21. | Brachyury | + | + | – |
| 22. | MyoD | + | + | – |
| 23. | Msx1 | + | + | + |
| 24. | HAND1 | + | + | – |
| 25. | C‐actin | – | + | – |
| Endodermal markers in cell aggregates | ||||
| 26. | GATA4 | + | + | – |
| 27. | AFP | + | + | – |
| 28. | HNF4a | – | NR | – |
| 29. | HNF3b | + | + | – |
| 30. | Albumin | – | NR | – |
| 31. | PDX1 | + | + | – |
| Signalling molecules in cell aggregates | ||||
| 32. | FGF‐8 | + | NR | – |
| 33. | IGF‐1 | + | NR | – |
| 34. | TGF‐beta1 | + | + | – |
| 35. | BMP‐2 | – | + | – |
| 36. | BMP‐4 | + | + | – |
| 37. | FGFR2 | + | + | – |
| 38. | FGFR3 | – | NR | – |
| 39. | EGFR | + | + | – |
| 40. | Beta‐catenin | + | + | – |
NB: (+) denotes positive expression; (–) denotes no expression; and (NR) denotes not reported.
Figure 3.
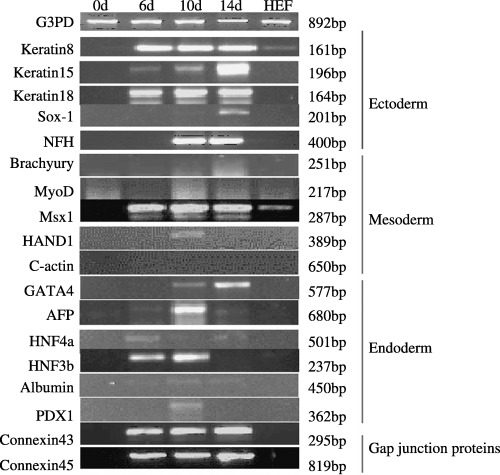
A comprehensive gene expression profiling of cell aggregates derived from NTERA‐2 cells by RT–PCR. Differential expression of various lineage specific markers in 0‐, 6‐, 10‐ and 14‐day‐old cell aggregates showing keratin 8, keratin 15, keratin 18, Sox‐1, NFH (ectoderm); brachyury, Msx1, MyoD, HAND1, cardiac actin (mesoderm); GATA4, AFP, HNF‐4alpha, HNF‐3beta, albumin and PDX1 (endoderm). HEF is used as a negative control.
Protein analysis by immunostaining supports the observation of gene expression profiles in NTERA‐2
Human pluripotent stem cells expressed the globo‐series cell surface antigens like SSEA‐3, SSEA‐4, TRA‐1–60, TRA‐1–81 and the POU5f1 encoded transcription factor, Oct‐4 typical of human ES cells, along with E‐cadherin and connexin 43 (Fig. 1d–k). Colocalization of Oct‐4, SSEA‐4 and connexin 43, respectively, were demonstrated by double labelling (Fig. 1l–m) of these proteins. The NTERA‐2 cells also exhibited alkaline phosphatase activity (Fig. 1i). Flow cytometric analysis further demonstrated a considerable population of NTERA‐2 cells to be immunoreactive to cell surface antigens such as SSEA‐3 (53.16%), SSEA‐4 (66.23%), TRA‐1‐60 (32.94%) and TRA‐1‐81 (28.48%) (Fig. 2a–l). Furthermore, the 14‐day‐old cell aggregates stained positively for differentiation markers like nestin (ectoderm), smooth muscle actin (mesoderm) and GATA4 (endoderm) (Fig. 4b–d).
Figure 2.
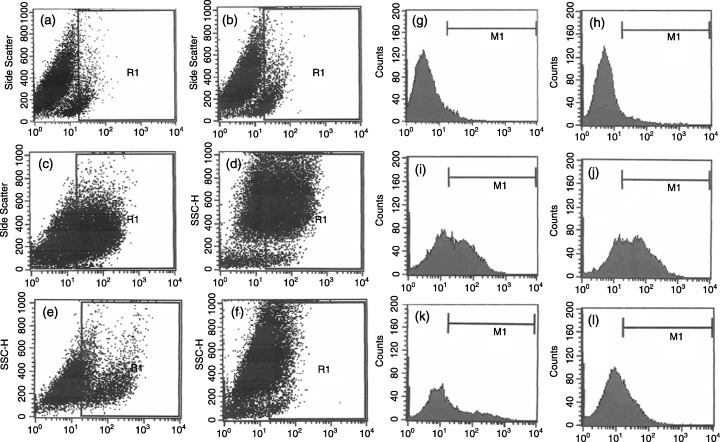
Immunophenotyping of NTERA‐2 cells by flow cytometry. Flow cytometric analysis showing NTERA‐2 cells immunoreactive to the cell surface antigens, by two‐dimensional dot plot and one dimensional histogram analysis, respectively. (a) and (g) mouse IgG was used as an isotype control, and (b) and (h) SSEA‐1 staining as negative control. Single cell suspension of NTERA‐2 cells were labelled with FITC‐coupled antibodies against (c) and (i) SSEA‐3 (53.19%); (d) and (j) SSEA‐4 (66.23%); (e) and (k) TRA‐1‐60 (32.94%); and (f) and (l) TRA‐1‐81 (28.48%). The percentage of cells positive for individual markers was obtained from the region statistics and histogram statistics performed by the FACS calibur flow cytometer with the help of Cell Quest software (Becton Dickinson); dot plot of SSC versus the antigen of interest (gated population) in R1 region; data are representative of three independent experiments (n = 3).
Sequential activation of the signalling molecules favours cell fate determination in NTERA‐2 cells
Furthermore, to evaluate the interactive role of a candidate set of signalling molecules at the different stages of NTERA‐2 differentiation, gene expression analysis by RT–PCR was carried out. Here we show gene expression of FGF‐8, IGF‐1, TGF‐beta1, BMP‐4, FGFR2, FGFR3, EGFR and beta‐catenin in the cell aggregates but not in undifferentiated cells (Fig. 4i). Thus, the proposed set of growth factors and their receptors that play an important role in normal embryonic development are also shown to become activated in human EC cell differentiation in vitro.
In vitro differentiation of NTERA‐2 into cells belonging to mesoderm and endoderm
Differentiational potential of NTERA‐2 cells into multiple phenotypes was further examined. Cell aggregates were induced to mesodermal and endodermal lineages employing suitable differentiation conditions. Essentially, we followed our protocol used in differentiation of mES cells (Pal & Khanna 2005) with slight modifications. During mesodermal differentiation, a gradual change in morphology of the cells was observed, leading to the formation of spindle to stellate shaped myocytes (Fig. 4e) from the 10th to the 15th day of differentiation. However, spontaneously contracting embryoid body outgrowths like human ES cells (Pal & Khanna 2006) were not detected. Immunostaining of these cells after 15 days of differentiation with myoglobin were immunofluorescent (Fig. 4f). For endodermal differentiation, cells were allowed to grow for a longer period. After 24–26 days of differentiation, the majority of the cells developed into an oval or polyhedral shape, some clearly being binucleate (Fig. 4g). Immunofluorescence analysis showed that these cells expressed HNF‐4alpha, an endodermal transcription factor (Fig. 4h). Although evaluated, the results of the differentiational potential of NTERA‐2 into neuroectodermal lineage is not shown here, as comprehensive reports on this are available elsewhere (Schwartz et al. 2005).
DISCUSSION
In this investigation, we have examined some crucial characteristics and attributes of an established TERA‐2 cell line, NTERA‐2 cL.D1. Our goal was to present an initial, in‐depth characterization of the cell line and demonstrate its utility as a viable adjunct to current methods of stem cell biology research.
A primary characteristic of these pluripotent stem cells is their ability to maintain their stemness for unlimited periods in vitro. Several markers are available that are characteristic of human pluripotent stem cells and these proved to be useful tools to monitor their undifferentiated phenotype. In our study, we have shown the expression of a set of important pluripotent markers including Oct‐4, Nanog, Rex‐1, Sox‐2, Cripto1, FGF‐4, Thy1, Utf1, ABCG2, Dppa5, hTERT and also the gap junction proteins connexin 43 and connexin 45 by RT–PCR (Fig. 1a and Table 3). These markers are exclusive to human ES and EC stem cells but are not expressed in the cells’ differentiated derivatives. Routine assessment of growing cultures of pluripotent stem cells can be readily achieved using immunofluorescence to detect the expression of cell‐surface antigens specific to human ES and EC cells, notably SSEA‐3, SSEA‐4. TRA‐1‐60 and TRA‐1‐81 (Andrews et al. 1996; Draper et al. 2002; Przyborski et al 2004). SSEA‐3, SSEA‐4, TRA‐1‐60, TRA‐1‐81, alkaline phosphatase, connexin 43 and E‐cadherin were strongly expressed in our cultures of NTERA‐2 cL.D1 (Fig. 1c–m), whereas decreased levels of these markers indicated in our study may be an implication of cellular differentiation (data not shown). These results are in accordance with our recent report on derivation and characterization of a human ES cell line, ReliCell®hES1 (Mandal et al. 2006).
Intriguingly, many but not all human EC stem cell lines retain the capacity to differentiate in vitro (Pera et al. 1989; Andrews et al. 1990; Thomson et al. 1998; Przyborski et al. 2001). Human ES cells are dependent on mouse embryonic fibroblast feeders to maintain their undifferentiated phenotype (Thomson et al. 1998), wherein cell density and confluence of the culture can influence the differentiation of the cells (1982, 1983). In contrast, NTERA‐2.cl.SP12 cells have been shown to respond to exogenous compounds like retinoic acid and hexamethylene bisacetamide, producing highly heterogenous and homogenous cultures of differentiated cells, respectively (Andrews et al. 1986). However, the addition of external stimuli is not always required to induce pluripotent stem cells to form further down‐stream phenotypes. Accordingly, we have been able to form cell aggregates of the NTERA‐2 cL.D1 cell line and we could maintain them up to 14 days in suspension culture without the application of any external stimuli to induce differentiation (Fig. 4a). Furthermore, we carried out comprehensive gene expression profiling of the cell aggregates at 0, 6, 10 and 14 days with a candidate set of genes implicated in early lineage development (Fig. 3). Differential pattern expression indicates that the expression of the lineage‐specific markers is a dynamic process and the changes in expression correlate with the different stages of differentiation. Hence, our data demonstrate the propensity of the NTERA‐2 cL.D1 cell line to give rise to cells belonging to all the three germ layers in vitro. Protein‐based studies further confirm the expression of lineage‐specific markers like nestin (ectoderm), smooth muscle actin (mesoderm) and GATA4 (endoderm) (Fig. 4b–d). Gradual up‐regulation of the markers associated with differentiation confirms the transition of these pluripotent stem cells to their differentiated phenotyes with progressive days of differentiation. Thus, it is conceivable that the commitment for differentiation in EC cells is initiated within the cell aggregates similar to embryoid bodies in ES cells. Although there are few reports on differentiation of human EC cells into lineages other than neuronal (Damjanov et al. 1994; Gokhale et al. 2000; Schwartz et al. 2005), we are the first to show the differentiation of NTERA‐2 cells into mesoderm and endoderm lineages (Fig. 4e–h). Thus, this can serve not only as an in vitro model in studying certain developmental aspects of human ES cells, but also in authenticating characterization data of newly derived human ES cell lines. However, there are a number of reports on the variability of the differentiation potential of human EC cell˙ lines like GCT‐27, NCCIT, NCR‐G3, NTERA‐2 cL.SP12 and NTERA‐2 cL.D1 (Hata et al. 1989; Pera et al. 1989; Damjanov et al. 1993; Roach et al. 1993). It is currently not clear why differences exist between different clonal lines, but it may be a consequence of their genetic instability or the methods by which they were derived.
Differentiation of stem cells and the formation of specific cell lineages follow highly regulated and tightly controlled transcription of multiple genes encoding structural and regulatory proteins. The fibroblast growth factors (FGF) and the transforming growth factor superfamily proteins (TGF‐beta) have been known to be key modulators of ES cell differentiation into specific lineages (Schuldiner et al. 2000). In Fig. 4(i), we show a detectable increase in the mRNA levels of FGF‐8, IGF‐1, TGF‐beta1 and BMP‐4 in the cell aggregates, in contrast to the undifferentiated EC cells, without exogenous application of any of these exemplary growth factors. Furthermore, the sequential activation of their receptors including FGFR2, FGFR3 and EGFR indicates an inductive role of these signalling molecules at various stages of NTERA‐2 differentiation. These results are in agreement with our earlier work on the interactive role of endoderm‐derived growth factors like BMPs and FGFs in cardiogenesis (Pal & Khanna. 2005), and the involvement of a Smad and Wnt dependent pathway (Pal & Khanna 2006). Likewise, we also show a marked increase in beta‐catenin gene expression in the NTERA‐2 cell aggregates. Based on these data, we speculate a constitutive activation of the Wnt signalling pathway in the human EC cells in coordination with the TGF‐beta and FGF signalling pathways, although further research is underway to consolidate this hypothesis.
Thus, using both molecular and immunological techniques, we have generated a foundation of attributes describing the NTERA‐2 cL.D1 cell line. Research models of early embryogenesis employing human EC cells may prove useful and viable. Despite their independent advantages and disadvantages, it is likely that both human EC and human ES cell systems will coexist to benefit experimental stem cell research.
ACKNOWLEDGEMENTS
The authors gratefully acknowledge the inputs of Dr Aparna Khanna provided through discussions and constructive criticisms. We thank Ms Arundhati Mandal for help in propagating NTERA‐2 cL.D1 cell line. We acknowledge Dr Mahendra S. Rao for critical reading of the manuscript. The authors gratefully acknowledge the encouragement and support of Reliance Life Sciences Pvt. Ltd in carrying out the research work.
Both the authors have contributed equally to this study.
REFERENCES
- Ackerman SL, Knowles BB, Andrews PW (1994) Gene regulation during neuronal and non‐neuronal differentiation of NTERA2 human teratocarcinoma‐derived stem cells. Brain Res. Mol. Brain Res. 25, 157–162. [DOI] [PubMed] [Google Scholar]
- Andrews PW, Goodfellow PN, Shevinsky LH, Bronson DL, Knowles BB (1982) Cell surface antigens of a clonal human carcinoma cell lines: morpholgical and antigenic differentiation in culture. Int. J. Cancer 29, 567–571. [DOI] [PubMed] [Google Scholar]
- Andrews PW, Goodfellow PN, Bronson DL (1983) Cell‐surface characteristics and other markers of differentiation o human teratocarcinoma cells in culture In: Teratocarcinoma Stem cells Monograph, 10 . Cold Spring Harbor, NY: Cold Spring Harbor Laboratory Press. [Google Scholar]
- Andrews PW, Damjanov I, Simon D, Banting GS, Carlin C, Dracopoli NC, Fogh J (1984) Pluripotent embryonal carcinoma clones derived from the human teratocarcinoma cell line Tera‐2: differentiation in vitro and in vivo . Lab. Invest 50, 147–162. [PubMed] [Google Scholar]
- Andrews PW, Gonczol E, Plotkin SA, Dignazio M, Oosterhuis JW (1986) Differentiation of Tera‐2 human embryonal carcinoma cells into neurons and HCMV permissive cells: induction by agents other than retinoic acid. Differentiation 31, 119–126. [DOI] [PubMed] [Google Scholar]
- Andrews PW, Nudelman E, Hakomori S, Fenderson BA (1990) Different patterns of glycolipid antigens are expressed following differentiation of TERA‐2 human embryonal carcinoma cells induced by retinoic acid, hexamethylene bisacetamide (HMBA) or bromodeoxyuridine (BUdR). Differentiation 143, 131–138. [DOI] [PubMed] [Google Scholar]
- Andrews PW, Casper J, Damjanov I, Duggan‐Keen M, Giwercman A, Hata J, Von Keitz A, Looijenga LH, Millan JL, Oosterhuis JW, Pera M, Sawada M, Schmoll HJ, Skakkebaek NE, Van Putten W, Stern P (1996) Comparative analysis of cell surface antigens expressed by cell lines derived from germ cell tumors. Int. J. Cancer 66, 806–816. [DOI] [PubMed] [Google Scholar]
- Andrews PW, Przyborski SA, Thomson JA (2001) Embryonal carcinoma cells as embryonic stem cells In: Stem Cell Biology Monograph, 40 Cold Spring Harbor, NY: Cold Spring Laboratory Press. [Google Scholar]
- Bhattacharya B, Miura T, Brandenberger R, Mejido J, Luo Y, Yang AX, Joshi BH, Ginis I, Thies RS, Amit M, Lyons I, Condie BG, Itskovitz‐Eldor J, Rao MS, Puri RK (2004) Gene expression in human embryonic stem cell lines: unique molecular signature. Blood 103, 2956–2964. [DOI] [PubMed] [Google Scholar]
- Brimble SN, Zeng X, Weiler DA, Luo Y, Liu Y, Lyons IG, Freed WJ, Robins AJ, Rao MS, Schulz TC (2004) Karyotypic stability, genotyping, differentiation, feeder‐free maintenance, and gene expression sampling in three human embryonic stem cell lines derived prior to August 9, 2001. Stem Cells Dev 13, 585–596. [DOI] [PubMed] [Google Scholar]
- Damjanov I, Horvat B, Gibas Z. (1993) Retinoic acid induced differentiation of the developmentally pluriotent human germ cell tumor‐derived cell line NCCIT. Lab. Invest 68, 220–232. [PubMed] [Google Scholar]
- Damjanov I, Zhu ZM, Andrews PW, Fenderson BA (1994) Embryonal carcinoma cells differentiate into parietal endoderm via an intermediate stage corresponding to primitive endoderm. In Vivo 8, 967–974. [PubMed] [Google Scholar]
- Dewji NN, Singer SJ (1997) Cell surface expression of the Alzheimer disease‐related presenilin proteins. Proc. Natl. Acad. Sci. USA 94, 926–931. [DOI] [PMC free article] [PubMed] [Google Scholar]
- Draper JS, Pigott C, Thomson JA, Andrews PW (2002) Surface antigens of human embryonic stem cells: changes upon differentiation in culture. J. Anat. 200, 249–258. [DOI] [PMC free article] [PubMed] [Google Scholar]
- Gokhale PJ, Giesberts AN, Andrews PW (2000) Brachyury is expressed by human teratocarcinoma cells in the absence of mesodermal differentiation. Cell Growth Differ. 11, 157–162. [PubMed] [Google Scholar]
- Hata J, Fujïta H, Ikeda E, Matsubayashi Y, Kokai Y, Fujimoto J (1989) [Differentiation of human germ cell tumor cells]. Hum. Cell 2, 382–387. [PubMed] [Google Scholar]
- Mandal A, Tipnis S, Pal R, Ravindram G, Bose B, Patki A, Rao MS, Khanna A (2006) Characterization and in vitro differentiation potential of a new human embryonic stem cell line, ReliCell®hES1. Differentiation 74, 81–90. [DOI] [PubMed] [Google Scholar]
- Martin GR (1981) Isolation of a pluripotent cell line from early mouse embryos cultured in medium conditioned by teratocarcinoma stem cells. Proc. Natl. Acad. Sci. USA 78, 7634–7638. [DOI] [PMC free article] [PubMed] [Google Scholar]
- Mitalipova M, Calhoun J, Shin S, Wininger D, Schulz T, Noggle S, Venable A, Lyons I, Robins A, Stice S (2003) Human embryonic stem cell lines derived from discarded embryos. Stem Cells 21, 521–526. [DOI] [PubMed] [Google Scholar]
- Pal R., Khanna A (2005) Role of hepatocyte‐like cells in the differentiation of cardiomyocytes from mouse ES cells. Stem Cells Dev. 14, 153–161. [DOI] [PubMed] [Google Scholar]
- Pal R., Khanna A (2006) A Smad and Wnt‐dependent pathway in embryonic cardiac development. Stem Cells Dev. 15, 29–39. [DOI] [PubMed] [Google Scholar]
- Paquet‐Durand F, Tan S, Bicker G (2003) Turning teratocarcinoma cells into neurons: rapid differentiation of NT‐2 cells in floating spheres. Brain Res. 142, 161–167. [DOI] [PubMed] [Google Scholar]
- Pera MJ, Cooper S, Mills J, Parrington JM (1989) Isolation and characterization of multipotent clone of human embryonal carcinoma‐cells. Differentiation 42, 10–23. [DOI] [PubMed] [Google Scholar]
- Pera MJ, Herzfeld D (1998) Differentiation of human pluripotent teratocarcinoma cells induced by bone morphogenetic protein‐2. Reprod. Fertil. Dev. 10, 551–555. [DOI] [PubMed] [Google Scholar]
- Przyborski SA (2001) Isolation of human embryonal carcinoma stem cells by immuno‐magnetic sorting. Stem Cells 19, 500–504. [DOI] [PubMed] [Google Scholar]
- Przyborski SA, Christie VB, Hayman MW, Stewart R, Horrocks GM (2004) Human embryonal carcinoma stem cells: models of embryonic development in humans. Stem Cells Dev 13, 400–408. [DOI] [PubMed] [Google Scholar]
- Reubinoff BE, Pera MF, Fong CY, Trounson A, Bongso A (2000) Embryonic stem cell lines from human blastocysts: somatic differentiation in vitro . Nat. Biotechnol. 18, 399–404. [DOI] [PubMed] [Google Scholar]
- Roach S, Cooper S, Bennett W, Pera MF (1993) Cultured cell lines from human teratocarcinomas‐Windows into tumor growth and differentiation and early development. Eur. Urol. 23, 82–88. [DOI] [PubMed] [Google Scholar]
- Schuldiner M, Yanuka O, Itskovitz‐Eldor J, Melton DA, Benvenisty N (2000) Effect of eight growth factors on the differentiation of cells derived from human embryonic stem cells. Proc. Natl. Acad. Sci. USA 97, 11307–11312. [DOI] [PMC free article] [PubMed] [Google Scholar]
- Schwartz CM, Spivak CE, Baker SC, McDaniel TK, Loring JF, Nguyen C, Chrest FJ, Wersto R, Arenas E, Zeng X, Freed WJ, Rao MS (2005) NTera2: a model system to study dopaminergic differentiation of human embryonic stem cells. Stem Cells Dev 14, 517–534. [DOI] [PubMed] [Google Scholar]
- Thomson JA, Itskovitz‐Eldor J, Shapiro SS, Waknitz MA, Swiergiel JJ, Marshall VS, Jones JM (1998) Embryonic stem cell lines derived from human blastocysts. Science 282, 1145–1147. [DOI] [PubMed] [Google Scholar]
- Zeng X, Miura T, Luo Y, Bhattacharya B, Condie B, Chen J, Ginis I, Lyons I, Mejido J, Puri RK, Rao MS, Freed WJ (2004b) Properties of pluripotent human embryonic stem cells BG01 and BG02. Stem Cells 22, 292–312. [DOI] [PubMed] [Google Scholar]