

Abstract
Abstract. The density‐dependent growth inhibition of non‐transformed cells may be associated with inefficient transduction of the proliferative signal from cell adhesion molecules. To verify this concept, the C3H10T1/2 fibroblasts were stably transfected with the gene coding for the fibronectin fragment III/10 (FNIII/10). This resulted in differences in gene's expression between original C3H10T1/2 cells and their FNIII/10 transfectants. No significant differences in growth properties were observed in the original or in the transfected cells. C3H10T1/2 cells and their transfectants, when co‐cultured, displayed more cells at confluence than the cells cultured alone. Moreover, co‐cultured C3H10T1/2 cells and their transfectants showed elevated levels of phospho‐ERK1/2 compared to homogenous cultures. Results obtained indicate that cellular homogeneity is responsible for density‐dependent growth inhibition.
INTRODUCTION
Cell proliferation is a strictly regulated process. Non‐transformed cells in tissue culture, upon reaching confluence, become quiescent as the result of a mechanism descriptively called contact inhibition (Abercrombie 1979). Moreover, the mechanism of growth arrest at the confluence has been found to be different in essence from that observed after serum withdrawal (Gos et al. 2005). Numerous speculations have been presented to explain the mechanism of contact inhibition. Some theories favour the hypothesis that when two cells are in close contact, one of them produces inhibitory factors passing through gap junctions from one cell to another (Bertram et al. 1982), even between neoplastic cells (Janik et al. 1980). According to the second group of theories, a proliferative signal during confluence becomes ineffective as the result of poor coordination between signals from growth factor receptor and signals from adhesion molecules (Ilićet al. 1997; St Croix et al. 1998; Viñals & Pouysségeur 1999).
Here, we will verify and extend the above concept of coordination between signals derived from growth factor receptors and cell adhesion molecules in relation to the mechanism of contact inhibition. As the culture medium contains serum growth factors, the inefficient signal from adhesion molecules seems to be essential for cells’ inhibition of growth. We hypothesize that when two or more identical non‐transformed cells get into close contact, their surfaces are not adhesive or attractive to each other. Thus, cells cannot generate signal/s in a way similar to a receptor ligand system, because they lack entities that attach them to each other and activate them to produce multilayered culture. Provisionally, we call this substance ‘glue’ (Janik & Miłoszewska 2002). It seems that ‘glue’ has to contain heterogeneous adhesive molecules that are able to activate cellular counterparts to proliferation, in the receptor ligand manner. Therefore, cells from a homogenous population cannot stimulate each other. On the contrary, individual tumour cells from a heterogeneous population have a cell surface attractive to their tumorous or normal counterparts that allows them generate specific signals to overcome density‐dependent growth inhibition. This mechanism might be similar to the self and non‐self recognition mechanism of the immunological system (Burnett 1975).
Extra‐cellular matrix components like fibronectin or its fragments that possess the ability to induce fibronectin to assemble with an integrin receptor are good candidates for modifying the cell surface (Sechler et al. 2001). In order to verify the hypothesis that a heterogeneous cell population may behave in a different way from a homogenous population, the non‐transformed C3H10T1/2 fibroblasts were transfected with a gene fragment coding for the fibronectin III/10 (FNIII/10) domain (Magnusson & Mosher 1998). Here, properties of the FNIII/10 transfectants alone or during co‐culture with their non‐transfected counterparts documents that even a small modification in fibronectin composition is sufficient to induce serious alternations in contact inhibition.
MATERIALS AND METHODS
Construction of the pSec FNIII/10 expression vector
cDNA encoding the fibronectin fragment that binds to cell adhesion sites, FNIII/10 (3183–3732 bp), was amplified from the mouse sarcoma L1 cell line (Janik et al. 1981). The following primers were used: F: 5′‐TTAAGCTTACAGGTTTACAGCCAGGC‐3′ and R: 5′‐TGAATTCCAAAGATCATTTGTTGCCCAACACT‐3′. FNIII/10 fibronectin gene fragment was cloned into the pSec expression plasmid (Invitrogen, Carlsbad, CA, USA) containing the CMV promoter, c‐myc/histidine tags and zeocin resistance gene, according to standard procedures. Sequencing analysis confirmed that the pSec plasmid carried FNIII/10 fragment of the fibronectin gene. The plasmid was propagated in Escherichia coli DH5α strain cultured in LB medium and isolated using Mega Endofree Kit (Qiagen, Germantown, MD, USA).
Cell cultures and transfection of C3H10T1/2 cells
C3H10T1/2 foetal mouse fibroblasts displaying density inhibition of growth were grown in DMEM supplied with 10% FCS (Reznikoff et al. 1973). The cells were transfected with plasmid pSecFNIII/10 (with the zeocin resistance gene) or pC (empty plasmid with neomycin resistant gene). Zeocin or neomycin resistant clones were selected by propagation in the presence of the appropriate antibiotic. Two stable transfected cell lines, pC/C3H10T1/2 and C3H10T1/2FNIII/10 (named FNIII/10), were used.
Gene expression analysis
Total RNA was extracted from the cells by the method of Chomczynski & Sacchi (1987), using TRIzol reagent. For detection of the cloned fibronectin FNIII/10 fragment, cDNA was prepared with Advantage RT‐PCR Kit (Clontech, BD, Franklin Lakes, NJ, USA). PCR amplification was conducted using the following primers: F: 5′‐TTAAGCTTACAGGTTTACAGCCAGGC‐3′ and R: 5′‐TTAAACTCAATGATGATG‐3′ specific for the fibronectin FNIII/10 fragment and terminated with the c‐myc/His tag. PCR products were analysed by electrophoresis.
For the cDNA array, polyA+ RNA was purified using Atlas™ Pure Total RNA Labelling System (Clontech, BD) and subjected to expression analysis with Atlas™ Mouse 1.2 Array (Clontech, BD) according to the manufacturer's protocol. Subsequently, hybridization arrays were exposed to a phosphor‐imaging screen (Molecular Dynamics, Palo Alto, CA, USA). The analysis of gene expression was performed with atlas image 3.2 software (Clontech, BD).
Growth of C3H10T1/2 cells and their transfectants
Twenty thousand of C3H10T1/2 cells or their FNIII/10 transfectants were seeded onto 60‐mm Petri dishes. On days 4, 6, 10 and 14 after seeding, the cells were trypsinized, washed and counted. For each point, cells from five dishes were counted and presented on a semilogarithmic scale as means ± SD.
Western blotting
C3H10T1/2 and C3H10T1/2FNIII/10 cells for phospho‐ERK1/2 assay were cultured in serum‐free medium for 24 h. For study of the cell‐to‐cell interaction, the co‐cultured cells were also kept in serum‐free medium for 24 h. Samples of 50 µg protein from cell cultures were loaded onto polyacrylamide gel. Proteins were tested with phospho‐ERK1/2 antibody (New England Biolabs, Ipswich, MA, USA). The specific bands were visualized by chemiluminescence (Amersham, Little Chalfont, UK).
Determination of zeocin or neomycin DNA in mixed cultures after 10 passages
The pC/C3H10T1/2 and C3H10T1/2FNIII/10 cell lines were used to assess any cell proliferation advantage. Cells were mixed in equal quantities of 10 000 cells for each line and were seeded on Petri dishes. Cultures were allowed to grow for 10 passages. Then the cells were collected and genomic DNA was extracted using SherlockAX Kit (A&A Biotechnology, Gdynia, Poland). Specific fragments were amplified with primers for the zeocin resistance gene, F: 5′‐ATGGCCAAGTTGACCAGT‐3′ and R: 5′‐CACGAAGTGCACGCAGTT‐3′, or for the neomycin resistance gene, F: 5′‐AGGCTATTCGGCTATG‐3′ and R: 5′‐TTCCACCATGATATTC‐3′. Specific PCR products for zeocin and neomycin confirmed that the cells carried either pC or pSecFNIII/10 plasmids.
Co‐culture of C3H10T1/2 with their FNIII/10 transfectants
The C3H10T1/2 cells were mixed with FNIII/10 transfectants (in the equal number of 10 000 cells) and seeded onto 60‐mm Petri dishes. At confluence on the 10th day after seeding the cells were trypsinized, washed and counted. As a control, 20 000 of C3H10T1/2 cells and FNIII/10 transfectants were seeded separately and processed as above. For cellular interaction analysis, C3H10T1/2 or their FNIII/10 transfectants were seeded onto Petri dishes and grown to confluence. About 50 000 non‐transfected C3H10T1/2 cells or FNIII/10 cells were seeded on a confluent layer of either C3H10T1/2 or FNIII/10 transfectants to create homo‐ or heterogenous populations. After 4 h, cells were collected for phosphoERK1/2 study as described in the ‘Western blotting’ section above.
RESULTS
Presence of the FNIII/10 fibronectin transcript
The c‐myc/histidine tag in the plasmid was designed to be recognized by a specific antibody (Invitrogen). However, we found that this antibody detected non‐specific proteins in C3H10T1/2 cells. Therefore, the results of the Western blotting assay seem indistinct. Thus, we performed RT‐PCR using primers flanking the FNIII/10 fragment, associated with the c‐myc/histidine sequence. The specific PCR product was found only in C3H10T1/2FNIII/10 transfectants and it was not detected in the original cell line (Fig. 1). We anticipated therefore that the FNIII/10 peptide is produced and secreted by the transfected cells, as the plasmid also contains secretory Igκ domain.
Figure 1.
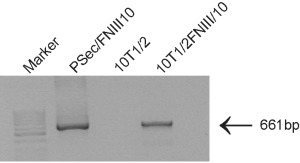
RT‐PCR determination of transcript of the FNIII/10 fibronectin fragment. Transcript contains FNIII/10 fibronectin fragment together with sequence encoding c‐myc/His tag. pSec/FNIII/10‐plasmid containing FNII/10; 10T1/2‐original 10T1/2 cells; 10T1/2FNIII/10‐transfectant with pSec/FNIII/10.
Growth curves of C3H10T1/2 cells and their FNIII/10 transfectants
C3H10T1/2 cells and their FNIII/10 transfectants proliferated at a similar pace in the early periods after seeding. Later, density inhibition of growth was observed in both studied cell lines. Original 10T1/2 cells displayed slightly higher level of saturation density than their transfectants. Transfected cell populations grew in similar way to their original counterparts (Fig. 2).
Figure 2.
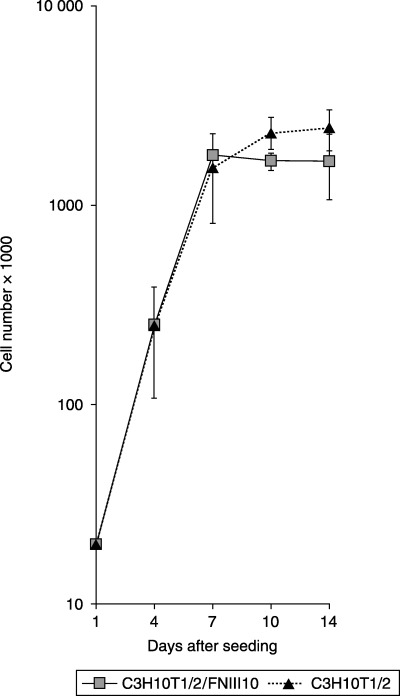
Growth curves of C3H10T1/2 cells and their FNIII/10 transfectants. Twenty thousand cells seeded onto Petri dishes. Cells were collected and counted on days 4, 7, 10 and 14 after seeding.
Expression analysis with cDNA array
The expression of 76 genes out of 1176 examined was altered in the C3H10T1/2 FNIII/10 transfectants as compared to the original C3H10T1/2 cell line. Here, only 14 genes with the highest difference in transcriptional activity are presented (Table 1). Elevated expression of genes encoding proteins involved in proliferation (proliferation associated protein 1, P55CDC, cell division protein kinase 4), cell cycle progression (G1/S specific cyclin D1) or apoptosis (inhibitor of apoptosis protein 3, defender against cell death, BAK1) was observed in FNIII/10 transfectants. Also, genes coding for adhesion proteins, for example Cek5 receptor protein tyrosine kinase ligand – characterized by two FNIII repeats on an extra‐cellular domain or myosin light subunit 1 atrial/foetal isoform – were overexpressed in transfected cells. The highest difference in transcription level was observed for the gene coding for ‘tubby protein associated with obesity’. Altogether, the expression analysis performed indicated that there was serious modification of activity in several genes after transfection with the fibronectin fragment.
Table 1.
Genes overexpressed in transfected cells a (cDNA array analysis)
| Protein/gene | Ratio 10T1/2FNIII/10 to 10T1/2 |
|---|---|
| Tubby | 62.0 |
| laminin receptor 1 (LAMR1) | 45.7 |
| Cek 5 receptor protein tyrosine kinase ligand | 22.5 |
| Transcription termination factor 1 (TTF1) | 19.9 |
| myosin light subunit 1 atrial/foetal isoform (MLC1A) | 12.6 |
| Bcl‐2 homologous antagonist/killer (BAK1) | 8.6 |
| nucleoside diphosphate kinase B (NDP kinase B) | 8.1 |
| inhibitor of apoptosis protein 3 | 7.3 |
| proliferation‐associated protein 1 (PLFAP) | 5.6 |
| p55CDC cell division cycle protein | 4.0 |
| Transcriptional coactivator of AML‐1 & LEF‐1 (ALY) | 3.7 |
| G1/S‐specific cyclin D1 | 3.6 |
| defender against cell death 1 (DAD1) | 3.2 |
most elevated expression levels.
Co‐culture of the original C3H10T1/2 cell line and transfectants
The presence of plasmid in transfected cells was verified by PCR, with primers specific for zeocin or neomycin resistance genes. Specific PCR products were present in primary cultures of mixed pC/C3H10T1/2 and FNIII/10 cells. The same markers were observed after 10 passages (Fig. 3). This finding indicates that none of the cell lines displayed proliferative advantage to eliminate their co‐cultured counterparts.
Figure 3.
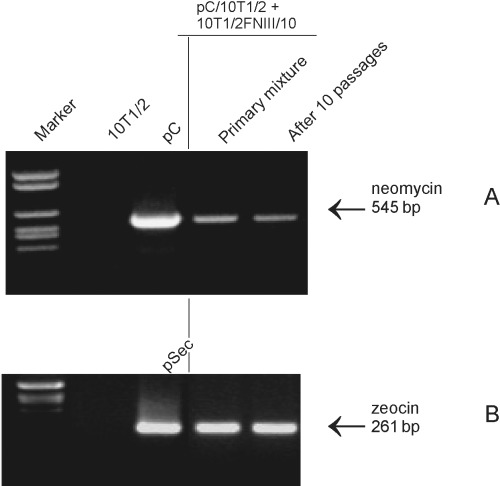
PCR determination of zeocin or neomycin resistance genes. C3H10T1/2FNIII/10 (zeocin‐resistant‐B) and pC/C3H10T1/2 (neomycin‐resistant‐A) cell lines were used. Mixtures of pC/C3H10T1/2 and C3H10T1/2FNIII/10 cells were propagated for 10 passages, then cells were collected for DNA extraction. PCR using primers specific for neomycin (A) or zeocin (B) resistance gene was performed on DNA from cells of primary mixtures and cell cultures for 10 passages.
Growth of mixed cell populations
The number of cells counted on Petri dishes at confluence on the 10th day after seeding of mixed cultures (10T1/2 and 10T1/2FNIII/10) exceeded the number of the 10T1/2 cells or their transfectants cultured separately for 10 days (Table 2). The difference between co‐cultured cells and FNIII/10 transfectants cultured separately was statistically significant. These results suggest that cells can overpass density inhibition of growth during heterogenous co‐culture.
Table 2.
Cells on Petri dishes, 10 days after seeding
| Cell lines | No. of cells × 103 |
|---|---|
| C3H10T1/2 | 2171 ± 451, n = 14 |
| C3H10T1/2FNIII/10 | 1549 ± 344, n = 12 |
| C3H10T1/2+C3H10T1/2FNIII/10 | 2466 ± 287, n = 15 |
C3H10T1/2 cells mixed with their FNIII/10 transfectants (10 000 of each) seeded onto Petri dishes. Ten days after seeding they were counted. Controls: 20 000 C3H10T1/2 and C3H10T1/2FNIII/10 cells seeded separately onto Petri dishes and also counted after 10 days. Mean value ± SD. Significant differences (Student's t‐test P≤ 0.01) between co‐cultured cells and C3H10T1/2 FNIII/10 propagated alone.
Stimulation of phospho‐ERK1/2 by cell‐to‐cell contact
Confluent 10T1/2 cells as well as their FNIII/10 transfectants kept for 24 h in serum‐free medium displayed a higher level of ERK1/2 phosphorylation than did sparse cells, despite higher presence of ERK1/2 proteins. In addition, higher ERK1/2 activity was observed in FNIII/10 confluent cells as compared to 10T1/2 also confluent cells (Fig. 4).
Figure 4.
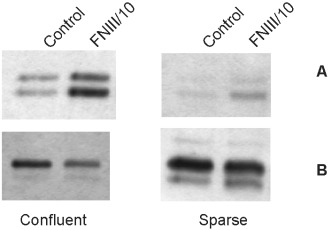
Phospho‐ERK1/2 and ERK1/2 protein levels in confluent and sparse C3H10T1/2 cells and their FNIII/10 transfectants. Whole cell lysates analysed by Western blotting. Bands corresponding to phospho‐ERK1/2 (A) and ERK1/2 (B) are shown.
Cell lines used throughout our study seemed to overpass density inhibition of growth when co‐cultured (Table 2). Therefore, an additional analysis of ERK1/2 activity was performed to determine whether heterogenous cells are able to stimulate each other. Around 50 000 of non‐transfected C3H10T1/2 cells or FNIII/10 cells were seeded on appropriate confluent monolayers. Co‐culture of heterogenous populations (C3H10T1/2 cells on FNIII/10 monolayer or FNIII/10 cells on 10T1/2 monolayer) significantly stimulated ERK1/2 activity. Such stimulation was weaker for homogenous cultures (Fig. 5). These results suggest that close cells’ contact stimulates ERK1/2 activity particularly in the case of heterogenous co‐cultivation.
Figure 5.
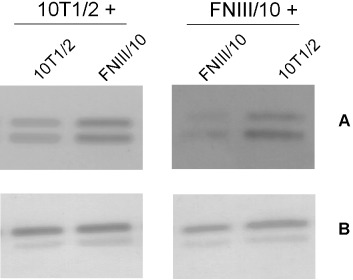
Phosho‐ERK1/2 (A) and ERK1/2 (B) protein levels; 50 000 C3H10T1/2 or FNIII/10 cells on confluent layer of C3H10T1/2 or FNIII/10 cells.
DISCUSSION
Transfection of C3H10T1/2 cells with the gene coding for fibronectin III/10 fragment – FNIII/10 – modified the pattern of gene expression as illustrated by cDNA array analysis. After transfection with the fibronectin fragment, cell surfaces can be modified by two alternative pathways. The first possibility is the temporary accumulation of the FNIII/10 fragment on the cell surface at the time of its secretion. Alternatively, modification of the cell surface could occur if the secreted soluble form of fibronectin should bind to integrins (Sechler et al. 2001; Hocking & Kowalski 2002). Regardless of the means of modification, the new cell line may differ from the parent line and its surface may have become more attractive than the original 10T1/2 counterparts or vice versa, gaining the ability to induce the proliferative signals during confluence. Some kind of ERK1/2 stimulation during confluence, as seen in 10T1/2 cells and in their transfectant (Fig. 4), may be induced by cell‐to‐cell contact. This activity can correlate with regenerative proliferation as described before (Gos et al. 2005).
In spite of some differences between the original line and its transfectants, growth curves showed that the two cell lines grew at the same rate during the logarithmic phase of population growth. Later, clear density‐dependent growth inhibition was observed in both cell lines.
Co‐culture of the original 10T1/2 cells with FNIII/10 transfectants showed that their numbers at the confluence were significantly higher than those obtained for 10T1/2 cells or their transfectants cultured separately (Table 2). This indicates that the same surface area of a culture dish may accommodate more co‐cultured cells than when propagated alone. A possible explanation for a higher number of co‐cultured cells as compared to original or transfected cells cultured alone is that the former may partially avoid density inhibition of growth. Perhaps modified cells become more adhesive in the mode of a glue and therefore attractive for its counterparts and vice versa. This variety of adhesion allows cells to proliferate and move one upon another. The experiment indicates that ERK1/2 was more highly activated by co‐culture of heterogenous cells in a mixture, than by homogenous cell populations. It cannot be excluded that during confluence, some cell adhesion molecules, for example Necl‐5, are down‐regulated following interaction with nectin‐3 as described by Fujito et al. (2005). Also nectin‐1, ‐2 and ‐3 show homophilic or heterophilic cell‐to‐cell adhesion activities depending on circumstances (Satoh‐Horikawa et al. 2000). It seems to be likely that heterogenous interactions prevent down‐regulation of Necl‐5.
Based on the presented results we advance the hypothesis that cell heterogeneity creates conditions that facilitate partial escape from density‐dependent inhibition of cell population growth as seen in tumour cell cultures. Reversing this hypothesis, it could be said that the mechanism of density‐dependent inhibition of growth is connected with homogeneity of cell population. The findings, if confirmed, may have significant practical implications, particularly in the treatment of some forms of cancer by restoring contact inhibition.
ACKNOWLEDGEMENTS
This study was supported by a Cancer Center internal funding grant.
REFERENCES
- Abercrombie M (1979) Contact inhibition and malignancy. Nature 281, 259. [DOI] [PubMed] [Google Scholar]
- Bertram JS, Bertram BB, Janik P (1982) Inhibition of neoplastic cell growth by quiescent cells is mediated by serum concentration and cAMP phosphodiesterase inhibitors. J. Cell. Biochem. 18, 515. [DOI] [PubMed] [Google Scholar]
- Burnett MF (1975) Immunological surveillance. Oxford: Pergamon Press. [Google Scholar]
- Chomczynski P, Sacchi N (1987) Single‐step method of RNA isolation by acid guanidium thiocyanate‐phenol‐chloroform extraction. Anal. Biochem. 162, 156. [DOI] [PubMed] [Google Scholar]
- Fujito T, Ikeda W, Kakunaga S, Minami Y, Kajita M, Sakamoto Y, Monden M, Takai Y (2005) Inhibition of cell movement and proliferation by cell‐cell contact‐induced interaction of Necl‐5 with nectin‐3. J. Cell Biol. 171, 165. [DOI] [PMC free article] [PubMed] [Google Scholar]
- Gos M, Miłoszewska J, Swoboda P, Trembacz H, Skierski J, Janik P (2005) Cellular quiescence induced by contact inhibition or serum withdrawal in C3H10T1/2 cells. Cell Prolif. 38, 107. [DOI] [PMC free article] [PubMed] [Google Scholar]
- Hocking DC, Kowalski K (2002) A cryptic fragment from fibronectin's III1 module localizes to lipid rafts and stimulates cell growth and contractility. J. Cell Biol. 158, 175. [DOI] [PMC free article] [PubMed] [Google Scholar]
- Iliæ D, Damsky CH, Yamamoto T (1997) Focal adhesion kinase: at the crossroads of signal transduction. J. Cell Sci. 110, 401. [DOI] [PubMed] [Google Scholar]
- Janik P, Assaf A, Bertram JS (1980) Inhibition of growth of primary and metastatic Lewis lung carcinoma cells by the phosphodiesterase inhibitor isobutylmethylxanthine. Cancer Res. 40, 1950. [PubMed] [Google Scholar]
- Janik P, Bertram JS, Szaniawska B (1981) Modulation of lung tumor colony formation by a subcutaneously growing tumor. J. Natl Cancer Inst. 66, 1155. [DOI] [PubMed] [Google Scholar]
- Janik P, Miłoszewska J (2002) On the nature of contact inhibition; glue theory. Nowotwory J. Oncol. 52, 73. [Google Scholar]
- Magnusson MK, Mosher DK (1998) Fibronectin: structure, assembly, and cardiovascular implications. Arterioscler. Thromb. Vasc. Biol. 18, 1363. [DOI] [PubMed] [Google Scholar]
- Reznikoff CA, Brankow DW, Heidelberger C (1973) Establishment and characterization of a cloned line of C3H mouse embryo cells sensitive to post‐confluence inhibition of division. Cancer Res. 33, 3231. [PubMed] [Google Scholar]
- Satoh‐Horikawa K, Nakamishi H, Takahashi K, Miyahara M, Nishimura M, Tachibama K, Mizoguchi A, Takai Y (2000) Nectin‐3, a new member of immunoglobulin‐like cell adhesion molecules that shows homophilic and heterophilic cell‐cell adhesion activities. J. Biol. Chem. 275, 10291. [DOI] [PubMed] [Google Scholar]
- Sechler J, Rao H, Cumiskey AM, Vega‐Colon I, Smith M, Murata T, Schwarzbauer J (2001) A novel fibronectin binding site required for fibronectin fibril growth during matrix assembly. J. Cell Biol. 154, 1081. [DOI] [PMC free article] [PubMed] [Google Scholar]
- St Croix B, Sheehan C, Rak JW, Florenes VA, Slingerland JM, Kerbel RS (1998) E‐Cadherin‐dependent growth suppression is mediated by the cyclin‐dependent kinase inhibitor p27 (KIP1). J. Cell Biol. 142, 557. [DOI] [PMC free article] [PubMed] [Google Scholar]
- Viñals F, Pouysségeur J (1999) Confluence of vascular endothelial cells induces cell cycle exit by inhibiting p42/p44 mitogen‐activated protein kinase activity. Mol. Cell. Biol. 19, 2763. [DOI] [PMC free article] [PubMed] [Google Scholar]