

Abstract
Abstract. Objectives: Based on studies of unicellular organisms or cultured mammalian cells, the generally accepted model of cell‐cycle regulation has been developed in which sequential (scheduled) expression of cyclins D, E, A and B and activation of Cdk2 and Cdk1 takes place. It is assumed that the same model is applicable both in vivo and in vitro. Materials and methods: In the present study, we compared proliferating marrow cells freshly isolated from healthy individuals with proliferating lymphocytes in cultures. Results: We demonstrate that during progression of freshly collected human bone marrow cells through G1, S and G2/M, only Cdk1 combined with cyclins A and B1 was distinctly present and active, and its activity gradually increased. In contrast, in vitro growing mitogen‐stimulated lymphocytes had perfectly scheduled sequential expression of all four cyclins and Cdk1 and Cdk2 activities. Conclusion: Our findings demonstrate that the pattern of cyclin expression and Cdk activity in bone marrow in vivo is distinctly different from the one observed for normal cells in vitro. Because proliferating bone marrow cells are predominantly expanding populations of committed progenitors, it is likely that during the expansion phase their cell‐cycle progression is pre‐programmed, being driven solely by Cdk1 combined either with cyclin A or with cyclin B1. Expansion of progenitor cells thus may not require the early steps of cell‐cycle regulation, associated with triggering progression by availability of growth factors and mitogens.
INTRODUCTION
The molecular machinery that drives the cell cycle has been well documented and is fundamentally conserved from unicellular eukaryotes, such as yeast, to mammals (Nurse 1990, 2000; Murray & Hunt 1993). The core of this machinery is a family of cyclin‐dependent protein kinases (Cdks) that consist of a catalytic component (the Cdk) and regulatory subunits named cyclins (as their levels fluctuate periodically throughout the cell cycle) (Murray & Hunt 1993). Distinct cyclin–Cdk complexes sequentially phosphorylate their respective substrates, thereby driving the cell through different phases of the cell cycle. According to our current understanding, vertebrate cells contain at least three essential classes of cyclin–Cdk complexes. These complexes include the D‐type cyclins (cyclins D1, D2 and D3), which activate Cdk4 and Cdk6 to execute critical regulatory events in G1 phase; the E‐type and A‐type cyclins, which activate Cdk2 to drive the cell through S phase, including DNA replication and centrosome duplication; and the A‐type cyclins (in a second role) and B‐type cyclins, which activate Cdk1 to direct structural and regulatory events in mitosis (Sherr 1996). Moreover, scheduled timing of expression of cyclins D, E, A and B1 in relation to the phases of the cell cycle can be reflected by a very characteristic pattern. In this ‘scheduled’ pattern, cyclin D is maximally expressed following mitogenic stimulation of G0 cells, and appears to decrease during exponential cell growth, but in many transformed cell tumour lines it remains high and invariable thorough the whole cell cycle (Matsushime et al. 1994). Cyclin E shows a periodic pattern of expression with accumulation in late G1 phase and down‐regulation in S phase (Koff et al. 1991) and cyclin A is maximal at the end of G2 and rapidly degraded in prometaphase (Pagano et al. 1992). Cyclin B1 begins accumulating at the time of late S phase, reaches maximal levels at G2/M transition, and breaks down in anaphase (Pines & Hunter 1991). It is widely accepted that such a pattern of cyclin expression operates both in vitro and in vivo. However, molecular mechanisms underpinning cell‐cycle progression mechanism of human normally proliferating cells has not been defined in vivo and studies on expression of cyclin–Cdk complexes in intact organs or tissues are scarce. A good example of cells in continuous proliferation is those of the bone marrow that can more easily be purely isolated than those of other tissue such as epithelial cells lining the digestive tract. All these cells have limited life spans, ranging from less than a day to a few months, and are continually produced by initial division of a common stem cell. Bone marrow cell preparations represent in vivo proliferating cells, and provide an experimental model that avoids potential artifacts related to cultured cell models such as mitogen‐stimulated normal lymphocytes. In the present study, in which we have compared proliferating bone marrow cells freshly isolated from healthy individuals, with proliferating lymphocytes in cultures, we provide evidence that the mechanism of cell‐cycle division in human proliferating bone marrow cells in vivo is not identical to that observed either in cultured cells, or as reported, in unicellular organisms.
MATERIALS AND METHODS
Cell isolation and culture
Normal human bone marrow cells (total 27 samples, which included two samples from healthy volunteers, 25 samples from rib surgery) were obtained with informed consent from the donors (including the two healthy volunteers) and were processed as described previously (Jordan et al. 2000; Guzman et al. 2001). All studies were performed according to protocols approved by the Tongji Hospital, Tongji Medical College, Huazhong University of Science and Technology, Wuhan, China. Samples were subjected to density‐gradient separation to deplete of red blood cells and granulocytes, and fresh bone marrow mononuclear cells (BMMNC) were isolated by density centrifugation (Ficoll‐Hypaque; Upjohn Pharmacia, Piscataway, NJ, USA).
For isolating lineage‐specific progenitor cells, fresh BMMNC were stained with CD45‐FITC monoclonal antibody (BD PharMingen, San Diego, CA, USA) for 20 min at 37 °C, and for isolation of side population cells, fresh BMMNCs were re‐suspended at 106 cells per ml in pre‐warmed Dulbecco's modified Eagle's medium containing 2% foetal calf serum (FCS), 1 mm 4‐(2‐hydroxyethyl)‐1‐piperazineethanesulfonic acid (HEPES), penicillin, streptomycin, and 5 µg/mL Hoechst 33342 (Sigma Chemical Co., St. Louis, MO, USA), and were incubated for 90 min at 37 °C.
Human peripheral blood lymphocytes (PBL), obtained from healthy volunteers by venipuncture, were isolated by density gradient centrifugation as described below. Cells were washed with buffered saline solution, re‐suspended in RPMI 1640 medium (Gibco, Grand Island, NY, USA) supplemented with 10% FCS, 100 units/mL penicillin, 100 µg/mL streptomycin, and 2 mm l‐glutamine, and cultured in the presence of 10 µg/mL of phytohehaemagglutinin (PHA; Sigama Chemical Co.). Interleukin 2 was administered to cultures 48 h after stimulation with PHA, and the cells were incubated for 3–4 days as described previously (Gong et al. 1995a). All media, supplements and sera were obtained from Gibco. MOLT‐4 cell lines were purchased from the American Type Culture Collection (Rockville, MD, USA) and maintained in RPMI 1640 containing 10% FCS. Cultures were passaged by dilution to cell concentration of 5.0 × 10⁵/mL, respectively, to maintain asynchronous, exponential growth.
Flow cytometry, cell sorting
Analysis and sorting of lineage‐specific progenitors, side population cells, and G1‐, S‐ and G2/M‐phase cells was performed on a dual‐laser FACSDiVa Option flow cytometer (Becton Dickinson, San Jose, CA, USA). For lineage‐specific progenitors, nucleate erythrocyte progenitors, granulocytes and lymphocytes were sorted based on CD45/SSC bivariate distribution. For side population cells, the Hoechst dye was excited at 350 nm and its fluorescence was measured at two wavelengths using a 450 BP 20 (450/20 nm band‐pass falter) and a 675 EFLP (675 nm long‐pass edge filter) optical filter (Omega Optical Inc., Brattleboro, VT, USA). A 610 DMSP (610 nm short‐pass dichroic mirror) was used to separate emission wavelengths. Both Hoechst blue and red fluorescence are shown on a linear scale. Side population sorting gates were established as described previously (Goodell et al. 1996).
For G1‐, S‐ and G2/M‐phase cells, BMMNC cells, MOLT‐4 cells and cultured peripheral lymphocytes were collected and stained with 4′,6‐diamidino‐2‐phenylindole in piperazine‐N,N′‐bis[2‐ethanesulfonic acid] disodium salt (PIPES) buffer (1 µg/mL). The sorting windows were selected to include the cells in G1, S and G2/M phase, respectively, based on DNA contents and distribution.
Cell‐cycle analysis
Cells were pelleted and re‐suspended in 1 mL of 0.1% sodium citrate containing 0.3% NP‐40, 0.0002 mg/mL RNase and 50 mg/mL propidium iodide, and were incubated for 30 min on ice. The profile of cells in the G0/G1, S and G2/M phases of the cell cycle were analysed on a FACSort with Cellquest (Becton Dickinson) and ModFit software (Verity Software House, Topsham, ME, USA).
Cyclins/DNA multiparameter assay
Cells harvested were fixed in ice‐cold 80% ethanol at –20 °C for at least 24 h. They were fixed overnight then washed in phosphate‐buffered saline (PBS) and permeabilized with 0.5% Triton X‐100 in PBS for 5 min on ice. After centrifugation, cells were incubated overnight in the presence of primary antibody to the respective to cyclin [BD PharMingen; diluted in PBS containing 1% bovine serum albumin (BSA), described as by Gong et al. 1995a]. Cells were then rinsed and incubated with the secondary FITC‐conjugated antibody (DAKO, Glostrup, Denmark; diluted in PBS containing 1% BSA) for 30 min. Then, cells were re‐suspended in propidium iodide solution (50 µg/mL propidium iodide), and incubated at room temperature for 30 min. Cell fluorescence was measured using a FACSVantage flow cytometer (Becton Dickinson).
For 5‐bromo‐2′‐deoxyuridine (BrdUrd) incorporation, cells maintained in RPMI 1640 medium with 10% FBS were treated for 1 h with 10 µm BrdUrd, then centrifuged and washed with PBS, then fixed for at least 30 min in cold 70% ethanol. They were removed from ethanol, re‐suspended in 1 mL of 1.5 M HC1 at 20 °C for 20 min, washed twice with 5 mL of PBS, and re‐suspended for 1 h in PBS solution containing 0.5% Tween‐20 (Sigma Chemical Co.), 0.5% BSA, and a 1 : 200 dilution of monoclonal anti‐BrdUrd. Cells were then rinsed and incubated with the secondary FITC‐conjugated antibody (DAKO; diluted in PBS containing 1% BSA) for 30 min. They were then re‐suspended in propidium iodide solution (50 µg/mL propidium iodide), and incubated at room temperature for 30 min. Cellular fluorescence was measured using the FACSVantage flow cytometer (Becton Dickinson).
Ki‐67/DNA multiparameter assay
The cells harvested were fixed in ice‐cold 80% ethanol at –20 °C for at least 24 h. Then, they were washed in PBS, and permeabilized with 0.5% Triton X‐100 in PBS for 5 min on ice. After centrifugation, cells were incubated overnight in the presence of primary antibody against Ki‐67 (BD Pharmingen; diluted in PBS containing 1% BSA), then they were rinsed and incubated with secondary FITC‐conjugated antibody (DAKO; diluted in PBS containing 1% BSA) for 30 min. Cells were then re‐suspended in propidium iodide solution (50 µg/mL propidium iodide), and incubated at room temperature for 30 min.
Western blotting
The cells were collected by centrifugation. Pellets were re‐suspended in lysis buffer (50 mm HEPES, pH 7.4, 250 mm NaCl, 2 mm ethyleneglycoltetraacetic acid, 2 mm ethylenediaminetetraacetic acid, 1 mm NaF, 0.1 mm vanadate, 0.1 mm phenylmethylsulphonyl fluoride, 2.5 mg/mL leupeptin and 1 mm dithiothreitol) and incubated on ice for 30 min. Insoluble components were determined. Proteins were resolved on sodium dodecyl sulfate‐polyacrylamide gels electrophoresis (SDS‐PAGE) and transferred to nitrocellulose membranes. Membranes were blocked in PBS plus 0.1% Tween‐20 containing 5% instant milk and were incubated with antibody in PBS plus 0.1% Tween‐20 for 1 h at room temperature. Proteins recognized by the antibody were detected by enhanced chemiluminescence using a horseradish peroxidase‐coupled secondary antibody as specified by the manufacturer. Following monoclonal and polyclonal primary and secondary antibodies, horseradish peroxidase‐conjugated antibodies were used. Cyclins D1, D2, D3, E, A and B1 (BD PharMingen); Cdks 1, 2, 4 and 6; Rb, p21, p16 and p27 (Santa Cruz Biotechnology Inc., Santa Cruz, CA, USA); and T161‐Cdk1, T15‐Cdk1 and T160‐Cdk2 (Cell Signalling, Beverly, MA, USA) were purchased.
Immunoprecipitation and immunoblotting
Immunoprecipitations were performed by incubating lysates with the relevant specific antibody (2 µg/reaction) for 4 h at 4 °C. Fifty microlitres of protein A‐Sepharose (Amersham Pharmacia, Buckinghamshire, UK) was added to the mixture, which was then further incubated for 12 h. Immune complexes were centrifuged at 10 000 g for 5 min and precipitates were washed three times with lysis buffer. The pellet was re‐suspended in 2× SDS sample buffer, boiled for 5 min, and centrifuged at 10 000 g for 5 min. The supernatant was collected and subjected to 12% SDS‐PAGE and proteins were transferred to polyvinylidene fluoride membranes. The presence of co‐immunoprecipitated protein was confirmed by Western blotting using the specific antibodies. Detection was performed by ECL system (Amersham Pharmacia).
Protein kinase assays
Precipitated immune complex was used for protein kinase assays. Reactions were performed with 25 µL kinase buffer, 50 mm Tris‐HCl (pH 8.0), 10 mmβ‐glycerophosphate, 1 mm dithiothreitol, 0.1 mm Na3VO4, 1 mm NaF, 10 mm MgCl2 containing 20 µm ATP, and 5 µCi of [γ‐32P]ATP plus 2 µg histone H1 (Upstate Biotechnology, Lake Placid, NY, USA) or recombinant GST‐Rb (Santa Cruz Biotechnology Inc.) at 30 °C for 30 min. Reactions were stopped by adding sample loading buffer and product was subjected to SDS‐PAGE. The gel was dried and subjected to autoradiography.
Analysis of confocal microscopy images
Cells were sorted directly on to microscope slides based on Cyclins/DNA multiparameter cytometry. Dabco in glycerol (1 : 4, total 4.0 µl) was then added before applying a glass coverslip and sealing with nail polish. For each fraction, at least 100 random cells were scored and detected by the TCS‐SP confocal microscope system (Leica Microsystems Inc., Buffalo, NY, USA).
RESULTS
Cell division cycle in human marrow cells
Bone marrow cells contain a high proportion of cycling progenitors in the basal state. In order to investigate cell‐cycle mechanisms in proliferating cells in vivo, we collected light‐density mononuclear cells, freshly isolated from human marrow (BMMNC) by density centrifugation. The first experiments were designed to reveal whether BMMNC actively proliferate and to compare their proliferation status, as measured by cell‐cycle phase distribution (cellular DNA content) (Fig. 1b), BrdUrd incorporation (Fig. 1c), and expression of the cell proliferation‐marker Ki‐67 antigen (Fig. 1d) with that of mitogenically stimulated PBLs proliferating in culture. It is evident from the presented data that the BMMNC had large proportion of proliferating cells with the DNA content of S‐phase cells, expressing Ki‐67 and incorporation BrdUrd. Because marrow contains haematopoietic stem cells and different lineages of progenitor cells that have the capacity of proliferation, self‐renewal and differentiation (Hodgson & Bradley 1984; Schwartz et al. 2003), we also assessed the proliferation markers in different lineages (Fig. 4a, see below). These data revealed that while the proportion of proliferating cells in these subpopulations (as well as in the whole marrow preparation) was lower than among cultured lymphocytes, a significant proportion of bone marrow cells demonstrated presence of the proliferation markers. Our findings were consistent with the observations of Thornley that human primitive progenitor/stem cells have slow replication rates (Thornley & Freedman 2002).
Figure 1.
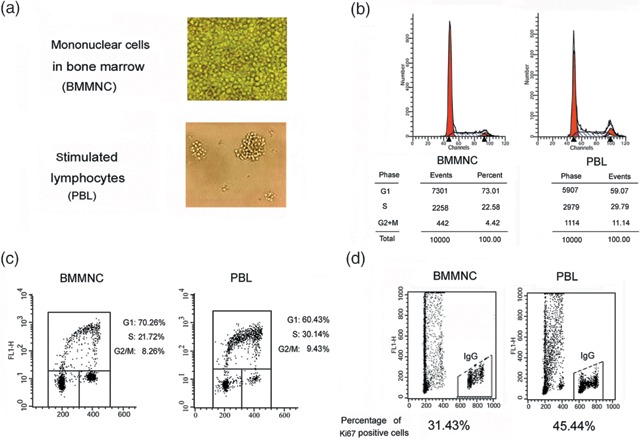
Proliferation status of freshly isolated bone marrow mononuclear cells (BMMNC) in vivo. (a) Morphology of BMMNC in vivo and PBL in vitro. Freshly isolated BMMNC from healthy volunteers were collected and photographed by light microscopy at once. PBL were isolated and cultured as described above in the Materials and Methods section, and were photographed by light microscopy; original magnification ×200. (b) Cell‐cycle distribution of freshly isolated BMMNC and asynchronously growing cultured PBL. DNA content was analysed by flow cytometry analysis of DNA content after staining with propidium iodide. (c) BMMC and PBL were pulsed with bromodeoxyuridine (BrdUrd) for 1 h and then stained with anti‐BrdUrd antibodies and with propidium iodide, followed by FACS analysis. Percentages of cells in particular phases of cell cycle are shown. (d) Expression of Ki‐67 antigen in freshly isolated BMMNC and exponentially cultured PBL. Cells were stained with anti‐Ki67 antibodies and with propidium iodide, followed by FACS analysis. Percentages of Ki‐67 positive cells are shown.
To further elucidate the molecular basis of cell proliferation in vivo, we prepared lysates from BMMNC that were freshly isolated from healthy individuals, and determined the levels of cyclins and Cdks in these samples. We found that compared to cultured PBL that expressed all four cyclins, BMMNC distinctly expressed cyclins A and B1 only; no cyclin D1 was detected, and the presence of cyclins D2 and D3 and cyclin E were barely revealed, presenting as a very low‐intensity band on the immunoblots. Levels of Cdk1, Cdk2 and Cdk6 were lower than those of cultured PBL, and we were unable to detect Cdk4 expression (Fig. 2a). We also examined the levels of Cdk inhibitors. Two families of Cdk inhibitors are known at present, one includes proteins belonging to the so‐called p16INK4A family (i.e. p16INK4A, p15INK4B, p18INK4C, p19INK4D), while the second, the p21CIP1 family contains p21CIP1, p27KIP1 and p57KIP2. The results showed that p21 and p16 essentially were not expressed in bone marrow cells; however, p27 remained at high levels (Fig. 2b). The absence of p16INK4A in both BMMNC and PBL suggests a noticeable tissue specificity for this Cdk inhibitor. Combination of decreased levels of cyclins and Cdks and increased levels of Cdk inhibitors (p27) likely explains the low proliferating ability of marrow cells, which are consistent with the findings of Della who reported that from early bone marrow precursor cells throughout the various differentiation pathways, the haematopoietic G1‐phase machinery is highly conserved, and only cyclin D3, Cdk6 and p27 can be detected (Della et al. 1997).
Figure 2.
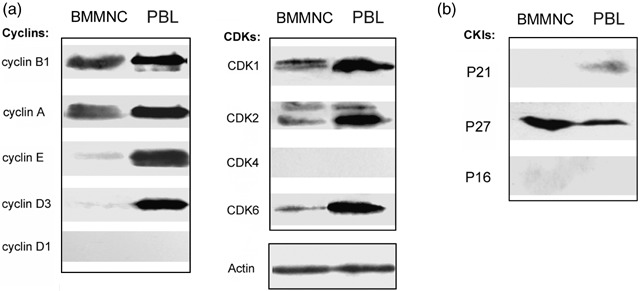
Molecular analysis of cell‐cycle regulators in bone marrow mononuclear cells (BMMNC). (a) Lysates prepared from freshly isolated BMMNC and exponentially cultured PBL were immunoblotted and probed with the indicated cyclins and Cdk antibodies. (b) Similar to (a). Immunoblots were probed with CKIs antibodies.
Cyclin expression during marrow cell‐cycle progression
In the next series of experiments, we evaluated the level of individual cyclins in relation to cell‐cycle phase. Because cell synchronization induces significant growth imbalance including unscheduled expression of cyclins (Gong et al. 1995a), instead of immunobloting cells synchronized in particular phases of the cell cycle, we used multiparameter flow cytometry, an approach that does not require cell synchronization as it allows one to measure cyclin expression in individual cells and correlate it with cellular DNA content, the parameter that reports cell‐cycle phase (Darzynkiewicz et al. 1996).
Our analysis has revealed that exponentially cultured PBL cells exhibited perfectly scheduled expression of cyclins D3, E, A and B1. MOLT‐4 cells, on the other hand, had high expression of cyclin D3 across all phases of the cell cycle, but the expression of cyclins E, A and B1 was identical as in the case of PBL (Gong et al. 1995b; Fig. 3a, left, middle). Unexpectedly, however, we found a distinctly different pattern of expression of these cyclins in BMMNC. Thus, cyclins D3 and E were almost undetectable in all cycle phases, whereas cyclins A and B1 were expressed not only in S‐ and G2/M‐phase cells but also in those with G1 DNA content (Fig. 3a, right). Such a pattern of cyclin expression, in which the G2 cyclins A and B1 are present in G1 cells, has been defined as ‘unscheduled’ (Darzynkiewicz et al. 1996). Protein levels of cyclin A and B1 were progressively elevated from G1, S to G2/M phase. To further confirm these observations, the post‐sorting Western blotting method (Shen et al. 2004) has been used. In this technique, based on differences in DNA content, cells in different phases of the cell cycle were sorted (Fig. 3b, top) and then specific proteins were analysed in the sorted cell populations by Western blotting. Our results obtained by post‐sorting were consistent with the flow cytometry data (Fig. 3b, bottom). These findings reveal that BMMNC exhibited expression of cyclins in an ‘unscheduled’ fashion specifically, and cyclins A and B1 were present in all phases of the cell cycle, with their levels progressively increasing throughout the cycle, while there was no evidence of expression of cyclins D3 and E in any phase.
Figure 3.
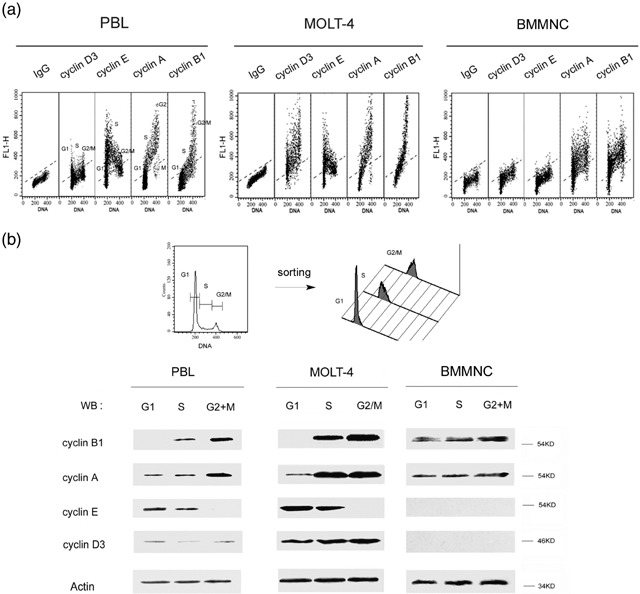
Analysis of cyclin expression in different cell‐cycle phases in bone marrow mononuclear cells (BMMNC). (a) Bivariate distribution of BMMNC and PBL cells’ DNA content versus expression of cyclins was detected by cyclin/DNA multiparameter cytometry. Asynchronously exponential PBL cells (left) display the ‘scheduled’ expression manner of G1 cyclins (D3, E) and G2 cyclins (A, B1). In contrast, BMMNC (right) presented a changed schedule: (i) expression of G1 cyclins (D3, E) could not be detected during relative cycle phases; and (ii) G2 cyclins (A, B1) had an ‘unscheduled’ expression manner. (b) Cultured PBL, MOLT‐4, and freshly isolated BMMNC cells were flow‐sorted into G1, S and G2/M phase groups based on DNA content. Cell lysates obtained from different cell cycle phases were immunoblotted and probed with the appropriate cyclin antibody by Western blotting.
Normal bone marrow contains different lineages of haematopoietic cells that include erythrocytes, granulocytes, macrophages and lymphocytes. Within each lineage, there are stem and progenitor cells but the large majority are proliferating cells of the expanding cell population. Based on CD45 immunophenotype, we sorted BMMNC into three different lineages (Fig. 4a, upper). Our data indicate that although there was a difference in proliferation rate within the lineages, as reflected by different percentage of S‐phase cells (Fig. 4a, upper), each lineage exhibited the same pattern of cyclin expression as samples of BMMNC (Fig. 4a, lower). Furthermore, adult human bone marrow contains a very low number of haematopoietic stem cells (HSC) that can divide and renew slowly. A novel procedure to isolate HSC has been described, by which staining with a fluorescent DNA‐binding dye, Hoechst 33342, side population cells can be identified (Goodell et al. 1996). Our results revealed that compared to BMMNC or lineage‐specific populations, purified side population cells contained fewer S and G2 phase cells, which would indicate low proliferation status of this cell population. However, while the overall levels of cyclins A and B1 detected in the HSCs, cell populations throughout the cell cycle were lower compared to BMMNC or the lineage‐specific proliferating populations, the schedule of cyclin expression was similar (Fig. 4b). Collectively, these findings indicate that the expression schedule of cyclins in human bone marrow cells is unlike the widely held view of their scheduled expression in normal cells.
Figure 4.
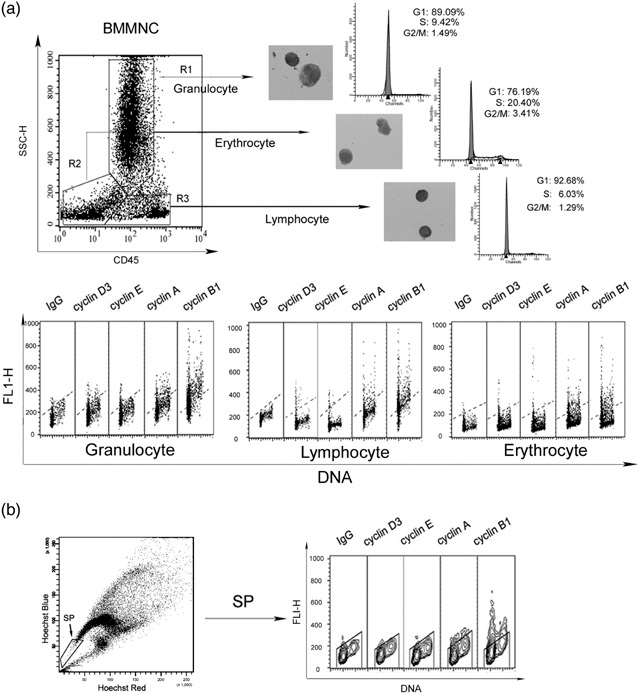
Analysis of cyclin schedule in different populations of bone marrow mononuclear cells (BMMNC). (a) Freshly isolated BMMNC were flow‐sorted into three groups as erythrocytes, granulocytes and lymphocytes based on CD45/SSC bivariate distribution. Cells were fixed in ethanol and then incubated with the appropriate cyclin antibody. Bivariate distribution of DNA content versus expression of cyclin was detected by cyclin/DNA multiparameter cytometry. (b) Freshly isolated side population cells in BMMNC were flow‐sorted, and were fixed in ethanol. Bivariate distribution of DNA content versus expression of cyclin was detected in the same manner as (a).
Next, we explored the subcellular distribution of cyclins A and B1, the only cyclins that were detected in bone marrow cells, in relation to cell‐cycle phase. It has been observed that during the somatic cell cycle in cultured cells, from S phase onwards cyclin A has predominantly nuclear localization while cyclin B1 accumulates in the cytoplasm during inter‐phase and enters the nucleus at the beginning of mitosis (Pines & Hunter 1991). In the present studies, we determined localization of these cyclins, identified immunocytochemically, by confocal microscopy. This was performed on the cells that were sorted in the respective phases of the cell cycle, based on differences in their DNA content. As expected, in exponential MOLT‐4 cultures, we observed that during S and G2 phases, cyclin A was localized in nuclei, and was essentially absent in mitotic cells (Fig. 5a, left). Cyclin B1 in MOLT‐4 cells, throughout S and G2 phases, accumulated outside nuclei, and during mitosis co‐localized with mitotic chromatin (Fig. 5b, left). In contrast, in BMMNC, we observed that cyclins A and B1 were expressed in the cytoplasm during G1 phase, and were distributed both in the cytoplasm and in nuclei in S phase. There were two patterns of cyclins A and B1 localization in cells with a G2/M DNA content. In some cells, these cyclins were strongly expressed and localized predominantly, but not exclusively in nuclei. In other cells, their expression was low and exclusively nuclear (Fig. 5a,b, right). Fluorescence intensity of cyclin A or B1 in cytoplasm and in nuclei was quantified by confocal microscopy. These observations, together with our previous findings, strongly suggested that the pattern of expression and subcellular localization of cyclins A and B1 in bone marrow cells was quite different compared to the cells studied in vitro.
Figure 5.
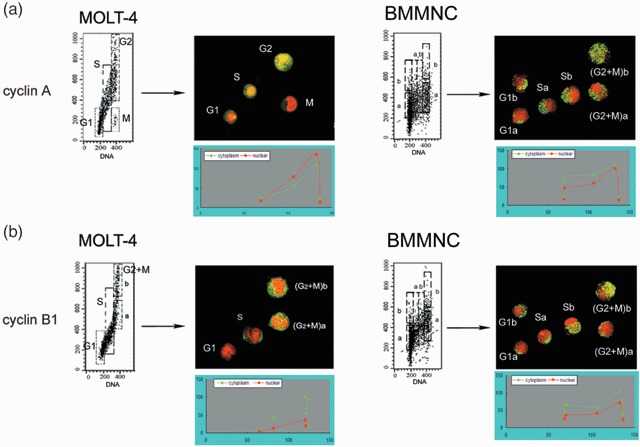
Subcellular localization of cyclins A and B1 during the bone marrow cell cycle. (a) G1, S and G2/M cells were flow‐sorted based on bivariate dot‐plot distribution of cyclin A versus DNA content, in exponential MOLT‐4 cultures (left) and BMMNC (right), then subcelluar localization of cyclin A was detected by confocal microscopy. Green fluorescence (FITC) indicates cyclin A staining, red fluorescence (PI) indicates nuclear staining. Cytoplasmic (green line) and nuclear (red line) localization of cyclin A was also quantified by confocal microscopy; scale bars, 10 µm. (b) Similar experiment as in (a). Subcelluar localization of cyclin B1 was detected and quantified by confocal microscopy.
Activation of Cdks during marrow cell‐cycle progression
Cyclin‐dependent protein kinases are responsible for progression through the cell cycle, and cyclins are the activating subunits that interact with specific Cdks to regulate their activity and substrate specificity. Therefore, we investigated the association between cyclins and Cdks in BMMNC. Our immunoprecipitation results indicated that during the cell cycle of bone marrow cells, Cdk1 combined with both cyclin A and cyclin B1 from G1, to S to G2/M phase. In S phase, Cdk1 was predominantly associated with cyclin A, while in G2/M phase it was mainly associated with cyclin B1. Only weak association of Cdk2 and cyclin E was detected in G1 phase, and no association of Cdk6 and cyclin D3 was detected (Fig. 6a). These results were also consistent with our earlier findings on cyclins’ schedule in bone marrow cells.
Figure 6.
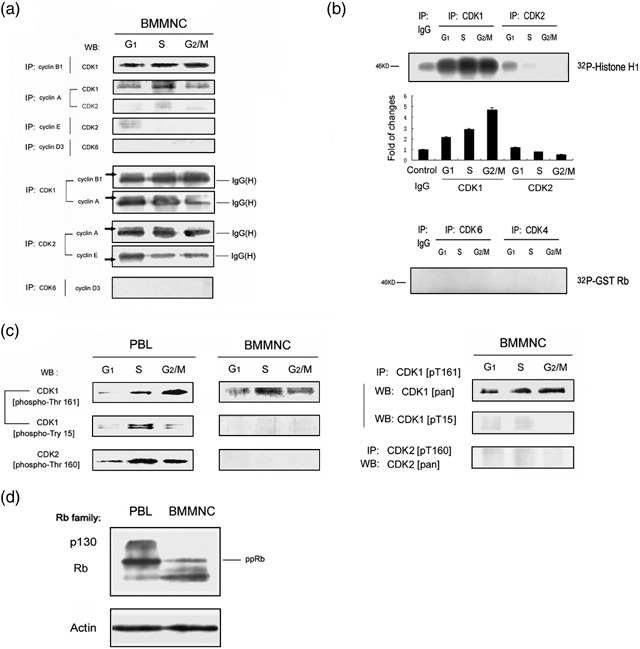
Activation of Cdk‐associated kinase during the bone marrow cell cycle. (a) Molecular analysis of cyclins association with Cdks within different cell‐cycle phases in BMMNC. Freshly isolated BMMNC were flow‐sorted based on DNA content and distribution. G1, S and G2/M phase cell lysates were prepared and immunopreciapitation (IP)–Western blotting (WB) analysis of cyclins and Cdks are shown. (b) Cdk‐associated kinase activity during different cell cycle phases in BMMNC. Freshly isolated BMMNC were flow‐sorted based on DNA content. G1, S and G2/M phase cell lysates were prepared. Cdks 1, 2, 4 and 6 were immunoprecipitated and activity to histone H1 or GST‐Rb was measured. (c) Molecular analysis of phosphorylation states of Cdk1‐ and Cdk2‐specific residues in BMMNC versus cultured PBL. G1, S and G2/M phase cells were flow‐sorted based on DNA content. Cell lysates were immunoblotted and probed with the appropriate anti‐CDK1[pT161] antibody, anti‐CDK1[pT15] antibody, and anti‐CDK2[pT160] antibody (left). BMMNC cell lysates from G1, S and G2/M phase cells were also immunoprecipitated with anti‐CDK1[pT161] or anti‐CDK2[pT160] antibody, then probed with anti‐CDK1[pan], anti‐CDK1[pT15] antibody or anti‐CDK2[pan] antibody (right). (d) Lysates prepared from freshly isolated BMMNC, and exponentially cultured PBL were immunoblotted and probed with Rb antibody.
The next experiments were focused on revealing activity of Cdks at different phases of the cell cycle. Surprisingly, we found that in the bone marrow cell cycle, Cdk1 is activated through G1, S and G2/M phases, with its activation gradually increasing. In contrast, Cdk2 had very low activity in G1 phase, and then diminished in S phase; Cdk4 and Cdk6 had no activity at all (Fig. 6b). It appears, thus, that in bone marrow cells Cdk1 alone is activated and drives the cell cycle. To further confirm these results, we assessed phosphorylation states at specific sites of Cdks. Here again, the cells sorted at particular phases of the cycle were used to assess Cdk phosphorylation. In cultured lymphocytes, activated Cdk1 was phosphorylated at threonine 161 and was dephosphorylated at the tyrosine 15 in S and G2/M phases; activated Cdk2 was phosphorylated at threonine 160 in S phase. In comparison, in BMMNC, threonine 161 of Cdk1 was phosphorylated, and tyrosine 15 of Cdk1 was dephosphorylated from G1, to S and G2/M phases (Fig. 6c). Together with kinase assay results, we concluded that Cdk1 was active and its activity was progressively increasing throughout the cell cycle of bone marrow cells while Cdk2 exhibited very low activity in G1 or S phase. The retinoblastoma protein (pRB) is the target of phosphorylation by Cdk4 or Cdk6 during cell‐cycle progression (Lundberg & Weinberg 1998). It was interesting, therefore, to test whether in bone marrow cells, in absence of any significant activity of these kinases, pRB would be fully phosphorylated or not. Our results indicated that fully phosphorylated pRB was clearly detectable in BMMNC, although phosphorylation was lower than that of pRB in cultured lymphocytes (Fig. 6d). It appears thus Cdk4 or Cdk6 kinase activation is not required for pRB phosphorylation.
DISCUSSION
Unusual pattern of cyclin–Cdks during the bone marrow cell cycle
Most studies on expression of cyclin–Cdk complexes in relation to cell‐cycle progression have been carried out in vitro, on cells synchronized by a variety of treatments, and analysed by Western blotting. It should be stressed that cell synchronization causes severe growth imbalance and induces significant artifacts in expression of cyclins resulting in their ‘unscheduled’ expression (Gong et al. 1995a). It also leads to DNA damage, as reflected by histone H2AX phosphorylation (Kurose et al. 2006). Analysis of individual, unperturbed cells, as offered by flow cytometry or sorted by flow cytometry and analysed by Western blotting, is therefore the only methodology that provides unbiased information on expression of cyclins in individual cells. Therefore, we have confidence to the present results that reveal that the cell cycle of bone marrow progenitors, in contrast to mitogen‐stimulated lymphocytes, does not require induction of cyclins D and E or activation of Cdk2.
What are the factors that may be responsible for the observed differences in the pattern of cyclin expression in bone marrow cells compared to in vitro proliferating lymphocytes? Because frequency of dividing stem cells in bone marrow is rather low the proliferating cells of bone marrow predominantly represent the expanding pool of committed precursor cells. These have a programmed definite number of cell divisions until they become terminally differentiated and exit the cell cycle. It is likely, thus, that the cell cycle of expanding progenitors is being driven only by Cdk1 sequentially activated by cyclins A and B. Such a mechanism, by controlling progression pre‐programmed for several consecutive cycles, is independent of availability of growth factors. Its advantage stems from the fact that the number of divisions is determined and may provide better control for maintaining homeostasis in terms of cell number. This is in contrast to stem cells which to enter the cycle may require the presence of specific factors. Likewise, as is presently shown, entrance of lymphocytes to the cell cycle was induced by the mitogen. In support of the above explanation, observations of this study suggest another conceivable scenario which concatenation of unperturbed mitotic cycles could be driven by Cdk1 alone associated to A‐ or B‐cyclins (Pacek et al., 2004). Thus, mice lacking individual D‐cyclins, cyclin E, Cdk4, Cdk6 or Cdk2 have been generated. Each of these strains is viable, which indicates that these established core regulators are dispensable for cell proliferation and mouse development (Humbert et al. 2004; Kozar & Sicinski 2005; Santamaria & Ortega 2006). Clearly, thus, the apparently normal, non‐tumour cells can proliferate in the absence of cyclins D and E, perhaps by activating the cell‐cycle drive pRB machinery using alterantives to Cdk2 protein kinases. Work is in progress in our laboratory to compare expression of cyclins and CDKs in marrow progenitors versus stem cells.
ACKNOWLEDGEMENTS
We thank Dr. Chaojiang Gu, Professor Chongyi Zhen (Wuhan University), and Dr. Shuangyou Liu for communicating unpublished data. This work was supported by grants from the National Science Foundation of China (No. 30440024, 30570908), the China State Key Basic Research Program (No. 2004CB518705) and the Science Foundation of Ministry of Health, China.
REFERENCES
- Darzynkiewicz Z, Gong J, Juan G, Ardelt B, Traganos F (1996) Cytometry of cyclin proteins. Cytometry 25, 1–13. [DOI] [PubMed] [Google Scholar]
- Della RF, Borriello A, Mastropietro S, Della PV, Monno F, Gabutti V, Locatelli F, Bonsi L, Bagnara GP, Iolascon A (1997) Expression of G1‐phase cell cycle genes during hematopoietic lineage. Biochem. Biophys. Res. Commun. 231, 73–76. [DOI] [PubMed] [Google Scholar]
- Gong J, Traganos F, Darzynkiewicz Z (1995a) Growth imbalance and altered expression of cyclins B1, A, E and D3 in MOLT‐4 cells synchronized in the cell cycle by inhibitors of DNA replication. Cell Growth Differ. 6, 1485–1493. [PubMed] [Google Scholar]
- Gong J, Bhatia U, Traganos F, Darzynkiewicz Z (1995b) Expression of cyclins A, D2 and D3 in individual normal mitogen stimulated lymphocytes and in MOLT‐4 leukemic cells analyzed by multiparameter flow cytometry. Leukemia 9, 893–899. [PubMed] [Google Scholar]
- Goodell MA, Brose K, Paradis G, Conner AS, Mulligan RC (1996) Isolation and functional properties of murine hematopoietic stem cells that are replicating in vivo . J. Exp. Med. 183, 1797–1806. [DOI] [PMC free article] [PubMed] [Google Scholar]
- Guzman ML, Neering SJ, Upchurch D, Grimes B, Howard DS, Rizzieri DA, Luger SM, Jordan CT (2001) NF‐kB is constitutively activated in primitive human acute myelogenous leukemia cells. Blood 98, 2301–2307. [DOI] [PubMed] [Google Scholar]
- Hodgson GS, Bradley TR (1984) In vivo kinetic status of hematopoietic stem and progenitor cells as inferred from labeling with bromodeoxyuridine. Exp. Hematol. 12, 683–687. [PubMed] [Google Scholar]
- Humbert PO, Brumby AM, Quinn LM, Richardson HE (2004) New tricks for old dogs: unexpected roles for cell cycle regulators revealed using animal models. Curr. Opin. Cell Biol. 16, 614–622. [DOI] [PubMed] [Google Scholar]
- Jordan CJ, Upchurch D, Szilvassy SJ, Guzman ML, Howard DS, Pettigrew AL (2000) The interleukin‐3 receptor alpha chain is a unique marker for human acute myelogenous leukemia stem cells. Leukemia 14, 1777–1784. [DOI] [PubMed] [Google Scholar]
- Koff A, Cross F, Fisher A, Schumacher J, Leguellec K, Philippe M, Roberts JM (1991) Human cyclin E, a new cyclin that interacts with two members of the CDC2 gene family. Cell 66, 1217–1228. [DOI] [PubMed] [Google Scholar]
- Kozar K, Sicinski P (2005) Cell cycle progression without cyclin D‐CDK4 and cyclin D‐CDK6 complexes. Cell Cycle 4, 388–391. [DOI] [PubMed] [Google Scholar]
- Kurose A, Tanaka T, Huang X, Traganos F, Darzynkiewicz Z (2006) Synchronization in the cell cycle by inhibitors of DNA replication induces histone H2AX phosphorylation, an indication of DNA damage. Cell Prolif. 39, 231–240. [DOI] [PMC free article] [PubMed] [Google Scholar]
- Lundberg AS, Weinberg RA (1998) Functional inactivation of the retinoblastoma protein requires sequential modification by at least two cyclin‐cdk complexes. Mol. Cell. Biol. 18, 753–761. [DOI] [PMC free article] [PubMed] [Google Scholar]
- Matsushime H, Quell DE, Shurtleff SA, Shibuya M, Sherr CJ, Kato JY (1994) D‐type cyclin‐dependent kinase activity in mammalian cells. Mol. Cell. Biol. 14, 2066–2076. [DOI] [PMC free article] [PubMed] [Google Scholar]
- Murray A, Hunt T (1993) The Cell Cycle: An Introduction. New York: Oxford University Press. [Google Scholar]
- Nurse P (1990) Universal control mechanism regulating onset of M‐phase. Nature 344, 503–508. [DOI] [PubMed] [Google Scholar]
- Nurse P (2000) A long twentieth century of cell cycle and beyond. Cell 100, 71–78. [DOI] [PubMed] [Google Scholar]
- Pacek M, Prokhorova TA, Walter JC (2004) Cdk1: Unsung hero of S phase? Cell Cycle 3, 401–403. [PubMed] [Google Scholar]
- Pagano M, Pepperkok R, Verde F, Ansorge W, Draetta G (1992) Cyclin A is required at two points in the human cell cycle. EMBO J. 11, 961–971. [DOI] [PMC free article] [PubMed] [Google Scholar]
- Pines J, Hunter T (1991) Human cyclins A and B1 are differentially located in the cell and undergo cell cycle‐dependent nuclear transport. J. Cell Biol. 115, 1–17. [DOI] [PMC free article] [PubMed] [Google Scholar]
- Santamaria D, Ortega S (2006) Cyclins and CDKS in development and cancer: lessons from genetically modified mice. Front. Biosci. 11, 1164–1188. [DOI] [PubMed] [Google Scholar]
- Schwartz GN, Vance BA, Levine BM, Fukazawa M, Telford WG, Cesar D, Hellerstein M, Gress RE (2003) Proliferation kinetics of subpopulations of human marrow cells determined by quantifying in vivo incorporation of [2H2]‐glucose into DNA of S‐phase cells. Blood 102, 2068–2073. [DOI] [PubMed] [Google Scholar]
- Shen M, Feng Y, Gao C, Tao D, Hu J, Reed E, Li QQ, Gong J (2004) Detection of cyclin B1 expression in G(1)‐phase cancer cell lines and cancer tissues by postsorting Western blot analysis. Cancer Res. 64, 1607–1610. [DOI] [PubMed] [Google Scholar]
- Sherr CJ (1996) Cancer cell cycles. Science 274, 1672–1677. [DOI] [PubMed] [Google Scholar]
- Thornley I, Freedman MH (2002) Telomeres, X‐inactivation ratios, and hematopoietic stem cell transplantation in humans: a review. Stem Cells 20, 198–204. [DOI] [PubMed] [Google Scholar]