

Abstract
Abstract. Atherosclerosis is an inflammatory‐fibroproliferative response of the arterial wall involving a complex set of interconnected events where cell proliferation (lymphomonocytes, and endothelial and smooth‐muscle cells) and substantial perturbations of intracellular cholesterol metabolism are considered to be among the main features. Glucose‐6‐phosphate dehydrogenase (G6PD), the key enzyme of the hexose‐monophosphate shunt pathway, is an essential enzyme involved in both cell growth and cholesterol metabolism, raising the question as to whether G6PD deficiency may have metabolic and growth implications in a deficient population. In the present study, we investigated cell growth and cholesterol metabolism in peripheral blood lymphomononuclear cells (PBMC) from G6PD‐normal (n = 5) and ‐deficient (n = 5) subjects stimulated with lectins (phytohaemoagglutinin and Concanavalin A). G6PD activity, DNA ([3H]‐thymidine incorporation) cholesterol synthesis and esterification ([14C]‐acetate and [14C]‐oleate incorporation), and G6PD, HMGCoA reductase and low density lipoprotein (LDL) receptor mRNA levels (RT‐PCR) all increased following lectin stimulation in both normal and G6PD‐deficient cells. However, these parameters were significantly lower in G6PD‐deficient cells (P < 0.05). It is of interest that G6PD‐deficient PBMC, which showed lower expression of G6PD and higher expression of the LDL receptor gene than normal PBMC under basal conditions, exhibited an opposite pattern after stimulation: G6PD and HMGCoA reductase being expressed at significantly higher levels in deficient than in normal cells (P < 0.05). We conclude that the reduced capability of G6PD‐deficient cells to respond to mitogenic stimuli and to synthesize cholesterol esters may represent favourable conditions for reducing the risk of cardiovascular diseases.
Introduction
Glucose‐6‐phosphate dehydrogenase (G6PD) deficiency is the most common enzymopathy, affecting approximately 400 million people world‐wide. Sardinia is one of the areas with the highest prevalence of G6PD deficiency (about 10% of the population). The most common variant, the G6PD Mediterranean, is characterized by an activity of < 10% of that of the fully functional enzyme and has a low Michaelis constant for the substrates glucose‐6‐phosphate (G6P) and NADPH+ in erythrocytes (Luzzatto & Mehta 1989; Vulliamy et al. 1992). Although the clinical manifestations of this variant are haemolysis and anaemia, such an inherited biochemical disorder has been detected in all nucleated cells, including peripheral blood lymphomononuclear cells (PBMC) (Muntoni et al. 1992; Kleztien et al. 1994).
G6PD catalyses the first step in the hexose‐monophosphate (HMP) shunt, providing ribose‐5‐phosphate for nucleic acid synthesis and reducing equivalents for reductive biosynthesis (cholesterol and fatty acid), all necessary for dividing cells. High G6PD activity accompanied by increased cholesterol synthesis and esterification has been repeatedly found in different models of normal and tumour cell proliferation (Evans et al. 1983; Dessìet al. 1984, 1985, 1986, 1988a). Moreover, high G6PD activity and gene expression, and elevated cholesterol content, mainly cholesteryl esters, were previously found not only in tumour tissues from G6PD‐normal subjects, but to a lesser extent also in those obtained from G6PD‐deficient patients with little or no activity in the surrounding normal tissues (Dessìet al. 1988b, 1990). We suggested that G6PD is required in cell proliferation to provide not only riboses for nucleic acid synthesis but also NADPH to sustain cholesterol biosynthesis. Since it is well known that intense cell proliferation and cholesterol synthesis and esterification play an important role during atherogenesis (Ross 1993, 1999), the question arises as to whether the condition of G6PD deficiency may affect the progression of atherosclerotic lesions.
To date, no studies have attempted to assess the possible metabolic implications of G6PD deficiency in the development of atherosclerotic lesions. Initially, the only cells thought to proliferate during expansion of atherosclerotic lesions were smooth‐muscle cells. More recent evidence, however, has shown that the earliest event following endothelium and/or plasmatic injuries is the activation and replication of both monocyte‐derived macrophages and lymphocytes (Ross 1999). In the present study, we therefore investigated G6PD activity, cholesterol metabolism, and G6PD, HMGCoA‐reductase and low density lipoprotein (LDL) receptor mRNA levels in resting and lectin‐stimulated PBMC from G6PD‐normal and ‐deficient subjects.
MATERIALS AND METHODS
[3H]‐thymidine (specific activity 247.9 GBq/mmol), [14C]‐acetic acid (specific activity 2.0 GBq/mmol) and [14C]‐oleic acid (specific activity 1.9 GBq/mmol) were obtained from Dupont, New England Nuclear (Boston, MA), while the Kiesegel TLC plates were from Merck (Darmstadt, Germany).
Lymphoprep was obtained from Nycomed Pharma (Oslo, Norway), and RPMI 1640, foetal calf serum and all tissue culture reagents were purchased from Mascia Brunelli (Milan, Italy). The primers were obtained from Perkin‐Elmer (Roche Molecular System, NJ). All chemicals were purchased from Sigma (St Louis, MO). The Ultima Gold scintillation fluid was obtained from Packard (Meridien, CT).
Subjects
Venous blood was obtained from healthy young adult males (five subjects G6PD‐deficient and five G6PD‐normal) aged between 23 and 35 years, who were taking no medication at the time of the study. Smokers and subjects with altered blood lipids were not included in this study. All G6PD‐deficient subjects studied were classified as G6PD Mediterranean on the basis of the severe enzyme deficiency detected in crude haemolysate and of biochemical characterization in accordance with the WHO classification (Betke et al. 1967).
Only males were included, since there are some heterozygous G6PD‐deficient females with normally or totally deficient phenotypes who cannot be classified with any certainty on the basis of enzymatic activity. This study was carried out in accordance with the declaration of Helsinki of the World Medical Association and was approved by the Ethical Committee of the University of Cagliari. Informed consent was obtained from all subjects.
Blood plasma, cells and culture conditions
Whole blood was collected in tubes containing EDTA; lymphomonuclear cells were separated on a lymphoprep gradient (density 1.077 g/ml), collected and purified as previously described (Ho et al. 1976). Purity for platelets, red cells and granulocytes was checked. An aliquot of blood was utilized for lipid determination.
Cells were cultured and grown in RPMI 1640 medium supplemented with 10% foetal calf serum at a concentration of 106/ml. After overnight resting, cells were stimulated with 5 µg/ml phytohaemoagglutinin (PHA) and, unless otherwise stated, harvested at 24, 48 and 72 h after stimulation. Cell viability, monitored by trypan blue dye exclusion, exceeded 98% in all experiments. At the times indicated cells were collected for assessment of G6PD activity, DNA and cholesterol synthesis and biochemical and molecular analysis.
Determination of plasma lipids
High density lipoprotein (HDL) cholesterol was measured in serum after the removal of very low density lipoprotein (VLDL) and LDL cholesterol with the magnesum‐phosphotungstate reagent. Reagents for total and HDL cholesterol and triglycerides were obtained commercially (Boehringer, Mannhein, Germany).
DNA synthesis
At the times indicated, cells were incubated in triplicate for 2 h with 185 kBq/ml of 3H‐thymidine. At the end of the incubation period, cells were rinsed with ice‐cold phosphate‐buffered saline (PBS), washed with 5% cold trichloroacetic acid (TCA) and hydrolysed with 1 m NaOH. The radioactivity was measured by a Beckman β counter (Palo Alto, CA) using Ultima Gold as the scintillation fluid. An aliquot of cell hydrolysate was processed for protein content (Lowry et al. 1951).
Cholesterol synthesis
To determine the rate of cholesterol synthesis the cells were incubated for 3 h with 185 kBq/ml of sodium [14C]‐acetate. After incubation, cells were separated by centrifugation and collected. Cell lipids were extracted with ice‐cold acetone and neutral lipids separated by thin layer chromatography (TLC) on Kiesegel plates using a solvent system containing n‐heptane/isopropylether/formic acid (60 : 40 : 2 by volume). Free cholesterol and cholesterol ester standards were run simultaneously and the bands were visualized using iodine vapours. For counting purpose, the bands were excised and added directly to the counting vials containing 10 ml of Ultima Gold. All incubations were carried out in triplicate and the results of individual experiments are reported as mean values. All data are expressed as the rate of [14C]‐acetate incorporated into cholesterol per µg protein.
Efflux of endogenous synthesized cholesterol
Cells were incubated for 3 h with [14C]‐acetate as described above. After incubation, media were collected, lipids were extracted with chloroform : methanol (2 : 1 by volume) according to Folch et al. (1957) and neutral lipids were separated as described above. Efflux of endogenously synthesized cholesterol was expressed as the percentage of total [14C]‐acetate labelled cholesterol (cell plus medium) recovered from the medium.
Cholesterol esterification
Cells were incubated for 6 h in medium containing [14C]‐oleate bound to bovine serum albumin (BSA). To prepare the oleate–BSA complex, 3.7 MBq of [14C]‐oleic acid in ethanol (NEN Life Science Products, MA, USA; specific activity 2.035 GBq/mmol, Life Science Products, Boston, MA) was mixed with 1.4 mg KOH and the ethanol evaporated. PBS (1.5 ml) without Ca2+ and Mg+ containing 4.24 mg bovine serum albumin (BSA) (fatty acid‐free, Sigma) was added and the mixture shaken vigorously. This solution was added to each well at a final concentration of 74 KBq/ml. After incubation, cells were washed with PBS and lipids extracted with acetone. Neutral lipids were separated by TLC as described and incorporation of [14C]‐oleate into cholesterol esters was measured.
G6PD activity
G6PD activity of red cells from normal and G6PD‐deficient subjects was determined according to the method of Glock & McLean (1953). White cells were lysed using a solution containing 15 m NADP, 2.7 m EDTA and triton X100 (0.5 g/l) and by freezing‐thawing the cells twice. The generation of NADPH was recorded spectrophotometrically at 340 nm at 37 °C. Enzyme activity was expressed as nmol NADPH generated per min per µg protein.
RNA isolation and reverse transcriptase‐polymerase chain reaction (RT‐PCR)
Total RNA was isolated from cultured cells by the guanidine isothiocyanate phenol‐chloroform extraction method (Chomczynsky & Sacchi 1987). The RNA concentration was measured spectrophotometrically at 260 nm, and the 260/280 ratio was calculated to check for protein contamination. Equal amounts of total RNA (1 µg) were reverse transcribed into cDNA. cDNA was subsequently amplified by the polymerase chain reaction (PCR) in the presence of specific primers according to the instructions provided by the manufacturer (gene Amp RNA, PCR Kit, Perkin‐Elmer Cetus, Milan, Italy). Primers, step cycles and expected length of the amplification products used in this study are summarized in Table 1.
Table 1.
Primer sequences and size of RT‐PCR products
| Gene | Primers RT‐PCR | RT‐PCR protocol | Size of RT‐PCR products (number of cycles) |
|---|---|---|---|
| HMG‐CoA | 5′TACCATGTCAGGGGTACGTC 3′ | 95 °C, 60 s/60 °C, 45 s/ | 246 |
| reductase | 5′CAAGCCTAGAGACATAATCATC 3′ | 72 °C, 45 s (35) | |
| LDL receptor | 5′CAATGTCTCACCAAGCTCTG 3′ | 95 °C, 60 s/60 °C, 45 s/ | 258 |
| 5′TCTGTCTCGAGGGGTACCTG 3′ | 72 °C, 45 s (35) | ||
| G6PD | 5′CTGGAACCGCATCATCGTG 3′ | 94 °C, 50 s/60 °C, 50 s/ | 916 |
| 5′TTCTCATCACGGACGTCATCT 3′ | 68 °C, 90 s (25) | ||
| L7 | 5′CCTGAGGAAGAAGTTTGCCC 3′ | 95 °C, 30 s/60 °C, 60 s/ | 286 |
| 5′CTTGTTGAGCTTCACAAAGGTGCC 3′ | 72 °C, 60 s (25) |
Preliminary experiments demonstrated that the RT‐PCR conditions were within a linear range of amplification of gene fragments. Under conditions reported in Table 1, PCR products, separated on agarose and stained with ethidium bromide, showed a major band of the predicted size (data not shown). During PCR reaction the non‐radioactive label Digoxigenin‐11‐dUTP (DIG) (Boheringer, Mannheim, Germany) was incorporated, and the DNA fragments (Powel & Kroon 1992), separated by electrophoresis in agarose, were blotted onto a nylon membrane for 16 h in 10 × SSC. The blot was exposed to X‐ray film (Kodak X‐OMAT, Sigma, Milan, Italy) for 2–10 min. The intensity of the bands was assessed by a Kodak Digital BandScanner Image Analysis System containing HP ScanJet. The overall procedure was further standardized by expressing the amount of PCR product formed for L7, a ribosomal protein which is encoded by a non‐inducible cell cycle‐independent gene (Hemmerich et al. 1993). Since a low yield of PCR products was often obtained when cDNA segments were coamplified with an internal standard gene in the same tube, the relative levels of gene expression have therefore been determined by comparing the PCR products of the target cDNA and L7 gene in separate tubes. The target gene/L7 ratio was taken to represent the relative expression of the genes studied.
Statistical analysis
Significant differences were determined by a two‐way analysis of variance (anova) for repeated measures (time) followed by Student’s t‐test where appropriate. Differences were considered significant if P < 0.05.
RESULTS
Plasma lipids and G6PD activity in G6PD‐normal and ‐deficient PBMC
In accordance with results previously obtained by our group (Muntoni et al. 1992), in G6PD‐deficient males the serum levels of total cholesterol were lower in G6PD‐deficient than G6PD‐normal subjects (P < 0.05), and HDL cholesterol levels and triglycerides did not differ significantly between the two groups (Table 2).
Table 2.
Total cholesterol, HDL cholesterol and triglycerides in G6PD‐normal and ‐deficient subjects
| Subject† | Total cholesterol (mg/dl) | HDL cholesterol (mg/dl) | Triglycerides (mg/dl) |
|---|---|---|---|
| G6PD‐normal | |||
| A.L. | 197 | 44 | 115 |
| B.N. | 207 | 50 | 118 |
| A.S. | 210 | 45 | 149 |
| P.S. | 187 | 48 | 85 |
| G.C. | 190 | 47 | 135 |
| Mean ± SD | 200 ± 10.31* | 46.8 ± 2.38 | 120.4 ± 10.7 |
| G6PD‐deficient | |||
| G.D. | 168 | 47 | 132 |
| P.C. | 150 | 38 | 120 |
| L.C. | 166 | 43 | 81 |
| M.D. | 156 | 43 | 99 |
| E.E. | 172 | 45 | 129 |
| Mean ± SD | 162 ± 9 | 43.6 ± 2.61 | 112.2 ± 21.7 |
P < 0.05 vs. G6PD‐deficient subjects.
Subjects are indicated by their initials.
All G6PD‐deficient subjects evaluated in this study were classified as G6PD Mediterranean on the basis of the severe enzyme deficiency detected in crude haemolysate and of biochemical characterization in accordance with the WHO classification (Betke et al. 1967). G6PD activities in red cells of the G6PD‐deficient subjects ranged between 0 and 10% of normal values. Two subjects had ‘0’ activity when tested in crude lysate, but measurable activity was invariably detected when partially purified enzyme was tested (data not shown). Figure 1 shows G6PD activities in untreated (0 h) and PHA‐treated PBMC (24, 48 and 72 h) from normal and G6PD‐deficient subjects. G6PD activity of quiescent cells from G6PD‐deficient subjects was approximately 10% that of cells obtained from G6PD‐normal males. These data confirm previous results concerning the presence of severe G6PD deficiency also in nucleated cells. Following PHA stimulation the enzyme activity increased in both normal and deficient cells. In spite of the fact that enzyme activity was characterized by a considerably increased stimulation in G6PD deficiency, the levels were markedly lower than in G6PD‐normal cells, at all time points considered (P < 0.001).
Figure 1.
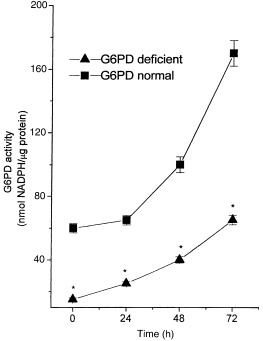
G6PD activity in PBMC from G6PD‐normal and ‐deficient subjects. Freshly isolated PBMC from G6PD‐normal and ‐deficient subjects were cultured at a concentration of 1 × 10⁶ cells/ml in RPMI medium supplemented with 10% FCS and incubated for 24, 48 and 72 h with PHA (5 µg/ml). 0 h indicates the time prior to PHA addition. Each value represents mean ± SD of five separate experiments. G6PD‐deficient cells showed a significant difference (*P < 0.001) compared with normal G6PD at all times studied.
[3H]‐incorporation into DNA in G6PD‐normal and ‐deficient PBMC
Figure 2 shows 3H‐thymidine incorporation into DNA in G6PD‐normal and ‐deficient cells after PHA stimulation. DNA synthesis increased steadily up to 72 h, in both normal and G6PD‐deficient cells, but values were significantly lower in G6PD‐deficient than in normal cells. In all five experiments, DNA synthesis in G6PD‐normal cells was invariably at least 40% higher than in G6PD‐deficient cells (P < 0.05).
Figure 2.
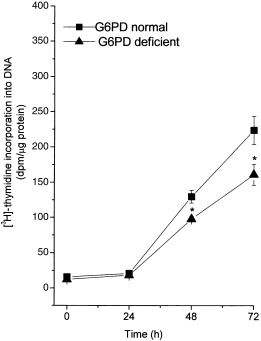
[H3]‐thymidine incorporation in PBMC from G6PD‐normal and ‐deficient subjects. Freshly isolated PBMC from G6PD‐normal and ‐deficient subjects were cultured and grown as described in the legend to Fig. 1. Cells were labelled with [3H]‐thymidine 2 h before the indicated times. The incorporation of [3H]‐thymidine into DNA was determined as described in Materials and Methods. Each value represents mean ± SD of five sepatate experiments. G6PD‐deficient cells showed a significant difference (*P < 0.05) compared with normal G6PD at 48 and 72 h.
Cholesterol metabolism
Mitogenic stimulation caused a marked increase in the rate of [14C]‐acetate incorporation into cholesterol; the increase was already evident after 24 h of incubation and increased up to 72 h. Although [14C]‐acetate incorporation increased in both free and esterified cholesterol (Fig. 3), the rate of sterol synthesis was invariably significantly lower in G6PD‐deficient than in normal cells; this difference persisted for all experimental time‐points. Cholesterol efflux following mitogenic stimulus was markedly reduced in both G6PD‐normal and ‐deficient cells (Fig. 4). Cellular cholesterol ester synthesis, measured by exposing cells to a medium containing [14C]‐oleate–BSA complex for 6 h, was consistently significantly lower in G6PD‐deficient than in normal cells (P < 0.05) (Fig. 5).
Figure 3.
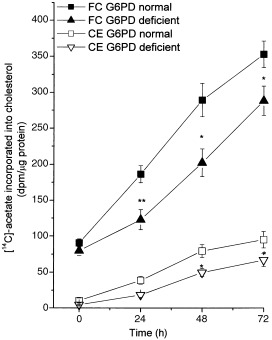
Cholesterol synthesis in PBMC from G6PD‐normal and ‐deficient subjects. Cells were cultured and grown as described in the legend to Fig. 1. Three hours before the indicated times, cells were labelled with [14C]‐acetate and incorporation of labelled acetate into free (FC) and esterified cholesterol (EC) was determined as described in the Materials and Methods section. Each value represents mean ± SD of five separate experiments. G6PD‐deficient cells at all times showed a significant difference (*P < 0.001) compared with normal G6PD.
Figure 4.

Cholesterol efflux in PBMC from G6PD normal and deficient subjects. Cells were cultured and grown as described in the legend to Fig. 1. Three hours before the indicated times, cells were labelled with [14C]‐acetate and [14C]‐cholesterol recovered from the media as described in Materials and Methods. Efflux of endogenously synthesized cholesterol was expressed as the percentage of total [14C]‐acetate labelled cholesterol (cells plus medium) recovered from the medium. Each value represents the mean ± SD of five separate experiments. Stimulated cells showed a significant difference (*P < 0.001) compared with time 0.
Figure 5.

Cholesterol esterification in PBMC from G6PD‐normal and ‐deficient subjects. Cells were cultured and grown as described in the legend to Fig. 1. The [14C]‐oleate was added to the culture medium for 6 h and cells harvested at the times indicated. [14C]‐oleate incorporation into esterified cholesterol was determined as described in Materials and Methods. Each value represents the mean ± SD of five separate experiments. G6PD‐deficient cells at all times showed a significant difference (**P < 0.001) compared with normal G6PD.
Gene expression of HMGCoA reductase, LDL receptors and G6PD
To determine whether biochemical differences observed between G6PD‐deficient and normal cells are associated with differences at molecular levels, we subsequently compared gene expression of G6PD and HMGCoA reductase and LDL receptor levels in PHA‐unstimulated and stimulated PBMC. As shown in Fig. 6, the mRNA levels of G6PD genes were lower in untreated cells from G6PD‐deficient than from G6PD‐normal subjects; conversely, G6PD‐deficient cells showed higher expression of the LDL receptor gene. These results are in agreement with the lower cholesterolemia found in G6PD‐deficient subjects.
Figure 6.
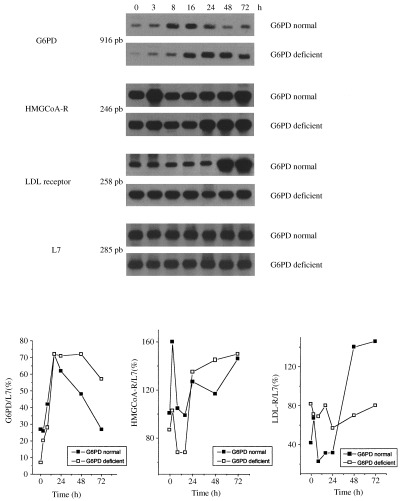
G6PD, HMGCoA reductase and LDL receptor mRNA levels during the growth of mononuclear cells from G6PD‐normal and ‐deficient subjects. Freshly isolated PBMC from G6PD‐normal and ‐deficient subjects were cultured at a concentration of 1 × 10⁶cells/ml in RPMI medium supplemented with 10% FCS. Unstimulated cells (0 h) and cells incubated with PHA (5 µg/ml) were harvested 3, 8, 16, 24, 48 and 72 h after addition. At the times indicated, cells were harvested, total RNA was extracted and RT‐PCR performed as described in Materials and Methods. The lower panel represents the densitometric quantification of mRNA levels expressed as the ratio of target gene to L7 mRNA levels. Similar results were obtained in three distinct experiments performed using different subjects.
In PHA‐stimulated cells from both G6PD‐normal and ‐deficient subjects, the stimulation of G6PD gene expression was already evident at 3 h and increased up to 24 h, then decreased in G6PD‐normal cells, whereas in G6PD‐deficient cells the level of gene expression increased up to 48 h and was still high at 72 h. The LDL receptor gene was highly expressed at steady levels in G6PD‐deficient cells while HMGCoA reductase gene expression increased only after a prolonged period of PHA stimulation (48 and 72 h), where expression was much higher than in G6PD‐deficient subjects. The same results were obtained in three distinct experiments performed using different subjects each time. No difference was observed in the expression of the L7 gene between G6PD‐normal and ‐deficient cells, indicating that the differences observed in gene expression were not due to a non‐specific modification of gene expression.
DISCUSSION
The present study has demonstrated a different pattern of intracellular cholesterol metabolism in PBMC from G6PD‐deficient as compared to G6PD‐normal subjects. Unstimulated G6PD‐deficient PBMC was characterized by lower levels of intracellular cholesterol synthesis and efflux coupled with a higher uptake of exogenous cholesterol (via LDL receptor) and LDL gene expression, thereby indicating that the majority of cholesterol utilized by deficient cells derives from an exogenous source, i.e. plasma. G6PD‐deficient subjects have also been found to exhibit low LDL cholesterol levels (Muntoni et al. 1992), conferring a favourable lipoprotein profile which may reduce the risk of cardiovascular disease.
Cholesterol metabolism differences between G6PD‐deficient and G6PD‐normal cells were more evident when PBMC were treated with mitogens. In spite of the higher mRNA levels of G6PD and the HMGCoA reductase gene, mainly evident in the prolonged times of PHA exposure, G6PD‐deficient cells showed a lower rate of cholesterol synthesis and esterification as well as a lower growth rate than normal cells. These results suggest that G6PD activation may be an important cellular event that occurs in response to cell proliferation and that the overexpression of a mutated G6PD gene may represent a cell strategy to compensate the low enzymatic activity in order to allow G6PD‐deficient cells to proliferate. Similarly, despite the overexpression of the G6PD gene (Batetta et al. 1999), tumour tissues from patients with the G6PD deficiency exhibited a lower enzyme activity than tumour tissues from G6PD‐normal subjects. However, the amount of functional enzyme produced by G6PD‐deficient cells is apparently not sufficient to supply substrates for maximal cellular growth in normal cells.
The lower cholesterol synthesis and esterification found in stimulated G6PD‐deficient cells are probably due to the reduced production of NADPH as a consequence of G6PD deficiency. Alternatively, reduced cholesterol synthesis may in itself be responsible for the higher expression of the HMGCoA reductase gene found in these cells.
Since the inherited biochemical disorder has been detected in all nucleated cells (Muntoni et al. 1992; Kleztien et al. 1994), one can predict that the decreased ability to proliferate, synthesize and accumulate cholesterol is a peculiarity of all G6PD‐deficient cells, including smooth muscle cells and monocyte‐derived macrophages in the arterial wall.
A crucial step in the development of atherosclerosis is the recruitment and proliferation of lymphomonocytes induced by a number of mitogenic molecules such as chemokines secreted by the injured endothelial cells (Ross 1993, 1999; Hansson & Libby 1996; Libby & Ross 1996).
In the present study we have shown that G6PD‐deficient cells have a lower capability to respond to the mitogenic stimulus, suggesting that the proliferative responses, induced during a lifetime by multifarious and repeated atherogenic stimuli, may be reduced in G6PD‐deficient cells.
However, whereas the abnormal deposition of cholesterol esters in the arteries is a major factor contributing to the development of atheroscerotic lesions in these subjects, the lower capability to esterify and accumulate cholesterol may account for a slower progression of the atherosclerosis. In conclusion, our data indicate that the Mediterranean variant of G6PD deficiency is characterized by peculiar alterations in plasma and intracellular cholesterol metabolism that may account for a lower risk of atherosclerotic disease. Accordingly, deaths caused by cardiovascular events have been reported to be significantly lower (approximately 50% lower) in G6PD‐deficient than in normal subjects (Cocco et al. 1998).
Acknowledgements
This study was supported by grants from MURST (40%), the University of Cagliari (ex‐60%) and Regione Autonoma della Sardegna.
References
- Batetta B, Pulisci D, Bonatesta RR, Sanna F, Piras S, Spano O, Putzolu M, Broccia G, Dessì S (1999) G6PD activity and gene expression in leukemic cells from G6PD deficient subjects. Cancer Lett. 140, 53. [DOI] [PubMed] [Google Scholar]
- Betke K, Brewer GJ, Kirkman AN, Luzzato 1 Motulsky AG, Ramot B, Siniscalco M (1967) Standardization of Procedures for the Study of Glucose‐6‐Phosphate Dehydrogenase. Report of WHO Scientific Group. WHO Technical Report Series. Albany: WHO Publications, p. 366. [PubMed] [Google Scholar]
- Chomczynsky P, Sacchi N (1987) Single‐step method of RNA isolation by acid guanidium thiocyanate‐phenol‐chloroform extraction. Anal. Biochem. 162, 156. [DOI] [PubMed] [Google Scholar]
- Cocco P, Todde P, Fornera S, Manca MB, Manca P, Sias AR (1998) Mortality in a cohort of men expressing the glucose‐6‐phosphate deficiency. Blood 91, 706. [PubMed] [Google Scholar]
- Dessì S, Batetta B, Laconi E, Ennas C, Pani P (1984) Hepatic cholesterol in lead nitrate induced during liver hyperplasia. Chem. Biol. Interact. 48, 271. [DOI] [PubMed] [Google Scholar]
- Dessì S, Chiodino C, Batetta B, Laconi E, Ennas C, Pani P (1985) Hexose monophosphate shunt and cholesterol synthesis in the diabetic and fasting states. Exp. Mol. Pathol. 43, 177. [DOI] [PubMed] [Google Scholar]
- Dessì S, Chiodino C, Batetta B, Fadda AM, Anchisi C, Pani P (1986) Hepatic glucose‐6‐phosphate dehydrogenase, cholesterogenesis and serum lipoproteins in liver rigeneration after partial hepatectomy. Exp. Mol. Pathol. 44, 169. [DOI] [PubMed] [Google Scholar]
- Dessì S, Chiodino C, Batetta B, Armeni M, Mulas MF, Pani P (1988a) Comparative effects of insulin and refeeding on DNA synthesis, HMP shunt and cholesterogenesis in diabetic and fasted rats. Pathology 20, 53. [DOI] [PubMed] [Google Scholar]
- Dessì S, Batetta B, Cherchi R, Onnis M, Pisano P, Pani P (1988b) Hexose monophosphate shunt enzymes in lung tumors from normal and glucose‐6‐phosphate dehydrogenase deficient subjects. Oncology 45, 287. [DOI] [PubMed] [Google Scholar]
- Dessì S, Batetta B, Pani P, Barra S, Miranda F, Pusceddu P (1990) G6PD activity in tumoral tissues of G6PD deficient subjects affected by larynx carcinoma. Cancer Lett. 53, 159. [DOI] [PubMed] [Google Scholar]
- Evans AW, Johnson NW, Butcher RG (1983) A quantitative biochemical study of the glucose‐6‐phosphate dehydrogenase activity in premalignant and malignant lesions of human oral mucosa. Histochem. J. 15, 483. [DOI] [PubMed] [Google Scholar]
- Folch J, Lees M, Sloane‐Stanley GH (1957) A simple method for the isolation and purification of total lipids from animal tissues. J. Biol. Chem 222, 497. [PubMed] [Google Scholar]
- Glock GE, McLean P (1953) Further studies on the properties and assay of glucose‐6‐phosphate dehydrogenase and 6‐phosphogluconate dehydrogenase of rat liver. Biochem. J. 55, 400. [DOI] [PMC free article] [PubMed] [Google Scholar]
- Hansson GK, Libby P (1996) The role of the lymphocyte In: Fuster V, Ross R, Topol EJ, eds. Atherosclerosis and Coronary Artery Diseases, Vol. 1. Philadelphia: Lippincott‐Raven, p. 557. [Google Scholar]
- Hemmerich P, Von Mikecz A, Newman F, Sozeri O, Wolff Vorbech G, Zoebelein R, Krawinkel U (1993) Structural and functional properties of ribosomal protein L7 from humans and rodents. Nucl. Acids Res. 21, 223. [DOI] [PMC free article] [PubMed] [Google Scholar]
- Ho YK, Browns MS, Bilheimer DW, Goldstein JL (1976) Regulation of low density lipoprotein receptor activity in freshly isolated human PBMC. J. Clin. Invest. 58, 1465. [DOI] [PMC free article] [PubMed] [Google Scholar]
- Kleztien RF, Harris PKW, Foellmi L (1994) Glucose‐6‐phosphate dehydrogenase: a ‘housekeeping’ enzyme subject to tissue‐specific regulation by hormones, nutrients, and oxidant stress. Faseb J. 8, 174. [DOI] [PubMed] [Google Scholar]
- Libby P, Ross R (1996) Cytokines and growth regulatory molecules In: Fuster V, Ross R, Topol EJ, eds. Atherosclerosis and Coronary Artery Diseases, Vol. 1. Philadelphia: Lippincott‐Raven, p. 585. [Google Scholar]
- Lowry OH, Rosebrough NJ, Farr JL, Randall RJ (1951) Protein measurement with Folin phenol reagent. J. Biol. Chem. 193, 265. [PubMed] [Google Scholar]
- Luzzatto L, Metha A (1989) Glucose‐6‐phosphate dehydrogenase deficiency In: Senver CR, Beaudet AL, Sly WS, Valle D, eds. The Metabolic Basis of Inherited Disease, Vol. 2. London: McGraw‐Hill, p. 2237. [Google Scholar]
- Muntoni S, Batetta B, Dessì S, Muntoni SA, Pani P (1992) Serum lipoprotein profile in the Mediterranean variant of glucose‐6‐phosphate dehydrogenase deficiency. Eur. J. Epidemiol. 8, 48. [DOI] [PubMed] [Google Scholar]
- Powell EE, Kroon PA (1992) Measurement of mRNA by quantitative PCR with a nonradioactive label. J. Lipid Res. 33, 609. [PubMed] [Google Scholar]
- Ross R (1993) The pathogenesis of atherosclerosis: a perspective for the 1990s. Nature 362, 801. [DOI] [PubMed] [Google Scholar]
- Ross R (1999) Mechanisms of disease: Atherosclerosis – An inflammatory disease. New Eng. J. Med. 340, 115. [DOI] [PubMed] [Google Scholar]
- Vulliamy T, Mason P, Luzzato L (1992) The molecular basis of glucose‐6‐phosphate dehydrogenase deficiency. Curr. Trends Genet. 8, 138. [DOI] [PubMed] [Google Scholar]