Abstract
Abstract. Objective: Establishment of tetraploid ES cells. Materials and methods: Mouse H‐1 (ES) cells were polyploidized by demecolcine and released from the drug. Results: A tetraploid cell line (4nH1 cells) was established from mouse H‐1 (ES) cells (2nH1 cells) highly polyploidized by treatment with demecolcine. Cell cycle parameters of 4nH1 cells were almost the same as those of 2nH1 cells, suggesting that the rate of DNA synthesis was about twice that of the diploid cells. Mode of chromosome number of 4nH1 cells was 76, about twice that of 2nH1 cells. Cell volume of 4nH1 cells was about twice of that of diploid cells, indicating that 4nH1 cells contained about twice as much total intracellular material as 2nH1 cells. Morphology of the 4nH1 cells was flagstone‐like, thus differing from that of the spindle‐shaped 2nH1 cells, suggesting that the transformation had occurred during the diploid–tetraploid transition. 4nH1 cells exhibited alkaline phosphatase activity and formed teratocarcinomas, implying that they would be pluripotent. Conclusion: A pluripotent tetraploid cell line (4nH1 cells) was established.
INTRODUCTION
Mouse embryonic stem (ES) cells have been used widely as vehicles for introducing targeted mutations into mice (Doetschman et al. 1987; Thomas & Capecchi 1987), as essential materials to create various organs by controlled differentiation (Hascheler et al. 1997; Kawasaki et al. 2000) and as primary materials to investigate the characteristics of ES cells. Mouse germline‐transmissible embryonic stem cells, H‐1 cells, were established from blastocysts of C3H/He mice by Kitani et al. (1996). It has been confirmed that H‐1 cells have the ability to differentiate to neural cells, epithelial cells, muscle cells, hair follicle cells and chondrocytes (Kitani et al. 1996).
Demecolcine (DC) antagonizes tubulin polymerization and induces disassembly of microtubules into monomers (Inoue 1981). The drug inhibits spindle fibre formation in M phases and polyploidizes many cells. Although polyploidation of mammalian cells occurs in various organs, particularly in aged or partially hepatectomized liver, the mechanisms are poorly understood (Mossin et al. 1994; Zong et al. 1994; Fogt & Nanji 1996; Seglen 1997). Whether DC causes polyploidization in cells may depend on the cell type used (Fujikawa‐Yamamoto et al. 1993). Here, we have been interested in whether H‐1 cells could be caused to become polyploidy and to establish this cell type as a polyploid line.
Tetraploid and octaploid Meth‐A cell lines have been established from diploid and tetraploid cells using DC. They exhibit different characteristics from each other (2001b, 2002b; Fujikawa‐Yamamoto & Sakuma 2003). ES cells are pluripotent stem cells. We were interested in whether pluripotent potential would be preserved during the diploid–tetraploid transition in ES cells. In this study, a tetraploid cell line, the 4nH1 cell line, is established from H‐1 (ES) cells highly polyploidized using DC, and their cellular characteristics were examined.
MATERIALS AND METHODS
Cells
H‐1 (ES) cells established from blastocysts of C3H/He mouse (Kitani et al. 1996) were purchased from RIKEN Bio Resource Center (Institute of Physical and Chemical Research, Tsukuba, Japan), and were maintained in a humidified atmosphere of 5% CO2 at 37 °C in Leibovitz's L15: Ham's F10 mixture (7 : 3) (L15F10) medium supplemented with 10% foetal bovine serum (CELLect GOLD, ICN Biomedicals, Aurora, OH, USA), 2‐mercaptoethanol (0.1 mm), streptomycin (50 µg/ml), penicillin (50 units/ml) and leukaemia inhibitory factor (500 U/ml, ESGRO, Chemicon International Inc., Funakoshi, Japan). Tetraploid H‐1 cells were cultured under the same culture conditions as described above. Diploid and tetraploid H‐1 cells cultured in L15F10 medium were called ‘2nH1’ and ‘4nH1’ cells, respectively.
Polyploidization by demecolcine treatment and establishment of tetraploid cells
Exponentially growing 2nH1 cells were placed into culture flasks (25 cm2, Corning Costar Co., Acton, MA, USA) at a density of approximately 5 × 10⁵ cells/flask. Twelve hours thereafter, the cells were exposed to a variety concentrations of DC (Sigma, St. Louis, MO, USA). At a range of times, the cells were harvested and were used to count cell number and to obtain DNA histograms. To establish tetraploid cell lines, 2nH1 cells exposed to 270 nm DC for 48 h were released from DC by washing twice with drug‐free medium, then they were cultured again in drug‐free L15F10 medium. At a variety of times, the cells were sub‐cultured and were used to obtain DNA histograms.
Cell preparation for flow cytometry
Cells were fixed with 35% ethanol, were incubated with 0.25% RNase (Type II‐A, Sigma) for 3 h at 4 °C, and then were counted using a haemocytometer. Immediately before measurements, cells were stained with propidium iodide (PI, 7.5 × 10⁻⁵ m) and were examined for red fluorescence by flow cytometry (FCM). Under these staining conditions, the signal due to residual double‐stranded RNA is negligible and the relative intensity of red fluorescence corresponds to DNA content (Krishan 1975).
Flow cytometry
Fluorescence from individual cells was measured using a FACSORT flow cytometer (Becton Dickinson Immunocytometry Systems, Franklin Lake, ND, USA). Fluorescence of individual cells irradiated by focused laser light at a wavelength of 488 nm was detected using a photomultiplier tube. Relative intensity of red fluorescence (FL2H) was measured and DNA histograms were obtained.
Cell cycle analysis
Flow cytmetry (FCM) data of FL2H (signals of red‐fluorescence intensity through a logarithmic amplifier) for 10 000 cells were entered into CASL software (Mathematica, Wolfram Research Inc., Champaign, IL, USA) for cell cycle analysis of DNA histograms on a log scale using transfer software ‘FACS to ASCII’ (freeware), and the DNA histograms were decomposed to phase fractions based on DNA content (Fujikawa‐Yamamoto 1999). The algorithm of CASL is similar to Fried's method (Fried 1977) except that normal distribution functions having the same half‐width instead of the same coefficient of variation value are used as components.
Cell‐volume distribution
Exponentially growing 2nH1 and 4nH1 cells were trypsinized, fixed in 20% ethanol and were re‐suspended in divalent cation‐free phosphate‐buffered saline (PBS(–)). Distribution of cell‐volume was measured using a Coulter Counter (ZM/256, Coulter Electronics, Fullerton CA, USA). Standard spheres (9.8 µm diameter, Coulter sphere, Coulter Electronics) were used as controls. Requisite Coulter Counter volume depends on the material being tested, as it is calculated with reference to the resistance of particles.
Chromosome analysis
Exponentially growing 2nH1 and 4nH1 cells were exposed to DC at a concentration of 270 nm for 3 h. The cells were trypsinized, swelled with 75 mm KCl, fixed with fixing solution (CH3OH : CH3COOH = 7 : 3) and were dropped on glass slides. Cell‐chromosome mixture was stained with Giemsa's solution in order to visualize chromosomes for microscopy and microphotography. Chromosome numbers were manually counted from the micrographs.
Cell morphology and histochemistry
Morphology of logarithmically growing 2nH1 and 4nH1 cells in a Lab‐Tek Chamber Slide (Nalge Nunc International, Napeville, IL, USA) or culture dishes was photographed using a phase contrast microscope (CK2, Olympus, Tokyo, Japan) equipped with a digital camera system (C4040, Olympus). Cells were then washed twice with PBS(–), and were fixed (methanol : formalin : acetic acid, 9000 : 1000 : 1). Cells in the chamber slide were stained for alkaline phosphatase activity using the standard method recommended by the test kit manufacturers (Histofine, Nichirei Bio Science Co., Tokyo, Japan). Cells stained without substrate were used as a negative controls, and all samples were photographed using a microscope (BX 60, Olympus) equipped with a digital camera system (C4040, Olympus). Samples of cells were also stained with haematoxylin–eosin using a standard method. Images were entered into a personal computer and were printed out at magnifications stated below.
Teratocarcinoma formation
Solid tumours formed by 4nH1 cells after intraperitoneal injection into normal C3H/He male (6w) mice (Japan SLC Inc., Shizuoka, Japan) were sectioned and were stained with haematoxylin–eosin. Morphology was photographed using a microscope (BX 60, Olympus) equipped with a digital camera system (C4040, Olympus). Mouse abdomens were also photographed using a digital camera (µ720, Olympus). Images were entered into a personal computer and were printed. Part of a solid tumour was excised plus a normal tissue sample, was minced with scissors, filtered with a nylon mesh, and was prepared for FCM.
RESULTS
To examine induction of polyploidization by DC, 2nH1 cells were exposed to various concentrations of DC and their growth curves and DNA histograms were obtained (Fig. 1). Cell growth was suppressed by DC at concentrations above 270 nm. 8C peaks appeared in DNA histograms of 2nH1 cells exposed to above 270 nm DC for 2 days, suggesting that H‐1 cells had tetraploidized. Although a 16C peak was observed in DNA histograms of 2nH1 cells exposed to above 270 nm DC for 3 days, significant cell debris was also observed, suggesting that highly polyploidized 2nH1 cells tend to die.
Figure 1.
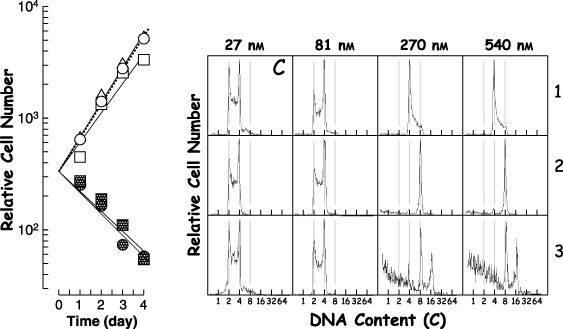
Growth curves (left panel) and DNA histograms (right panel) of 2nH1 cells exposed to demecolcine (DC). Exponentially growing 2nH1 cells were exposed to various concentrations of DC. In the growth curves, the symbols ○, ▵, □, •and ▪, represent 0, 27, 81, 270 and 540 nm, respectively. Numerals on the right side represent the time (day) after drug addition. The drug concentrations are also indicated at the top of columns. In DNA histograms, abscissa represents DNA content (C, complement). Longitudinal lines were drawn to facilitate understanding. The panel C is the control with 0 nm DC, irrespective the numeral at the top of column.
To examine whether polyploidized‐polyploid transition occurred, 2nH1 cells were exposed to 270 nm DC for 1 or 2 days, then were released from exposure (Fig. 2). The DNA histogram of 2nH1 cells 2 days after release from 2‐day DC exposure (2‐2‐0) contained a 16C peak, suggesting that 2nH1 cells octaploidized after drug removal. Most of the 2nH1 cells in all of the flasks (total 9 flasks) showed tetraploid DNA content, with the exception of those of a single flask (1‐0‐14), in which the cells were released from 1‐day DC exposure. It was concluded that 2nH1 cells transformed to tetraploid cells through polyploidization induced by DC. The tetraploid cells were tentatively named 4nH1 cells.
Figure 2.
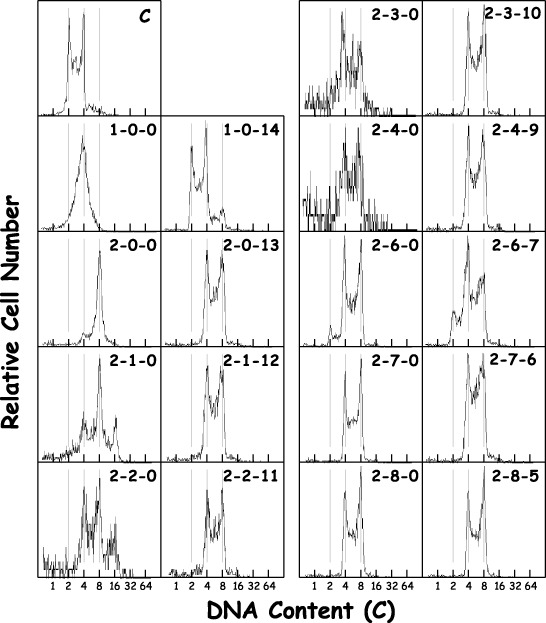
Changes in DNA histograms of 2nH1 cells exposed to DC. Exponentially growing 2nH1 cells were exposed to 270 nm DC for 1 or 2 days and then released from the exposure. The three hyphened numerals represent the duration (day) of DC exposure, the time (day) after the drug removal and the time (day) after the first sub‐culturing, in that order. The abscissa represents DNA content (C, complement). Vertical grey lines were drawn to facilitate understanding. Panel C is the control.
To examine cell cycle parameters, the doubling time and phase fraction of 4nH1 cells were measured and were compared to those of 2nH1 cells (Fig. 3 and Table 1). Doubling times of cell populations were 19.0 h for both 2nH1 and 4nH1 cells. Cell cycle parameters were almost the same between 2nH1 and 4nH1 cells (Table 1), suggesting that the rate of DNA synthesis is about 2‐fold faster in 4nH1 cells than in 2nH1 cells.
Figure 3.
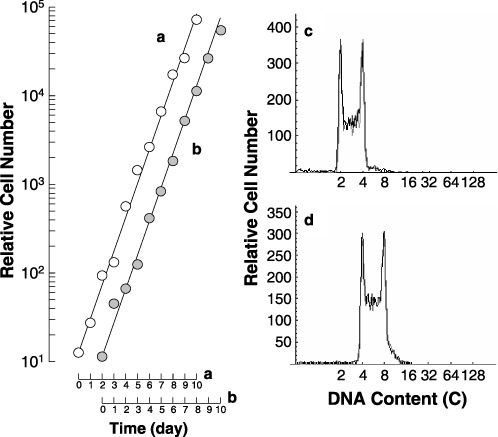
Growth curves (a and b), synthesized histogram (grey‐line histograms of c and d) and DNA histograms (black‐line histograms of c and d) of 2nH1 (a and c) and 4nH1 (b and d) cells growing exponentially in culture flasks. In the panels c and d, the synthesized (grey line) and observed (black line) histograms are superposed. Solid lines were drawn in the growth curves to facilitate understanding. In the DNA histograms, the abscissa represents DNA content (C, complement).
Table 1.
Cell cycle parameters of 2nH1 and 4nH1 cells
| Phase | G1 | S | G2/M |
|---|---|---|---|
| 2nH1 cells (Td = 19.0 h a ) | |||
| Fraction | 0.239 (0.216) | 0.520 (0.470) | 0.240 (0.217) |
| Duration (h) b | 3.50 | 9.60 | 5.89 |
| 4nH1 cells (Td = 19.0 h a ) | |||
| Fraction | 0.229 (0.209) | 0.531 (0.486) | 0.240 (0.219) |
| Duration (h) b | 3.33 | 9.77 | 5.89 |
Td is the doubling time calculated from Fig. 3. Phase fractions were determined, omitting those for cells with other ploidy in the cell population. Numbers in parentheses represent the fraction of the total cell population.
Phase duration was calculated using conventional equations (Watanabe & Okada 1967) employing the doubling time instead of the cycle time.
To examine the ploidy, distribution of chromosome number in 2nH1 and 4nH1 cells was compared (Fig. 4, left panels). The mode of the chromosome number of 4nH1 cells was 76, indicating that 4nH1 cells were hypotetraploid. Figure 4 also shows two photographs of chromosomes scattered on slides. It seems that chromosomes spread into a kinetochore‐bound chromosome‐crown (upper image) or kinetochore‐tightened chromosome‐clusters (lower image), suggesting specific configurations of chromosomes.
Figure 4.
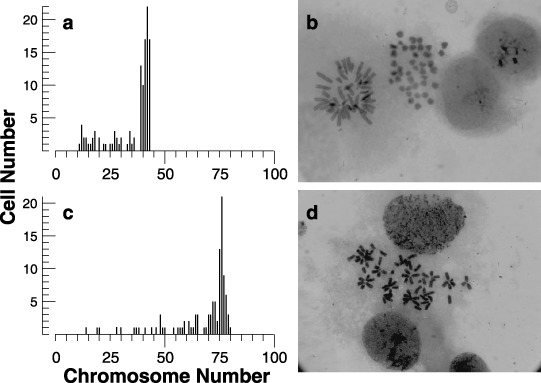
Histogram of chromosome number (a and c) and photomicrographs (b and d) of 2nH1 (a and b) and 4nH1 cells (c and d). Exponentially growing 2nH1 and 4nH1 cells were exposed to 270 nm DC for 3 h. Giemsa‐stained chromosomes of about 100 cells were enumerated from enlarged photographs.
To examine cell volumes of 4nH1 cells, Coulter volume was employed (Fig. 5, left panels). The mode of cell‐volume of 4nH1 cells was roughly twice that of 2nH1 cells, suggesting that 4nH1 cells were produced through cell cycle progression without cell division.
Figure 5.
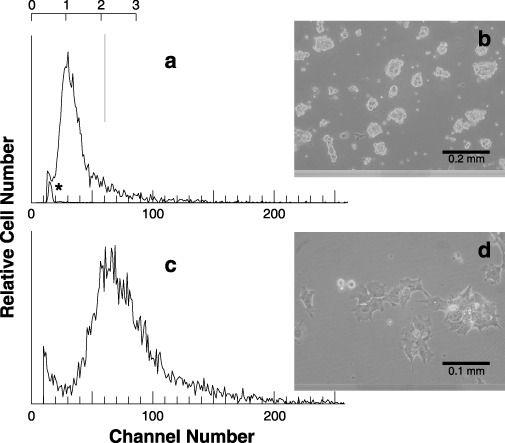
Volume distribution (a and c) and phase‐contrast micrographs (b and d) of exponentially growing 2nH1 (a and b) and 4nH1 (c and d) cells. Cell volume was measured using a Coulter counter. The vertical line and scale were drawn to facilitate understanding. In the panel a, the distribution of standard spheres (*) is superimposed.
Microphotographs of exponentially growing 2nH1 and 4nH1 cells are shown in Fig. 6(a and b). Surface morphology of 4nH1 cells was flagstone‐like, which differs from that of the spindle‐like 2nH1 cells, suggesting that diploid–tetraploid transition accompanied the transformation. 4nH1 cells were mononuclear, suggesting that one 4nH1 cell was formed from one 2nH1 cell.
Figure 6.
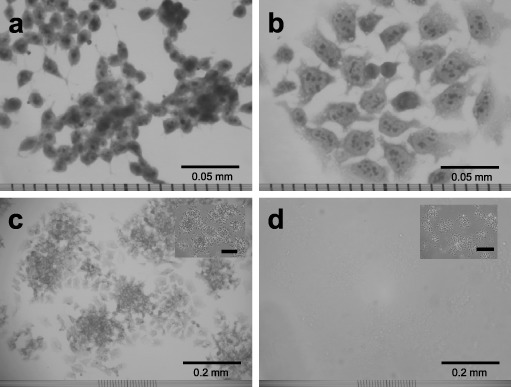
Microphotographs of 2nH1 (a) and 4nH1 cells (b, c and d) growing exponentially. Cells were stained with haematoxylin–eosin (a and b) or for alkaline phosphatase activity (c and d). Photograph d is a negative control in which cells were stained without substrate. The inserts in c and d show phase‐contrast microphotographs of the respective main fields.
To examine pluripotent potential, 4nH1 cells were stained for alkaline phosphatase activity (Fig. 6c and d). 4nH1 cells showed strong alkaline phosphatase activity, suggesting that pluripotent potential is preserved over the diploid–tetraploid transition.
To examine the teratocarcinoma formation, 4nH1 cells were intraperitoneally injected into male mice. Few weeks after, solid tumours were found to have formed in several organs, suggesting that cells had affinities to disseminate into different kinds of tissues (Fig. 7b). The appropriate DNA histogram showed 4C and 8C peaks, indicating that the tumours were tetraploid (Fig. 7c); they consisted of many differentiated cell types, suggesting that they were teratocarcinoma (Fig. 7a).
Figure 7.
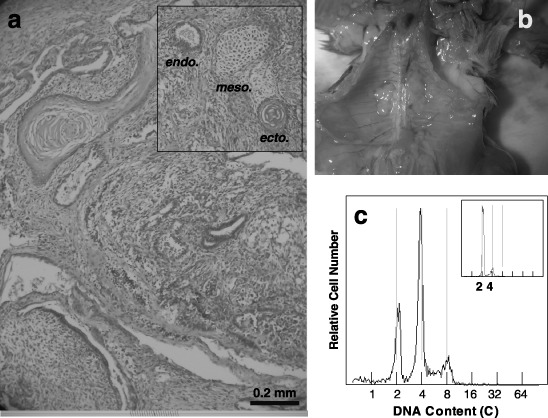
A histological section (a), an abdominal photograph (b) and a DNA histogram (c) of solid tumours formed by 4nH1 cells after intraperitoneal injection into a normal C3H/He mouse. 4nH1 cells growing exponentially were intraperitoneally injected. Solid tumours were formed in several organs (b). The histological section of the tumour showed a heterogeneous conformation of cells (a). In the insert of a, endodermal, mesodermal and ectodermal cells are indicated as endo., meso. and ecto., respectively. The tumour on a liver showed DNA histograms with 2C, 4C and 8C peaks, suggesting that it is tetraploid (c). The insert of DNA histogram c is of normal tissue around the tumour. In the DNA histograms, the abscissa represents DNA content (C, complement).
4nH1 cells were sub‐cultured for 8 months, during which time they underwent more than 300 divisions. DNA histograms of them showed hypotetraploidy. To ascertain that the 4nH1 cells had been established as a cell line, 4nH1 cells were stored at 158 K (–135 °C) for 1 month and then were replaced in culture. The 2nH1 (parent) and 4nH1 cells in a steady state of population growth expanded with a doubling time of approximately 19 h (data not shown), suggesting that the 4nH1 cells had been established as a cell line.
DISCUSSION
4nH1 cells were established through polyploidation of 2nH1 induced by DC. Efficiency of the diploid–tetraploid transformation (2–4 transition) was up to 100% (8 flasks/8 flasks). Several polyploid cell lines have been established from highly polyploidized cells (2003, 2001a, 2002a). What is the difference between polyploidized and polyploid cells? The mechanism of ploidy transition is not yet known and it has been proposed that genome structures of polyploidized and polyploid cells are distinctly different (Fujikawa‐Yamamoto 2006). Polyploidized cells may require reconstruction of chromosome configuration for establishment as polyploid cells. As ES cells have the potential to differentiate to germ cells, which might have a specific configuration of chromosomes, it might be reasonable that ES cells would be easily transformed to high polyploidy.
It is interesting to note that the 2–4 transition of 2nH1 cells altered their morphology from spindle shaped to flagstone‐like, suggesting increased adherence to culture‐flasks or decreased cell–cell binding. It has been reported that the 2–4 and 4–8 transitions result in maintenance of the total content and density of the cell surface hydrocarbon chains, respectively, in mouse Meth‐A cell line (Fujikawa‐Yamamoto & Sakuma 2003). It is probable that the 2–4 transition in 2nH1 cells induced the morphological change. Note that the morphology of 2nH1 is reversibly round and spindle‐like in Dulbecco's modified Eagle's medium and L15F10 medium, respectively (Fujikawa‐Yamamoto et al. 2006).
Chromosomes were seen to be scattered in clusters with chromosomes tightened at the kinetochores (Fig. 4d). If indeed chromosomes are connected with inter‐chromosome fibres of DNA (Myhra & Grogger 1975), the scattering pattern of chromosomes may be interpreted as a result of winding of inter‐chromosome fibres. As the fibre is coiled, kinetochores are gathered at several points.
4nH1 cells were established as hypotetraploid. The mode of the chromosome number was 76 at approximately passage 30. It is well known that polyploid cells decrease their DNA content during cell‐culture (Moor et al. 1968; Harris 1971; Graves & McMillan 1984; Fujikawa‐Yamamoto et al. 2005), and it has been reported that mouse polyploid Meth‐A cells decrease DNA content as 0.0026Ip/division in the initial stage, where Ip is the initial ploidy (Fujikawa‐Yamamoto et al. 2005). This indicates that mouse tetraploid cells will have a reduction of 0.2 chromosomes per cell division at the initial stage. It is probable that established 4nH1 cells are hypotetraploid.
It should be emphasized that these results of the cell cycle response of H‐1 cells can be applied only to a particular type of proliferating cell, 2nH1 cells, under specific culture conditions with medium containing leukaemia inhibitory factor.
ACKNOWLEDGEMENTS
The authors would like to thank Dr Hiroshi Kitani, who permitted the use of H‐1 cells, and also they would like to thank Dr Shogo Katsuda, who helped the assignment of differentiated cells in the tetraploid teratocarcinoma.
REFERENCES
- Doetschman T, Gregg RG, Maeda N, Hooper ML, Melton DW, Thompson S, Smithies O (1987) Targeted correction of a mutant HPRT gene in mouse embryonic stem cells. Nature 330, 576–578. [DOI] [PubMed] [Google Scholar]
- Fogt F, Nanji AA (1996) Alteration in nuclear ploidy and cell phase distribution of rat liver cells in experimental alcoholic liver disease: relationships to antioxidant enzyme gene expression. Toxicol. Appl. Pharmacol. 136, 87–93. [DOI] [PubMed] [Google Scholar]
- Fried J (1977) Analysis of deoxyribonucleic acid histograms from flowfluorometry. Estimation of distribution of cells within S phase. J. Histochem. Cytochem. 25, 942–951. [DOI] [PubMed] [Google Scholar]
- Fujikawa‐Yamamoto K (1999) Cell cycle analysis of DNA histograms in logarithmic scale. Cytometry Res. 9, 73–84. [Google Scholar]
- Fujikawa‐Yamamoto K (2006) An hypothesis about genome structures in mammalian polyploid cells based on a new concept that genome is fractal of six hierarchies. Med. Hypothesis 66, 337–344. [DOI] [PubMed] [Google Scholar]
- Fujikawa‐Yamamoto K, Sakuma M (2003) Maintenance of quantity and density of membrane glycochains in diploid‐tetraploid and tetraploid‐octaploid transitions, respectively of Meth‐A cells demonstrated by lectin binding. Cytologia 68, 191–198. [Google Scholar]
- Fujikawa‐Yamamoto K, Yamagishi H, Miyagoshi M (2003) Octaploid Meth‐A cells are established from highly polyploidized cell population. Cell Prolif. 36, 87–100. [DOI] [PMC free article] [PubMed] [Google Scholar]
- Fujikawa‐Yamamoto K, Miyagoshi M, Yamagishi H (2005) DNA loss and related alterations in long‐term cultures of diploid, tetraploid and octaploid Meth‐A cells. Cytologia 70, 337–344. [Google Scholar]
- Fujikawa‐Yamamoto K, Miyagoshi M, Yamagishi H (2006) Reversible alteration in morphology and proliferation of mouse H‐1 (ES) cells in DME versus L15F10 medium. J. Kanazawa Med. Univ. 31, 138–143. [Google Scholar]
- Fujikawa‐Yamamoto K, Iwai H, Teraoka K, Odashima S, Murakami E (1993) Typing of responses of cultured cells to demecolcine and critical control points in the M phase. J. Kanazawa Med. Univ. 18, 98–105. [Google Scholar]
- Fujikawa‐Yamamoto K, Wang S, Yamagishi H, Ohdoi C, Murano H, Ikeda T (2001a) Establishment of a tetraploid Meth‐A cell line through polyploidization by demecolcine not by staurosporine, K‐252a and paclitaxel. Cell Prolif. 34, 211–222. [DOI] [PMC free article] [PubMed] [Google Scholar]
- Fujikawa‐Yamamoto K, Wang S, Yamagishi H, Miyagoshi M (2001b) Temperature dependence in proliferation of tetraploid Meth‐A cells in comparison with the parent diploid cells. Cell Struct. Funct. 26, 263–269. [DOI] [PubMed] [Google Scholar]
- Fujikawa‐Yamamoto K, Yamagishi H, Wang S, Miyagoshi M (2002a) Establishment of a triploid V79 cell line from tetraploid cells obtained through polyploidization using K‐252a. Cell Prolif. 35, 369–379. [DOI] [PMC free article] [PubMed] [Google Scholar]
- Fujikawa‐Yamamoto K, Ikeda T, Wang S, Yamagishi H, Miyagoshi M (2002b) Serum dependence in proliferation of diploid and tetraploid Meth‐A cells. Cytologia 67, 75–82. [Google Scholar]
- Graves JAM, McMillan J (1984) Control of DNA synthesis in polyploid mammalian cells. J. Cell Physiol. 121, 409–414. [DOI] [PubMed] [Google Scholar]
- Harris M (1971) Polyploid series of mammalian cells. Exp. Cell Res. 66, 329–336. [DOI] [PubMed] [Google Scholar]
- Hascheler J, Fleischmanni BK, Lentini S, Maltsev VA, Rohwedle J, Wobus AM, Addicks K (1997) Embryonic stem cells: a model to study structural and functional properties in cardiomyogenesis. Cardiovasc Res. 36, 149–162. [DOI] [PubMed] [Google Scholar]
- Inoue S (1981) Cell division and mitotic spindle. J. Cell Biol. 91, 131–147. [DOI] [PMC free article] [PubMed] [Google Scholar]
- Kawasaki H, Mizuseki K, Nishikawa S, Kaneko S, Kuwana Y, Nakanishi S, Nishikawa SI, Sasai Y (2000) Induction of midbrain dorpaminergic neurons from ES cells by stromal cell‐derived inducing activity. Neuron 28, 31–40. [DOI] [PubMed] [Google Scholar]
- Kitani H, Takagi N, Atsumi T, Kawakura K, Imamura K, Goto S, Kusakabe M, Fukuta K (1996) Isolation of a germline‐transmissible embryonic stem (ES) cell line from C3H/He mice. Zool. Sci. 13, 865–871. [DOI] [PubMed] [Google Scholar]
- Krishan A (1975) Rapid flow cytofluorometric analysis of mammalian cell cycle by propidium iodide staining. J. Cell Biol. 66, 188–193. [DOI] [PMC free article] [PubMed] [Google Scholar]
- Moore J, Kieler J, Biczowa B (1968) Comparative studies of a near‐tetraploid and a near‐diploid line of Ehrlich's ascites tumor propagated in vivo and in vitro II. Cytology and transplantability. Eur. J. Cancer 4, 81–95. [DOI] [PubMed] [Google Scholar]
- Mossin L, Blankson H, Huitfeldt H, Seglen PO (1994) Ploidy‐dependent growth and binucleation in cultured rat hepatocytes. Exp. Cell Res. 214, 551–560. [DOI] [PubMed] [Google Scholar]
- Myhra S, Grogger A (1975) Interchromosomal DNA‐containing fibres in human cells. Humangenetik 29, 183–189. [DOI] [PubMed] [Google Scholar]
- Seglen PO (1997) DNA ploidy and autophagic protein degradation as determinant of hepatocellular growth and survival. Cell Biol. Toxicol. 13, 301–315. [DOI] [PubMed] [Google Scholar]
- Thomas KR, Capecchi MR (1987) Site directed mutagenesis by gene targeting in mouse embryo‐derived stem cells. Cell 51, 503–512. [DOI] [PubMed] [Google Scholar]
- Watanabe I, Okada S (1967) Effects of temperature on growth rate of cultured mammalian cells. J. Cell Biol. 32, 309–323. [DOI] [PMC free article] [PubMed] [Google Scholar]
- Zong Z, Fujikawa‐Yamamoto K, Teraoka K, Yamagishi H, Tanino M, Odashima S (1994) Potentiation of K‐252a, a protein kinase inhibitor‐induced polyploidization by cAMP in cultured fibrosarcoma cell line. Biochem. Biophys. Res. Commun. 205, 745–750. [DOI] [PubMed] [Google Scholar]


