Abstract
Objectives
To investigate the functions of miR‐223‐3p and ITGB3 in pulmonary arterial hypertension (PAH).
Materials and Methods
Microarray analysis was used to detect differentially expressed genes and microRNAs. In in vitro models, the expressions of miR‐223‐3p and ITGB3 were detected by qRT‐PCR and Western blot. α‐SMA expression and cell proliferation were analysed by immunofluorescence and MTT assay, respectively. In in vivo models, PAH progressions were determined by measuring the levels of mPAP and RVSP. Lung and myocardial tissues were subjected to HE staining and Masson and Sirius red‐saturated carbazotic acid staining to investigate the pathological features.
Results
The microarray analysis revealed that ITGB3 was upregulated, while hsa‐miR‐223‐3p was downregulated in PAH. After the induction of hypoxia, miR‐223‐3p was downregulated and ITGB3 was upregulated in PASMCs. Hypoxia induction promoted cell proliferation and inhibited α‐SMA expression in PASMCs. Both the upregulation of miR‐223‐3p and the downregulation of ITGB3 attenuated the aberrant proliferation induced by hypoxia conditions. After approximately 4 weeks, the mPAP and RVSP levels of rats injected with MCT were decreased by the overexpression of miR‐223‐3p or the silencing of ITGB3. The staining results revealed that both miR‐223‐3p overexpression and ITGB3 knockdown alleviated the pulmonary vascular remodelling and improved the PAH pathological features of rats.
Conclusions
MiR‐223‐3p alleviated the progression of PAH by suppressing the expression of ITGB3, a finding which provides novel targets for clinical treatment.
Keywords: ITGB3, MiR‐223‐3p, pulmonary arterial smooth muscle cell, pulmonary hypertension
1. INTRODUCTION
Pulmonary arterial hypertension (PAH) refers to a high resting mean pulmonary artery pressure (≥25 mm Hg).1 PAH is a progressive pulmonary vascular disease related to the dysfunction of pulmonary arterial endothelial cells (PAECs) and pulmonary arterial smooth muscle cells (PASMCs).2 PAH often leads to the remodelling and dysfunction of the pulmonary vasculature, right ventricular hypertrophy and even death.3 Optimal combination therapies are required to improve the quality of life of patients.4 Thus, developing novel therapeutic strategies for treating PAH is essential and urgent.
MicroRNAs (miRNAs), which are 20‐22 nucleotides in length, are endogenously expressed non‐coding RNAs that inhibit or degrade their target RNAs. MiRNAs play important roles in cell differentiation, proliferation, migration, apoptosis and stress responses.5 Recent studies have indicated that miRNAs can serve as biomarkers for different vascular pathologies, including early myocardial infarction and heart failure in humans.6 Several miRNAs have been implicated in the pathophysiological mechanisms of PAH. Sarrion et al7 reported that miR‐23a is correlated with pulmonary function parameters. Courboulin et al8 indicated that the reduction in miR‐204 levels promotes PASMC proliferation and induces resistance to apoptosis. Meloche et al9 reported that the downregulation of miR‐223 plays an important role in PAH, and restoring the expression of this miRNA can reverse PAH.
Integrin‐β 3 subunit gene (ITGB3) is known as platelet glycoprotein IIIa and antigen integrin β3 (CD61). ITGB3 has been demonstrated to be modulated by miR‐95 to regulate the proliferation, migration and invasion of non‐small‐cell lung cancer.10 In addition, abnormal PASMC proliferation is a pathological feature of PAH,11 although there has been no specific research investigating the role of ITGB3 in PAH. Moreover, the functions of miR‐223‐3p and ITGB3 in PAH are still not fully understood.
In this study, we investigated the expression of miR‐223‐3p and ITGB3 in PASMCs subjected to hypoxia in vitro and in the pulmonary artery tissues of a PAH rat model. miR‐223‐3p was found to hinder the deterioration caused by PAH, whereas ITGB3 contributed to the progression of PAH. These discoveries suggest the great potential of miR‐223‐3p and ITGB3 as novel PAH therapeutic targets and biomarkers for PAH.
2. MATERIALS AND METHODS
2.1. Bioinformatics analysis
The microarrays GSE33463 and GSE67597 were obtained from the Gene Expression Omnibus (GEO) database (https://www.ncbi.nlm.nih.gov/geo/). Differentially expressed genes and dysregulated pathways were uncovered through the R language and Kyoto Encyclopedia of Genes and Genomes (KEGG) database, respectively. The Linear Models for Microarray and RNA‐seq Data (Limma) package was utilized to investigate gene expression between the IPAH group and healthy controls. The threshold used to screen for upregulated and downregulated mRNA was P < 0.05 and |log (FC)| > 1. The differentially expressed genes were clustered using the heatmap package.
2.2. Cell isolation and cultivation
Healthy male Sprague Dawley (SD) rats weighing 200 g were anesthetized with 200 g/L urethane at a dose of 5 mL/kg. Pulmonary arteries were isolated in aseptic operations, and PASMCs were isolated from sections of pulmonary arteries as previously described.12 In the subsequent experiments, the cells were cultured at 37°C in an atmosphere with 5% CO2.
2.3. Hypoxia induction
When the cells were reached 70% confluence, a serum‐free medium was utilized to replace the initial medium that contained 10% FBS. Positive control PASMC lines were purchased from Cell Applications (San Diego, CA, USA). After being cultured for 12 hour, the cells were divided into two groups, namely the control group and the hypoxia induction group. Cells in the control group were incubated under 21% O2, 5% CO2 and balanced N2; cells in the hypoxia induction group were incubated under 2% O2, 5% CO2 and balanced N2, as described previously.13
2.4. α‐SMA immunofluorescence
PASMCs were fixed in 4% formaldehyde for 10 minutes and then incubated in 10% goat serum for 30 minute. The cells were then incubated with the primary rabbit anti‐α‐SMA antibody (ab124964, 1:500; Abcam, Cambridge, MA, USA) overnight at 4°C. Next, the cells were incubated with the secondary antibody, DyLight 488 goat anti‐rabbit immunoglobulin G (IgG) (1:200; Beyotime, Shanghai, China), for 1 hour. 4′,6‐Diamidino‐2‐phenylindole (DAPI) was used to stain the cell nuclei (blue) at a concentration of 1.5 μmol/L. The images were observed using fluorescence microscopy.
2.5. Western blot
Approximately 1 × 10⁷ cells were solubilized in lysis buffer purchased from the Beyotime Institute of Biotechnology (Shanghai, China). Sodium dodecyl sulphate polyacrylamide gel electrophoresis (SDS‐PAGE) was utilized to separate the proteins. Afterwards, approximately 60 µg of the purified proteins was transferred to a polyvinylidene difluoride (PVDF) membrane. Then, the membrane with the adsorbed proteins was incubated with Tris‐buffered saline with Tween 20 (TBST) buffer obtained from Fanke Biotech Co., Ltd. (Shanghai, China) at room temperature, supplemented with 5% non‐fat milk. After 1 hour, the membrane was incubated with the primary antibodies overnight at room temperature, followed by incubation with the corresponding secondary antibody for 4 hour. In the present study, the primary antibodies used were as follows: rabbit anti‐α‐SMA (ab124964, 1:10 000 dilution; Abcam), rabbit anti‐ITGB3 (ab218435, 1:5000 dilution), rabbit anti‐PARP‐1 (1:1000; Cell Signaling) and γH2AX (1:250; Cell Signaling). The secondary antibody was goat anti‐rabbit IgG (1:5000 dilution; Beyotime) labelled with horseradish peroxidase (HRP). An electrochemiluminescence (ECL) kit and ImageJ software from Media Cybernetics (Rockville, MD, USA) were used to determine the chemiluminescent and relative protein expression, which was presented as the density ratio compared to GAPDH.
2.6. Quantitative real‐time polymerase chain reaction
The RNApure total RNA extraction Kit (Bioteke Corporation, Beijing, China) was used to extract the total RNA, which was reversed transcribed using Super M‐MLV reverse transcriptase (Bioteke Corporation). To evaluate the expression levels of Rno‐miR‐223‐3p and ITGB3, SYBR Premix Ex Taq from TaKaRa Biotechnology (Tokyo, Japan) was utilized, and U6 and GAPDH served as the respectively internal controls. The sequences of the primers used in this study are listed in Table 1. The relative gene expression was calculated using the 2−ΔΔCT method.
Table 1.
Sequences of primers utilized in qRT‐PCR
| Primers | Sequence |
|---|---|
| Rno‐miR‐223‐3p | 5′‐UGUCAGUUUGUCAAAUACCCCA‐3′ |
| U6 (Forward) | 5′‐GCGCGTCGTGAAGCGTTC‐3′ |
| U6 (Reverse) | 5′‐GTGCAGGGTCCGAGGT‐3′ |
| ITGB3 (Forward) | 5′‐TCCTATGGAGACACCTGCGA‐3′ |
| ITGB3 (Reverse) | 5′‐AGGTACAGTTCACCGCGTTT‐3′ |
| GAPDH (Forward) | 5′‐TGTGAACGGATTTGGCCGTA‐3′ |
| GAPDH (Reverse) | 5′‐GATGGTGATGGGTTTCCCGT‐3′ |
2.7. Transfection
Specific siRNAs, designated ITGB3 siRNA 1, ITGB3 siRNA 2 and ITGB3 siRNA 3, miR‐223‐3p mimics and inhibitor and the matched control oligonucleotides (Invitrogen, Carlsbad, CA, USA) were transfected via Lipofectamine 2000 according to the manufacturer's protocol (Invitrogen). The sequences of the oligonucleotides are listed in Table 2.
Table 2.
Sequences of oligonucleotides utilized for transfection
| Oligonucleotides | Sequence |
|---|---|
| miR‐223‐3p mimics | 5′‐UGUCAGUUUGUCAAAUACCCC‐3′ |
| Control mimics | 5′‐CAUAACAACCGGCAGAAUGAGCG −3′ |
| miR‐223‐3p inhibitor | 5′‐GGGGUAUUUGACAAACUGACA‐3′ |
| Control inhibitor | 5′‐CAGUAGCATTGAGTUGCCAGAGCG‐3′ |
| ITGB3 siRNA 1 | 5′‐AGGACGTGTTCACCCTGGTTCTAAA‐3′ |
| ITGB3 siRNA 2 | 5′‐CAGAATCCATCGAGTTCCCAGTGAG‐3′ |
| ITGB3 siRNA 3 | 5′‐GATTACCCTGTGGACATCTACTACT‐3′ |
| Control siRNA | 5′‐CAGTCTTTAGAGCTTACCTGAGCAG‐3′ |
2.8. MTT assay
3‐(4,5‐Dimethylthiazol‐2‐yl)‐2,5‐diphenyl‐tetrazolium bromide (MTT) acquired from Sigma‐Aldrich (Shanghai, China) was used to investigate cell proliferation. After 24, 48, 72 and 96 hour of culturing, 10 μL of MTT (5 mg/mL, pH 7.4) was supplemented into each well containing 1 × 10³ cells, which were all at the exponential growth stage. After incubation for 4 hour at 37°C, the cells were treated with 150 μL of dimethylsulphoxide (DMSO). Multiskan FC from Thermo Fisher Scientific (Waltham, MA, USA) was then applied, and the absorbance at 570 nm was measured.
2.9. Apoptosis assay
To investigate the rate of apoptosis, Annexin V‐FITC and propidium iodide (PI) double staining was performed. Briefly, cells were harvested, washed twice with PBS and resuspended at 1 × 10⁶ cells/mL in 100 μL of binding buffer. Next, the cells were incubated with Annexin V‐FITC and PI for 15 minute at room temperature in the dark and mixed with 400 μL of binding buffer. Flow cytometry (FACSCalibur, Becton‐Dickinson, Franklin Lakes, NJ, USA) was performed within 1 hour. The data were analysed using the Modifit Flow Cytometry Software, as previously described.14, 15
2.10. Dual luciferase reporter assay
Recombinant luciferase reporter vectors containing the ITGB3 3′‐untranslated region (3′UTR) wild type (WT) and mutant type (MUT) were constructed. MiR‐223‐3p mimics or the negative control was co‐transfected with ITGB3 MUT and ITGB3 WT into human foetal kidney 293 T cells (HEK‐293 T) using Lipofectamine 2000 (Invitrogen). Dual luciferase measurements were performed using a Glomax 20/20 Luminometer (YuanPingHao Biotechnology Co Ltd, Beijing, China) 48 hour after the HEK‐293 T were transfected.
2.11. Animal model
Rats were divided into the experimental group and the control group, which were respectively treated with 1% monocrotaline (MCT, pH 7.4, 60 mg/kg) and 0.9% normal saline via intraperitoneal injection. After approximately 4 weeks, severe PAH was observed in the experimental group.16
To determine the effects of ITGB3 and miR‐223‐3p in vivo, pGenesil‐1‐sh‐ITGB3 was constructed. The expression promoter of control plasmid pGenesil‐1‐HK U6 as well as short hairpin‐ITGB3 (sh‐ITGB3) was cloned into the adenovirus shuttle vector pAdTrack to construct the recombinant adenovirus shuttle plasmids pAdTrack‐U6‐sh‐ITGB3 and pAdTrack‐U6‐HK. Additionally, agomiR‐223‐3p and control agomir were also constructed based on the sequences shown in Table 2. Rats with established PAH were nebulized with agomiR‐223‐3p (20 µmol/L once per week for 2 weeks) or adenovirus (1.5 × 10⁸ pfu/L, 50 µL once per week for 2 weeks).17, 18
2.12. Haemodynamics
The pulmonary pressure changes were measured. In brief, a 13‐cm‐long, heparin‐priming polyethylene catheter (outer diameter, 0.9 mm) connected to PowerLab 16/30 (ADInstruments, Dunedin, New Zealand) through a pressure transducer was introduced into the right external jugular vein and advanced into the right ventricle and the main pulmonary artery. The right ventricular systolic pressure (RVSP), pulmonary arterial systolic pressure (PASP), total pulmonary resistance (TPR) and mean pulmonary arterial pressure (mPAP) were recorded. Meanwhile, the cardiac output (CO) and end‐diastolic pressure were assessed, as previously described.19, 20, 21, 22
2.13. Haematoxylin‐eosin (HE) staining
Paraffin‐embedded tissue sections were roasted and dried for 20 minute in the oven at 75°C, followed by immersion in xylene for 15 minute, anhydrous ethanol for 5 minute, 95% ethanol for 5 minute, 80% ethanol for 5 minute and 70% ethanol for 5 minute. All operations were conducted twice. Briefly, after the sections were dried, haematoxylin was used to stain the nuclei, and eosin was used to stain the cytoplasm after dewaxing and hydration, as previously described.23, 24 To examine the degree of fibrosis, microscopic images of the HE‐stained tissues were graded according to the Ashcroft method.25
2.14. Masson staining
For Masson staining, paraffin‐embedded tissue sections were stained with haematoxylin for 1 minute and then Masson Li Chunhong acid fuchsine solution for 5 minute. The detailed histological protocols were previously described.26
2.15. Sirius red‐saturated carbazotic acid staining
Paraffin‐embedded tissue sections were washed with distilled water and then stained with celestine blue for 10 minute followed by three washes with distilled water. Then, Sirius red‐saturated carbazotic acid was applied for 20 minute. Afterwards, the sections were treated with 0.2% ethylic acid for 1 minute, twice. After dehydration, transparency and sealing, the tissues were observed using ordinary optical or polarized light microscopy.27, 28
2.16. Immunohistochemistry
Immunohistochemistry (IHC) analysis was performed on 5‐μm paraffin‐embedded tissue sections that were rehydrated in a graded series of ethanol (99%‐70%) and finally in distilled water. For ITGB3 staining, blocking of non‐specific antibody binding was blocked with 3% bovine serum albumin (BSA) in Tris‐buffered saline supplemented with 0.05% Tween 20 (TBST). A primary antibody against rabbit ITGB3 (ab218435, 1:100; Abcam) was diluted in 1% BSA in TBST. The antigen‐antibody complex was visualized using a horseradish peroxidase‐conjugated IgG secondary antibody (1:200; Beyotime) followed by 3,3′‐diaminobenzidine (DAB). ITGB3 immunostaining was scored as follows: score 0, no expression; score 1, weak expression; score 2, moderate expression; score 3, strong expression.29
2.17. Data analysis
Data were presented as the mean ± standard deviation (SD) of at least three independent replicates. Data were analysed with GraphPad Prism 6.0 (GraphPad Software, La Jolla, CA, USA), and comparisons between two groups were analysed by the Student's t test. Multiple groups were compared with one‐way ANOVA. Differences were considered significant at values of P < 0.05.
3. RESULTS
3.1. Downregulation of miR‐223‐3p in IPAH and related dysregulated pathways
Differentially expressed genes and dysregulated pathways were determined using the R language and KEGG database, respectively. Figure 1A shows the top 10 differentially expressed genes with aberrantly high and low expression. ITGB3 was shown to be upregulated in IPAH tissues. As shown in Figure 1B, hsa‐miR‐223‐3p was downregulated in patients with IPAH. The top 14 significantly activated and inactivated pathways in IPAH are shown in Figure 2A. The Gene Oncology (GO) analysis revealed that these co‐expressed genes in IPAH were associated with several biological processes, including autophagy and phagocytic vesicle membrane (Figure 2A). The KEGG analysis results revealed upregulated pathways in IPAH, such as olfactory transduction, pantothenate and CoA biosynthesis, regulation of actin cytoskeleton and ubiquitin‐like protein ligase binding. Compared to the normal group, the extracellular matrix (ECM) receptor interaction pathway was significantly upregulated in the IPAH group (Figure 2B). The joyplot (Figure 3A) and the dotplot (Figure 3B) illustrate the activated and suppressed GO pathways in IPAH tissues. Figure 4A,B illustrates the activated and suppressed KEGG pathways in IPAH tissues, including the ECM receptor interaction pathway.
Figure 1.
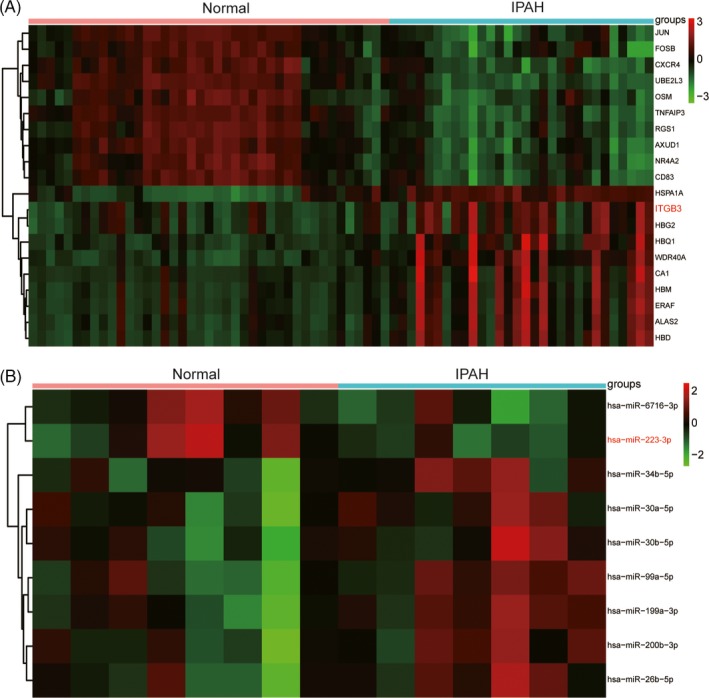
MiR‐223‐3p and ITGB3 are differentially expressed in IPAH patients. A, According to GSE33463, differentially expressed genes included ITGB3 in IPAH. B, After analysing the data of GSE67597, differentially expressed miRNAs were detected, including miR‐223‐3p in IPAH
Figure 2.
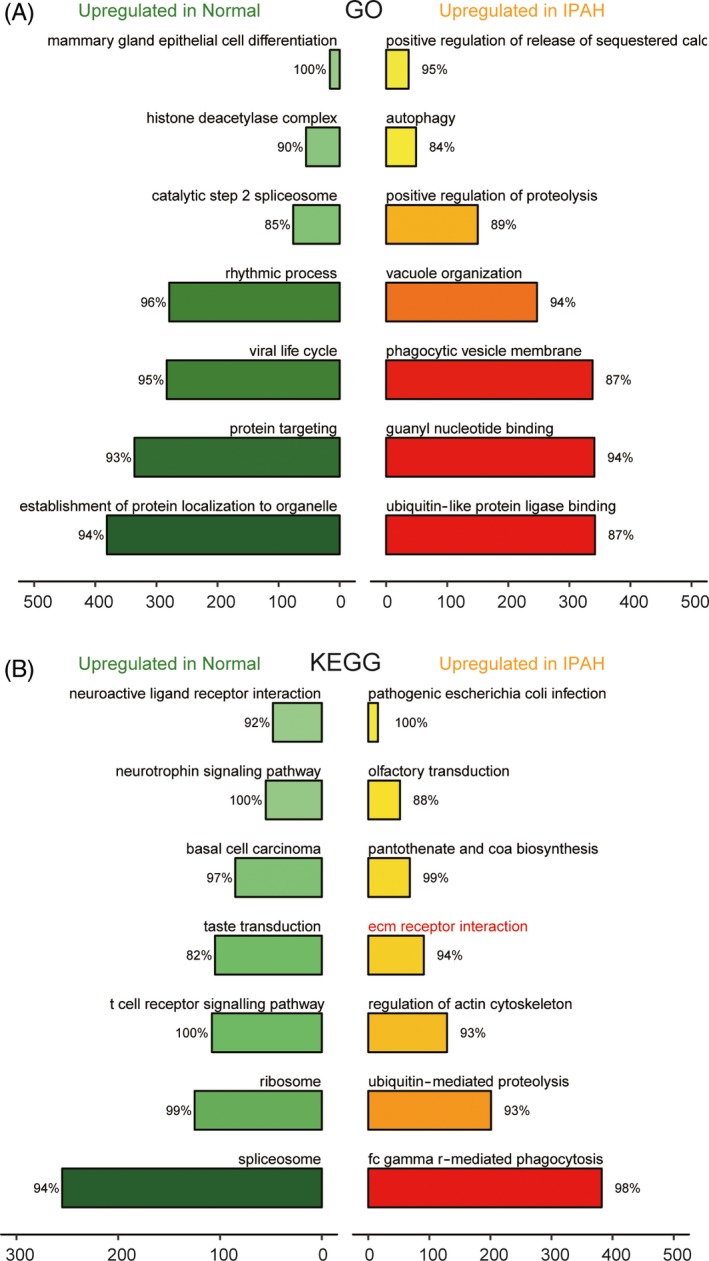
Gene oncology (GO) and Kyoto encyclopedia of genes and genomes (KEGG) pathway analysis of differentially expressed genes in IPAH. A, The seven most distinctively activated GO pathways between healthy and IPAH tissues. B, The seven most distinctively activated KEGG pathways in healthy and IPAH tissues
Figure 3.
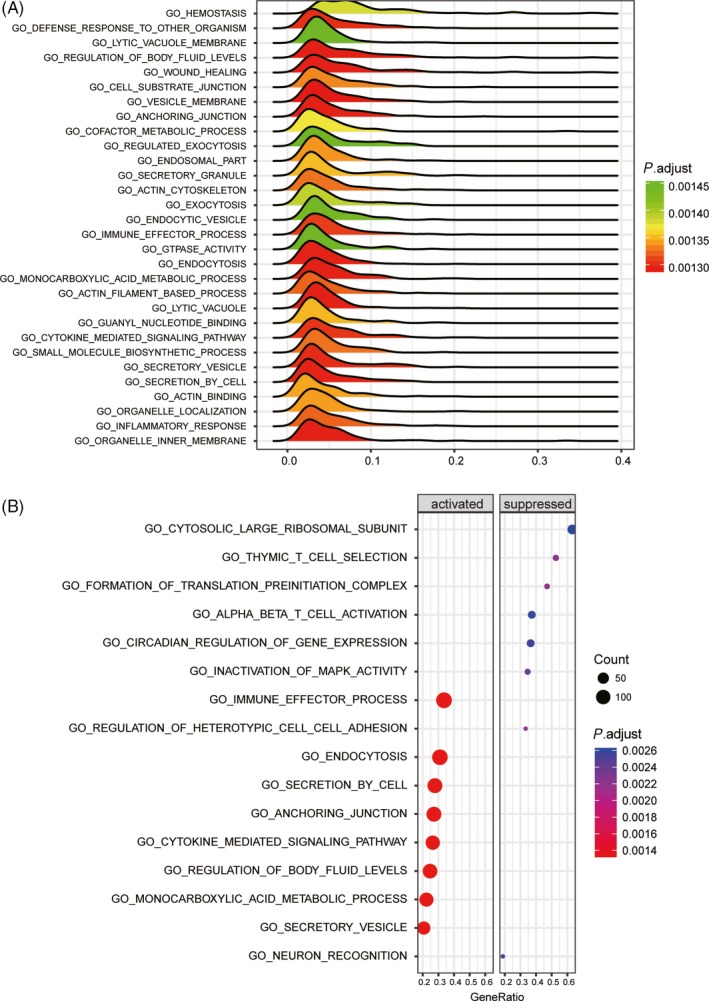
Results of gene oncology (GO) analysis. A and B, The GO analysis revealed differentially modulated pathways in the IPAH group compared to the normal group. In the dotplot, the graph size represents the number of genes. The colour represents the P value. In the joyplot, the enrichment significance (the adjusted P value) is reflected by the colour intensity of the peaks. Pathways with ridges on the left side of 0 were downregulated, while those with ridges on the right side of 9 were upregulated. The gene ratio in the horizontal axis represents the proportion of differential genes in the gene set
Figure 4.
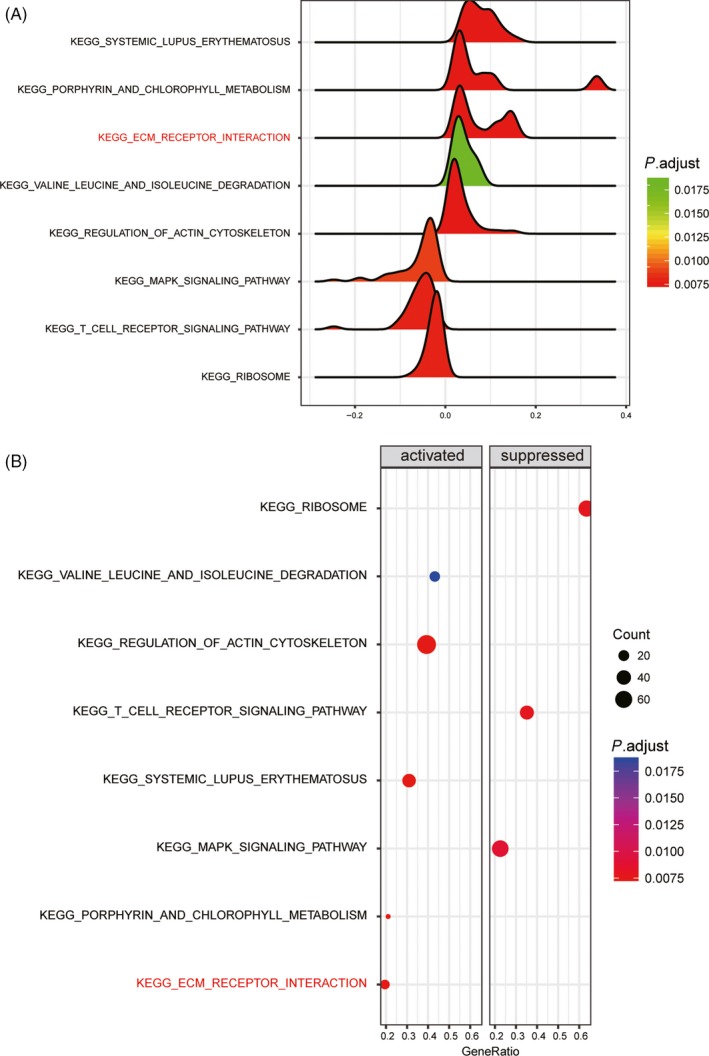
Results of Kyoto encyclopedia of genes and genomes (KEGG) analysis. A and B, The KEGG analysis revealed differentially modulated pathways in the IPAH group compared to the normal group, including the extracellular matrix (ECM) receptor interaction pathway. In the dotplot, the graph size represents the number of genes. The colour represents the P value. In the joyplot, the enrichment significance (the adjusted P value) is reflected by the colour intensity of the peaks. Pathways with ridges on the left side of 0 were downregulated, while those with ridges on the right side of 9 were upregulated. The gene ratio in the horizontal axis represents the proportion of differential genes in the gene set
3.2. Visual characterization of PASMC and analysis of the expressions of miR‐223‐3p and ITGB3 after hypoxia induction
PASMCs were observed under the microscope and “peak and valley” characteristics were exhibited (Figure 5A). α‐SMA was strongly expressed in PASMCs (Figure 5B). After the induction of hypoxia, the expression of miR‐223‐3p was suppressed in the hypoxia group (Figure 5C, P < 0.01), whereas ITGB3 expression was elevated in the hypoxia group compared with normal group (Figure 5D,E, P < 0.01).
Figure 5.
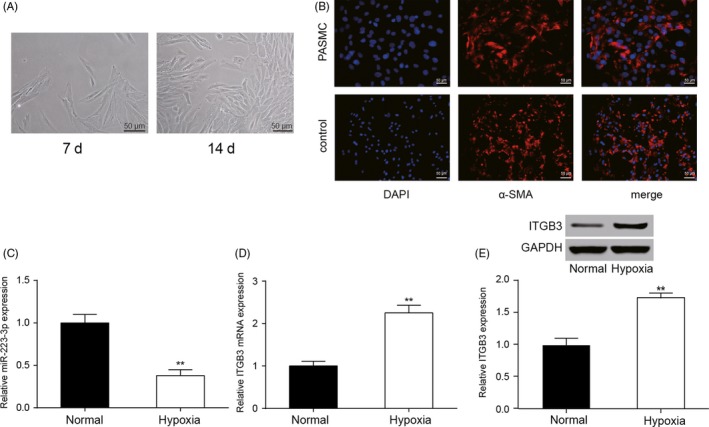
Characterization of pulmonary arterial smooth muscle cells (PASMCs) and analysis of the expressions of miR‐223‐3p and ITGB3 the induction of after hypoxia. A, Photographs of PASMC were screened, magnification, ×200; scale bar: 50 µm. B, PASMCs were characterized by α‐smooth muscle actin (α‐SMA) immunofluorescence, magnification, ×400; scale bar: 50 µm. C and D, QRT‐PCR was utilized to evaluate the expression levels of miR‐223‐3p and ITGB3 in the hypoxic cells compared with the normal cells. E, ITGB3 protein expression was determined in normal and hypoxic cells by Western blot. All experiments were performed in triplicate. **P < 0.01
3.3. MiR‐223‐3p and ITGB3 expression levels after transfection
Three different specific siRNAs against ITGB3 were transfected into PASMCs. SiRNA2 exhibited the highest interference efficiency (Figure 6A, P < 0.001) and was therefore selected for use in further experiments and designated as si‐ITGB3. miR‐223‐3p expression in PASMCs was significantly elevated after transfection with miR‐223‐3p mimics, whereas transfection with miR‐223‐3p inhibitor had the opposite effect (Figure 6B, P < 0.01). Transfection with pcDNA‐ITGB3 resulted in the upregulated mRNA expression of ITGB3 compared with the control plasmid, whereas in the si‐ITGB3 group, the mRNA expression of ITGB3 was significantly attenuated (Figure 6C, P < 0.01). In addition, the Western blot analysis confirmed these results (Figure 6D). The luciferase reporting assay using the ITGB3 wild‐type 3′UTR and mutant 3′UTR confirmed the direct target relationship between miR‐223‐3p and the ITGB3 3′UTR (Figure 6E,F). In addition, Jolyane Meloche et al9 reported that the downregulation of miR‐223 promotes the expression of poly [ADP‐ribose] polymerase 1(PARP‐1) in human PAH‐PASMC. Shi et al30 reported that the downregulation of miR‐223 in the lung was associated with an increased expression of the miR‐223 target, insulin‐like growth factor‐I receptor (IGF‐IR) and insulin‐like growth factor‐l (IGF‐1) downstream signalling. To confirm our findings, PARP‐1 and IGF‐IR levels were detected by Western blot. As shown in Figure 7A,B and 8A,B, after the induction of hypoxia, PARP‐1 and IGF‐IR expression increased significantly. Notably, both the suppression of ITGB3 and the elevated expression of miR‐223‐3p impaired the hypoxia‐induced expression of PARP‐1 and IGF‐IR Moreover, the overexpression of miR‐223‐3p attenuated the impact of pcDNA‐ITGB3 in both the normoxia and hypoxia group.
Figure 6.
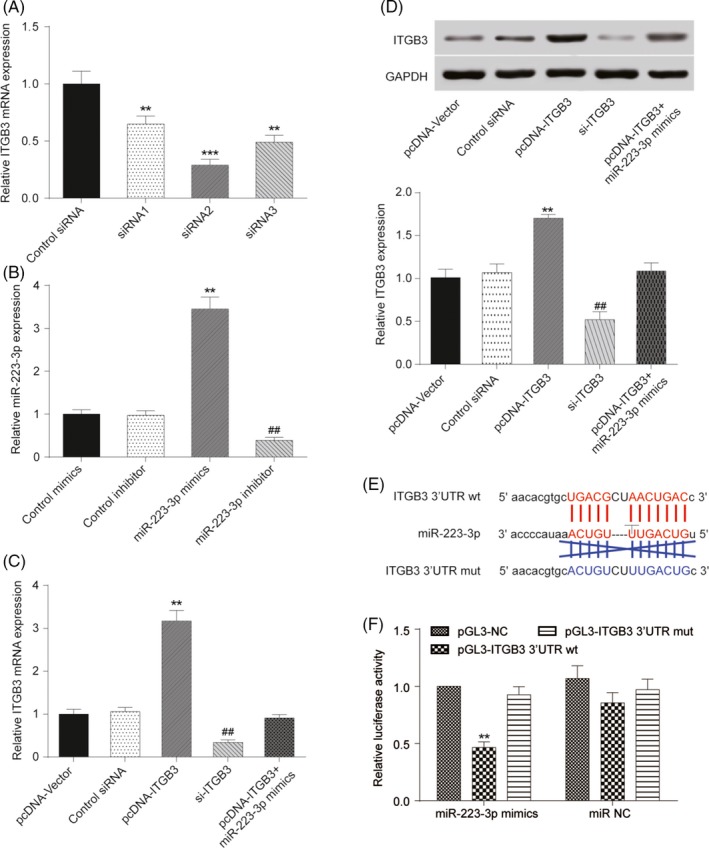
MiR‐223‐3p and ITGB3 expression level after transfection. A, ITGB3 expression after transfection with three specific siRNAs was determined. B, MiR‐223‐3p expression level after transfection with miR‐223‐3p mimics or inhibitor was confirmed via qRT‐PCR. C, The ITGB3 mRNA level after transfection with pcDNA‐ITGB3 or si‐ITGB3 transfection was compared with matched control groups via qRT‐PCR. D, The protein expression of ITGB3 was measured and compared with the matched control group after transfection with pcDNA‐ITGB3 and si‐ITGB3 or co‐transfection with pcDNA‐ITGB3 and miR‐223‐3p mimics. E, Design of ITGB3 3′UTR (wild type and mutant) was the target sequence. F, The dual luciferase reporter assay was performed, and decreased luciferase activity was observed in miR‐223‐3p mimics + pGL3‐ITGB3 wt group. All experiments were performed in triplicate. **P < 0.01 compared with control siRNA, control mimics, pcDNA Vector or pGL3‐NC group; ## P < 0.01 compared with control inhibitor or control siRNA
Figure 7.
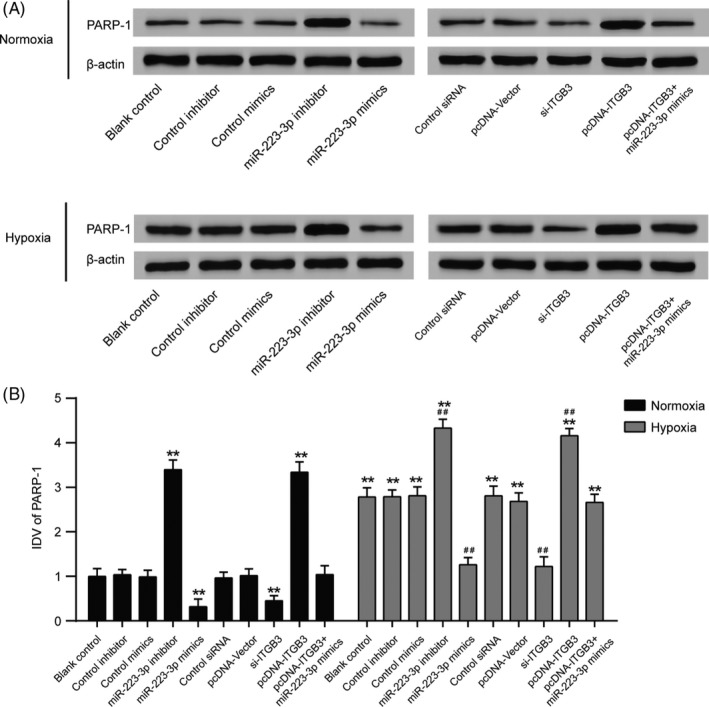
Poly [ADP‐ribose] polymerase 1 (PARP‐1) expression level in pulmonary arterial smooth muscle cells (PASMCs) cultured under normal or hypoxic conditions after transfection. Other targets of miR‐223 were measured, including PARP‐1. A, After being cultured in either normoxic or hypoxic conditions for 36 h, Western blot analysis was performed to measure the protein level in all groups. B, Relative integrated density value (IDV) analysis of PARP‐1. All experiments were performed in triplicate. **P < 0.01 compared with the blank control in the normoxia treatment group; ## P < 0.01 compared with blank control in the hypoxia group
Figure 8.
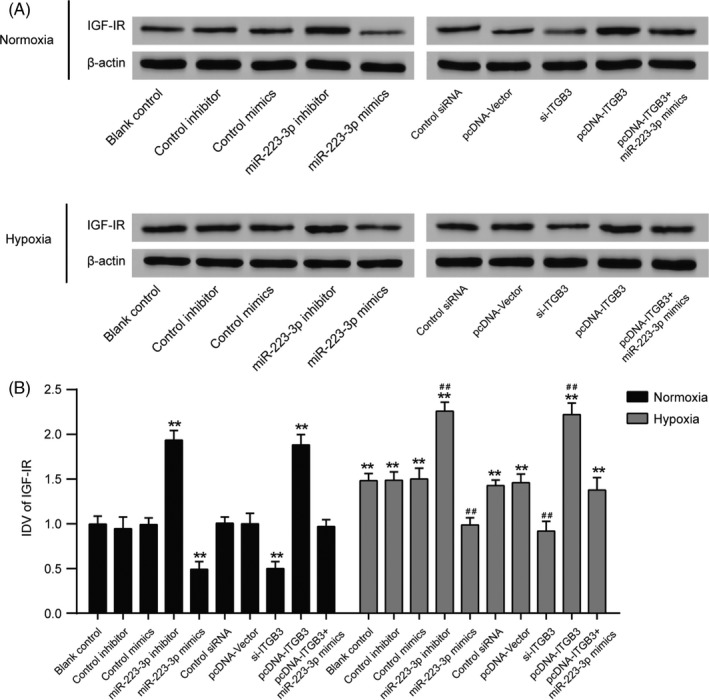
Insulin‐like growth factor‐I receptor (IGF‐IR) expression in pulmonary arterial smooth muscle cells (PASMCs) cultured under normal or hypoxic conditions after transfection. Other targets of miR‐223 were measured, including IGF‐IR A, After being cultured in either normoxic or hypoxic conditions for 36 h, Western blot analysis was performed to measure the protein levels in all groups. B, Relative integrated density value (IDV) analysis of IGF‐IR All experiments were performed in triplicate. **P < 0.01 compared with the blank control in the normoxia treatment group; ## P < 0.01 compared with the blank control in the hypoxia group
3.4. The proliferation of PASMCs after transfection under normal or hypoxic conditions
Cells transfected with all methods exhibited a strong proliferative ability under hypoxic conditions (Figure 9, P < 0.01). The inhibition of miR‐223‐3p or overexpression of ITGB3 efficiently increased the optical density (OD) values and facilitated cell proliferation under both normoxic and hypoxic conditions. Meanwhile, an elevated expression of miR‐223‐3p reverses the effect of hypoxia compared with blank control group. Furthermore, upregulated expression of miR‐223‐3p also attenuated the positive effect of ITGB3 overexpression under both normoxic and hypoxic conditions.
Figure 9.
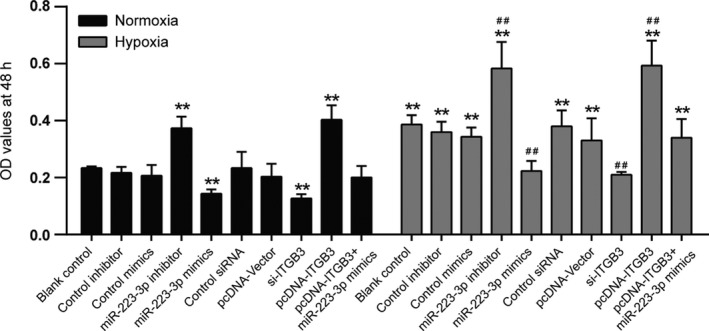
The proliferation of pulmonary arterial smooth muscle cell (PASMC) after transfection under normal or hypoxic conditions. Cell proliferation of PASMCs was measured, after transfection with miR‐223‐3p mimics or miR‐223‐3p inhibitor or si‐ITGB3 or pcDNA‐ITGB3 at 48 h. All experiments were performed in triplicate. **P < 0.01 compared with the blank control in the normoxia treatment group; ## P < 0.01 compared with the blank control in hypoxia group
3.5. The rate of apoptosis and the expression of γ‐H2AX expression level in PASMCs after transfection under normal or hypoxic conditions
Cells transfected with all methods exhibited a low rate of apoptosis under hypoxic conditions compared to normoxic conditions (Figure 10A,B, P < 0.01). The upregulation of miR‐223‐3p promoted apoptosis as did the downregulation of ITGB3, whereas the inhibition of miR‐223‐3p or the overexpression of ITGB3 markedly decreased the apoptosis rate under both normoxic and hypoxic conditions. Further, the upregulated expression of miR‐223‐3p attenuated the positive effect of ITGB3 overexpression under both normoxic and hypoxic conditions. In addition, to confirm whether miR‐223 modulation affects apoptosis through DNA damage, the expression of DNA damage sensor γ‐H2AX31 was detected. As shown in Figure 11A,B, after the induction of hypoxia, γ‐H2AX expression increased significantly, indicating that, indeed, miR‐223 modulation affects cells apoptosis through DNA damage. Suppression of ITGB3 or elevated expression of miR‐223‐3p enhanced the expression of γ‐H2AX induced by hypoxia (Figure 11A,B, P < 0.01).
Figure 10.
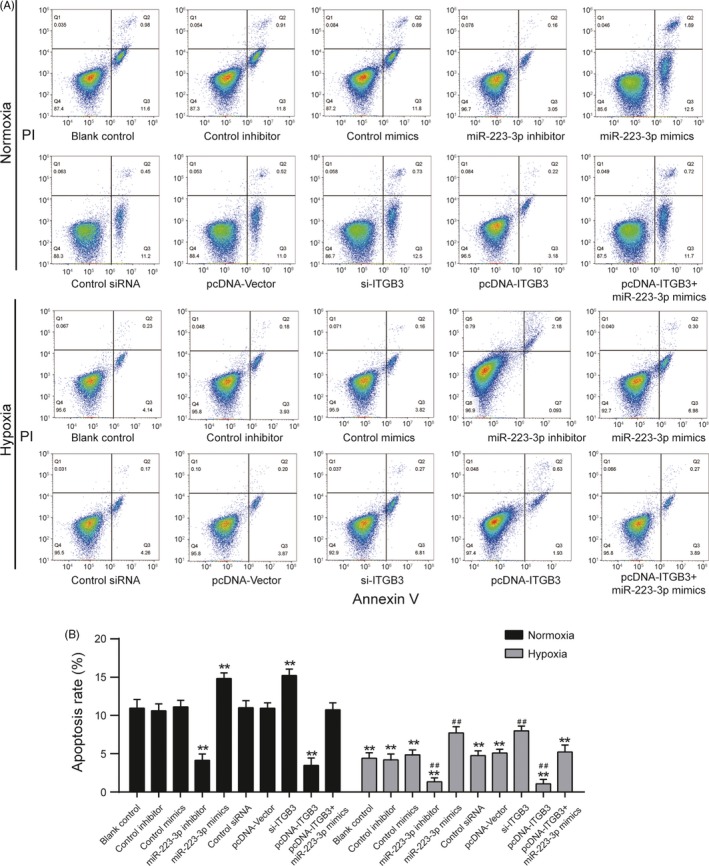
miR‐223 regulates the apoptosis of pulmonary arterial smooth muscle cell (PASMCs) after transfection under normal or hypoxic condition. Flow cytometric analysis was used to evaluate the effects of miR‐223‐3p mimics or miR‐223‐3p inhibitor or si‐ITGB3 or pcDNA‐ITGB3 transfection at 48 h on apoptosis of PASMCs. A, The x‐axis represents Annexin V‐FITC staining, and y‐axis represents PI staining. Quadrant Q4 is Annexin V‐FITC‐and PI negative, representing viable cells. Quadrant Q3 is Annexin V‐FITC positive and PI negative, representing cells in early‐stage apoptosis viable cells. Quadrant Q1 is Annexin V‐FITC negative and PI positive, representing dead cells. Quadrant Q2 is Annexin V‐FITC and PI positive, representing cells in late‐stage apoptosis. B, The percentage of early‐ and late‐stage apoptotic cells is represented in the histogram. Data were representative of three independent experiments. **P < 0.01 compared with the blank control in the normoxia treatment group; ## P < 0.01 compared with the blank control in the hypoxia group
Figure 11.
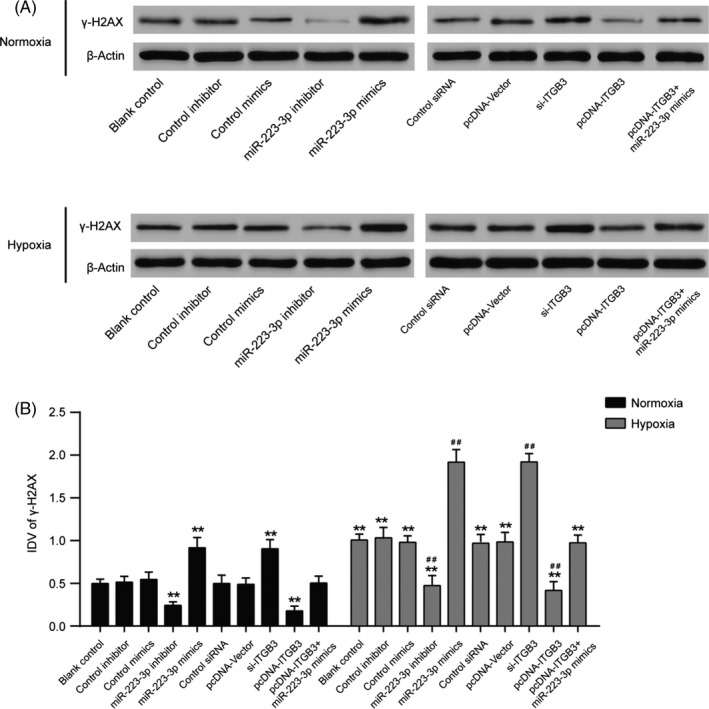
The expression of γ‐H2AX in pulmonary arterial smooth muscle cell (PASMCs) cultured under normal or hypoxic conditions after transfection. The DNA damage sensor γ‐H2AX is expressed at different levels in each group. A, After being cultured in either normoxic or hypoxic conditions for 36 h, a Western blot assay was performed to measure the protein level in all groups. B, Relative integrated density value (IDV) analysis of γ‐H2AX. Data were representative of three independent experiments. **P < 0.01 compared with the blank control in the normoxia treatment group; ## P < 0.01 compared with the blank control in the hypoxia group
3.6. The expression of α‐SMA in PASMCs cultured under normal or hypoxic condition after transfection
Transfected cells were incubated under normal or hypoxic conditions, and then, the total proteins were extracted. Because the phenotypic modulation of pulmonary artery smooth muscle cells (PASMCs) can be triggered by hypoxia,32, 33 and α smooth muscle actin (α‐SMA), a phenotype marker of PASMCs, is the first known protein to be expressed during the differentiation of the smooth muscle cell (SMC) in development,34 Western blot was employed to evaluate the protein expression of α‐SMA. As shown in Figure 12A,B, after cells were incubated in a hypoxic environment, α‐SMA expression decreased significantly, indicating a phenotypic change. Importantly, both the suppression of ITGB3 and the elevated expression of miR‐223‐3p promoted the expression of α‐SMA induced by hypoxia. Moreover, overexpression of miR‐223‐3p attenuated the impact of pcDNA‐ITGB3 in both the normoxia and hypoxia group.
Figure 12.
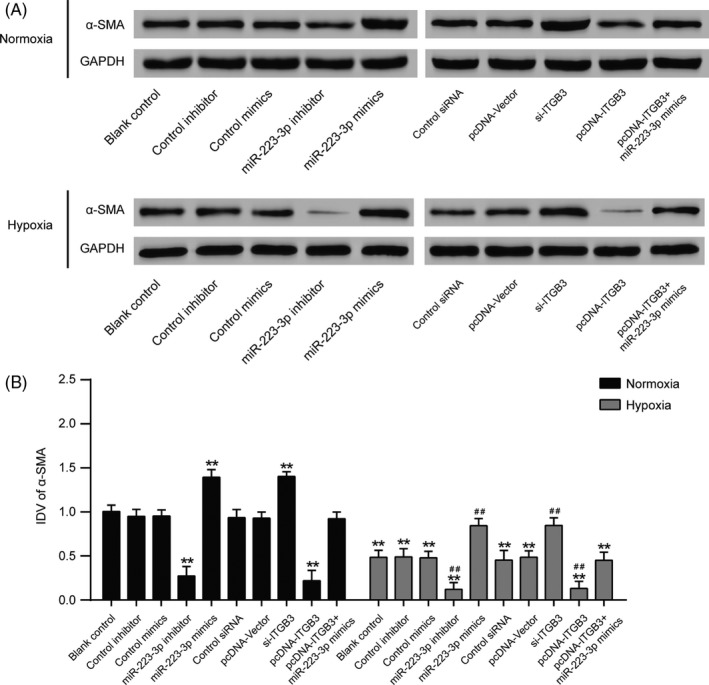
The expression of α‐SMA in pulmonary arterial smooth muscle cell (PASMCs) cultured under normal or hypoxic conditions after transfection. A, After being cultured in either normoxic or hypoxic conditions for 36 h, a Western blot assay was performed to measure the protein levels in all groups. B, Relative integrated density value (IDV) analysis of α‐SMA. All experiments were performed in triplicate. **P < 0.01 compared with the blank control in the normoxia treatment group; ## P < 0.01 compared with the blank control in the hypoxia group
3.7. Rat model building
The lung tissues of the control rats presented were pink with smooth and full surfaces. The rats in the MCT group exhibited clearly reduced activity levels, reduced consumption of food, disordered hair, and cyanotic noses and lips after 2 weeks. The chests were analysed after 4 weeks. The lung tissue was grey with poor elasticity. The right ventricular wall was found to be thickened after the heart was cut. Notably, the agomiR‐223‐3p and sh‐ITGB3 adenovirus transfection groups exhibited higher activity levels and a few bruises at lung tissue surface. However, a situation similar to the control group was observed for the agomiR‐223‐3p and sh‐ITGB3 co‐transfection groups. The observed phenotypes of each group are presented in Table 3. After 4 weeks, weight loss was observed in the MCT group compared with the other group, and the co‐transfection group was healthier overall compared with the sh‐ITGB3 adenovirus transfection group. Moreover, the weight of the rats in the co‐transfection group was close to that of the rats in the control group. The weight of each group is presented in Table 4.
Table 3.
Phenotypes observed per group
| Normal | MCT |
MCT+ agomiR‐223‐3p |
MCT+ sh‐ITGB3 |
MCT + agomiR‐223‐3p + sh‐ITGB3 | MCT + NC | |
|---|---|---|---|---|---|---|
| Lung tissues | Pink, smooth and full surface | Gray, poor elasticity, bruises | A few bruises | A few bruises | A fewer bruises | Bruises |
| Hair | More orderly | Disordered | Less order | Less order | Ordered | Disordered |
| Nose and lips | Pink | Cyanotic | Mauve | Mauve | Almost pink | Cyanotic |
| Right ventricular wall | Thin | Thickest | Thicker | Thicker | Thick | Thickest |
Table 4.
Weight of rats in indicated groups
| Group | Baseline (g) | Week 2 (g) | Week 4 (g) |
|---|---|---|---|
| Normal | 224.41 ± 7.92 | 241.85 ± 10.26 | 266.23 ± 13.81 |
| MCT | 228.14 ± 8.44 | 237.71 ± 7.11 | 239.34 ± 10.13* |
| MCT + agomiR‐223‐3p | 222.18 ± 6.67 | 239.17 ± 8.50 | 256.18 ± 7.75# |
| MCT + sh‐ITGB3 | 225.52 ± 7.05 | 239.88 ± 8.61 | 259.77 ± 9.03# |
| MCT + agomiR‐223‐3p + sh‐ITGB3 | 226.12 ± 6.25 | 236.18 ± 9.20 | 262.71 ± 10.11# |
| MCT + NC | 227.31 ± 8.01 | 235.78 ± 6.76 | 241.62 ± 8.16 |
*P < 0.05 compared with week 4 of normal group; #P < 0.05 compared with week 4 of MCT+NC group.
3.8. Hemodynamic and the index of right ventricular hypertrophy
The levels of mPAP, TRP, EDP and RVSP in the MCT induced rats were elevated compared with the normal rats at 4 weeks, and the right ventricular mass ratio of the rats in the MCT group was also increased (P < 0.01) with obvious pulmonary hypertension. In addition, the CO of the experimental rats was attenuated compared with the normal rats, but the overexpression of miR‐223‐3p and the knockdown of ITGB3 increased the CO compared with the MCT group. The levels of mPAP and RVSP in the rats with overexpressed miR‐223‐3p and downregulated ITGB3 expression were significantly elevated compared with normal control, but the situation was improved obviously compared with MCT group with a lower right ventricular mass ratio (P < 0.05). Moreover, the levels of TRP and EDP in the rats with overexpressed miR‐223‐3p and downregulated ITGB3 expression were significantly elevated, whereas the CO of this group was significantly decreased compared with the normal controls (Figure 13A‐F, P < 0.01).
Figure 13.
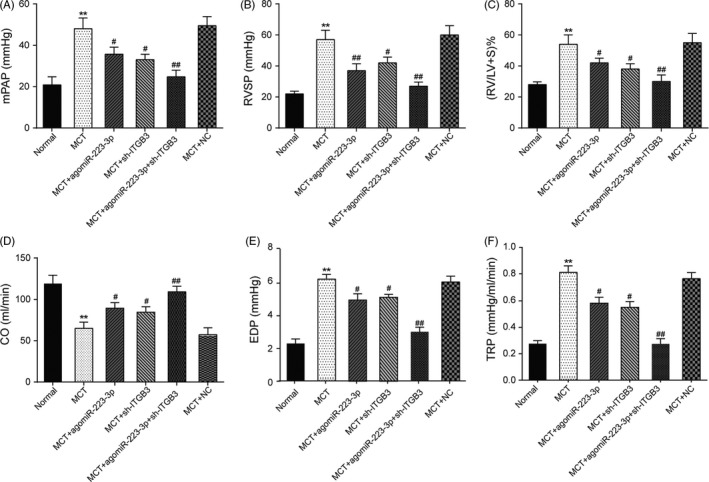
Haemodynamics and the index of right ventricular hypertrophy. A, mean pulmonary arterial pressure (mPAP) levels of each group after 4 wk. B, right ventricular systolic pressure (RVSP) levels of each group after 4 wk. C, Right ventricular mass ratio of each group after 4 wk. D, CO of each group. E, EDP of each group. F, TRP of each group, n = 8 for each group; all experiments were performed in triplicate. **P < 0.01 compared with the normal group; # P < 0.05, ## P < 0.01 compared with the MCT group rats
3.9. MiR‐223‐3p and ITGB3 expression in the pulmonary artery
After 4 weeks, pulmonary artery tissues were collected for the extraction of the total RNA and protein for subsequent analyses. After MCT treatment, miR‐223‐3p expression significantly decreased and ITGB3 mRNA and protein levels increased. Furthermore, treatment with agomiR‐223‐3p resulted in the upregulation of miR‐223‐3p and the suppression of ITGB3. In addition, treatment with the sh‐ITGB3 adenovirus had no effects on miR‐223‐3p expression but hindered ITGB3 expression. Moreover, co‐treatment with both agomiR‐223‐3p and sh‐ITGB3 led to the upregulation of miR‐223‐3p expression and the downregulation of ITGB3 mRNA and protein expression (Figure 14A‐C, P < 0.01). Given that Shi et al reported that miR‐223‐3p was downregulated in the lung and right ventricle (RV) due to hypoxia, and the right ventricle is affected by PAH,35 we investigated the expression of miR‐223‐3p in the right ventricle of the PAH models. The results were consistent with the results in the pulmonary artery (Figure 14D, P < 0.01). Furthermore, immunohistochemical (IHC) analysis demonstrated that ITGB3 expression in the MCT group was higher compared with the normal group, and moreover, lower ITGB3 expression was observed in the agomiR‐223‐3p and sh‐ITGB3 transfection groups. There was an even more obvious decrease in ITGB3 expression in the group that was co‐treated with agomiR‐223‐3p and sh‐ITGB3 (Figure 14E, P < 0.01).
Figure 14.
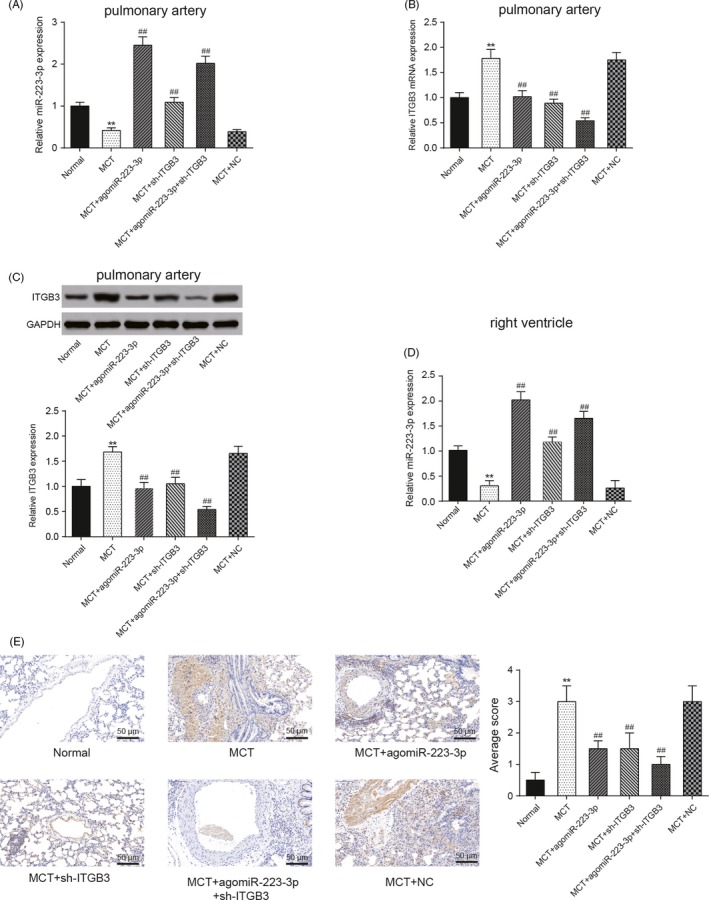
MiR‐223‐3p expression in the pulmonary artery and right ventricle, and ITGB3 expression in the pulmonary artery. A, MiR‐223‐3p expressions in the pulmonary artery of each group, as measured by qRT‐PCR. B, ITGB3 expressions in the pulmonary artery of each group, as measured by qRT‐PCR. C, ITGB3 protein expression in pulmonary artery of each group, as measured by Western blot. D, The miR‐223‐3p expressions of each group in right ventricle. E, IHC analysis of ITGB3 expressions in each group. Monocrotaline (MCT) + NC: MCT + negative control of MCT + agomiR‐223‐3p and MCT + sh‐ITGB3, n = 8 per group; all experiments were performed in triplicate. Magnification ×200, scale bar: 50 µm, **P < 0.01 compared with the normal group; ## P < 0.01 compared with the MCT group
3.10. Pathological features of rat lung tissues and the right ventricular myocardium
Pathological staining of rat lung tissues was performed to investigate the effects of miR‐223‐3p and ITGB3 on rat PAH. First, HE staining revealed severe pulmonary haemorrhage, distinct pulmonary vascular remodelling, severe myocardial tissue haemorrhage and cell morphologic breakage in the MCT group. However, the overexpression of miR‐223‐3p and the silencing of ITGB3 improved the features (Figure 15A). Moreover, severe fibrosis of lung or myocardial tissues occurred in the MCT group. Both the overexpression of miR‐223‐3p and the silencing of ITGB3 attenuated this fibrosis to a degree reflected by Masson and Sirius red‐picric acid staining (Figure 15B,C). Quantitative analysis of H&E staining was performed using the Ashcroft scoring method (Figure 15D). The staining of myocardium tissues was quantified (Figure 15E). Both upregulation of miR‐223‐3p and the silencing of ITGB3 improved this symptom drastically.
Figure 15.
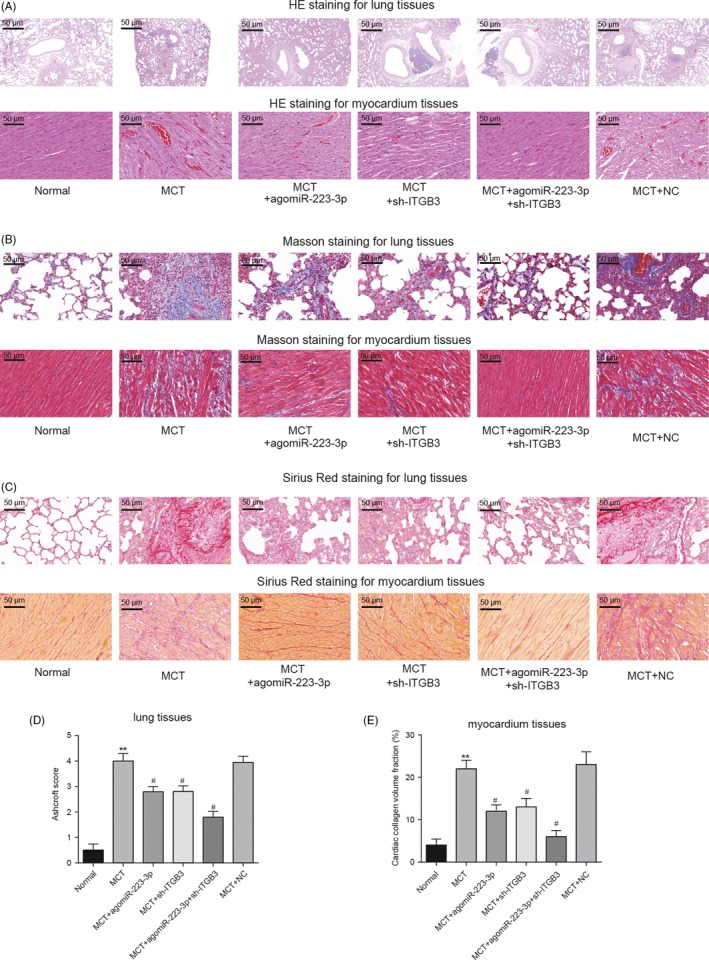
Pathological features of rat lung tissues and right ventricular myocardium. A, Results of HE staining of rat lung tissues and right ventricular myocardium. B, Results of Masson staining of rat lung tissues and right ventricular myocardium. C, Results of Sirius red‐picric acid staining of rat lung tissues and right ventricular myocardium. D, Degree of pulmonary fibrosis was graded and evaluated by the Ashcroft method as described in Materials and Methods. E, Quantitative analysis of collagen volume fraction of myocardium tissues HE: nucleus (blue); cytoplasm (pink); collagen fibres (light pink); erythrocyte (orange). Masson: collagen fibres (blue); muscle fibres (red); nucleus (dark blue); Sirius red‐picric acid: collagen fibres (red); nucleus (green); other yellow, n = 8 per group; all experiments were performed in triplicate. Magnification ×200, scale bar: 50 µm, **P < 0.01 compared with the normal group; # P < 0.05 compared with the MCT group
4. DISCUSSION
Our study demonstrated the roles of miR‐223‐3p and ITGB3 in PAH. MiR‐223‐3p was downregulated, while ITGB3 was upregulated in PAH. MiR‐223‐3p attenuated the progression of PAH by suppressing proliferation and decreasing α‐SMA expression in PASMCs, a key cell type constituting the vascular wall of small pulmonary arteries and contributing to pulmonary vascular remodelling.36 To ensure that our preclinical findings are consistent with future clinical studies, according to the latest guidelines of optimal methods and more stringent study in PAH36 and key principles and guidelines for reporting preclinical research delivered by the National Institutes of Health,37 both in vitro and in vivo experiments are important. In our study, the experiments related to PAH were carried out in vivo and in vitro; for example, comprehensive haemodynamics were detected. The results revealed that miR‐223‐3p reduced the levels of mPAP, TRP, EDP and RVSP while increasing the CO of rat models and improving the pathological features caused by MCT. Compared with miR‐223‐3p, ITGB3 exerted an opposite effect on PAH, remarkably promoting the development of PAH. Moreover, PASMCs were studied in vitro after hypoxia treatment. MiR‐223‐3p inhibited the viability of PASMCs and promoted the apoptosis of PASMCs. In contrast, ITGB3 promoted the proliferation of PASMCs. Furthermore, our research design was carefully considered, our methodology was well founded, and reasonable interpretation of the data was made to ensure the accuracy of the results.
Previous studies have verified that several miRNAs are differentially expressed and play important roles in PAH. MiR‐206 levels were reported by Jalali et al38 to be downregulated in PAH mice. Rhodes et al39 reported that miR‐150 levels exhibited the greatest reduction and were associated with survival in patients with PAH. As a significantly downregulated miRNA in PAH, miR‐223‐3p warrants investigation.
The functions of miR‐223‐3p in PAH were revealed in this study, which provided novel insights into the mechanism of PAH; very few studies have reported the effect of miR‐223‐3p. The upregulation of miR‐223‐3p inhibited the viability of PASMCs, promoted the apoptosis of PASMCs and reduced PAH symptoms in rats injected with MCT. Previous research showed that DNA damage can induce the apoptosis of cells.40, 41 Therefore, we investigated the expression of γ‐H2AX, a DNA damage marker. The results revealed that the expression of γ‐H2AX was increased along with the increase in apoptosis under hypoxic conditions. These results were consistent with the report by Meloche.9 MiR‐223‐3p was reported to have an anti‐tumour role in head and neck squamous cell carcinoma and osteosarcoma and suppresses angiogenesis or cell metastasis via targeting cadherin‐6 (CDH6) and other targets.42, 43 In this study, we proposed that miR‐223‐3p targets ITGB3 to participate in the process of PAH.
Current researches provide little evidence of the relationship between miR‐223‐3p and ITGB3 in the context of PAH. Earlier studies reported the targeting relationship between miR‐223‐3p and PARP‐19 , 44 and IGF‐IR30 Therefore, we investigated the expression of PARP‐1 and IGF‐IR Our results showed that the overexpression of miR‐223‐3p suppressed the hypoxia‐induced expression of PARP‐1 and IGF‐IR, which was consistent with earlier research. Furthermore, ITGB3, which may be a target of miR‐223‐3p, is known to participate in cell adhesion as well as cell surface‐mediated signalling. Other cell adhesion molecules, such as CD44, play critical roles in PAH.45 Current studies have verified that ITGB3 influences cancer cell proliferation and migration.10, 46, 47 Ni et al10 verified that upon restoring the expression of ITGB3, the effect of miR‐98 on non‐small‐cell lung cancer cell proliferation was partially reversed. Our results support the hypothesis that ITGB3 promotes the proliferation of PASMCs, and confirm that the knockdown of ITGB3 effectively alleviates PAH progression.
Limitations exist in this study, and further experiments are required to identify the exact mechanism through which miR‐223‐3p and ITGB3 modulate cell proliferation and migration. MicroRNA‐based therapies will require validation at the clinical level. The extracellular matrix (ECM) reporter interaction is also unclear.
MiR‐223‐3p was downregulated in PAH, while ITGB3 was upregulated. MiR‐223‐3p attenuated the proliferation of PASMCs and the PAH symptoms in rats induced by MCT, whereas ITGB3 promoted the deterioration caused by PAH. These data suggested that miR‐223‐3p and ITGB3 are involved in PAH, and these results uncovered for the first time that miR‐223‐3p inhibits PAH by targeting ITGB3. These findings may provide a new therapeutic target for the treatment of PAH.
ETHICAL APPROVAL
All procedures performed in studies involving animals were in accordance with the ethical standards Beijing Anzhen Hospital.
CONFLICT OF INTEREST
The authors confirm that there is no conflict of interest.
AUTHOR CONTRIBUTIONS
Aijun Liu and Yifan Liu critically revised the manuscript; Bin Li and Ming Yang substantially contributed to the conception and design of the work, and drafted the manuscript; Yang Liu and Junwu Su involved in acquisition, analysis and interpretation of the data; Aijun Liu and Yifan Liu revised the manuscript critically, final approval of the version to be published. All authors have read and approved the final article.
Liu A, Liu Y, Li B, Yang M, Liu Y, Su J. Role of miR‐223‐3p in pulmonary arterial hypertension via targeting ITGB3 in the ECM pathway. Cell Prolif. 2019;52:e12550 10.1111/cpr.12550
Aijun Liu and Yifan Liu contributed equally to this work.
REFERENCES
- 1. Thenappan T, Ormiston ML, Ryan JJ, Archer SL. Pulmonary arterial hypertension: pathogenesis and clinical management. BMJ 2018:360:j5492. [DOI] [PMC free article] [PubMed] [Google Scholar]
- 2. Li L, Kim IK, Chiasson V, Chatterjee P, Gupta S. NF‐kappaB mediated miR‐130a modulation in lung microvascular cell remodeling: implication in pulmonary hypertension. Exp Cell Res. 2017;359:235‐242. [DOI] [PubMed] [Google Scholar]
- 3. Negi V, Chan SY. Discerning functional hierarchies of microRNAs in pulmonary hypertension. JCI Insight. 2017;2:e91327. [DOI] [PMC free article] [PubMed] [Google Scholar]
- 4. Perrin S, Chaumais MC, O'Connell C, et al. New pharmacotherapy options for pulmonary arterial hypertension. Expert Opin Pharmacother. 2015;16:2113‐2131. [DOI] [PubMed] [Google Scholar]
- 5. Wang D, Zhang H, Li M, et al. MicroRNA‐124 controls the proliferative, migratory, and inflammatory phenotype of pulmonary vascular fibroblasts. Circ Res. 2014;114:67‐78. [DOI] [PMC free article] [PubMed] [Google Scholar]
- 6. Kim J, Kang Y, Kojima Y, et al. An endothelial apelin‐FGF link mediated by miR‐424 and miR‐503 is disrupted in pulmonary arterial hypertension. Nat Med. 2013;19:74‐82. [DOI] [PMC free article] [PubMed] [Google Scholar]
- 7. Sarrion I, Milian L, Juan G, et al. Role of circulating miRNAs as biomarkers in idiopathic pulmonary arterial hypertension: possible relevance of miR‐23a. Oxid Med Cell Longev 2015:2015:792846. [DOI] [PMC free article] [PubMed] [Google Scholar]
- 8. Courboulin A, Paulin R, Giguere NJ, et al. Role for miR‐204 in human pulmonary arterial hypertension. J Exp Med. 2011;208:535‐548. [DOI] [PMC free article] [PubMed] [Google Scholar]
- 9. Meloche J, Le Guen M, Potus F, et al. miR‐223 reverses experimental pulmonary arterial hypertension. Am J Physiol Cell Physiol. 2015;309:C363‐C372. [DOI] [PubMed] [Google Scholar]
- 10. Ni R, Huang Y, Wang J. miR‐98 targets ITGB3 to inhibit proliferation, migration, and invasion of non‐small‐cell lung cancer. Onco Targets Ther. 2015;8:2689‐2697. [DOI] [PMC free article] [PubMed] [Google Scholar]
- 11. Chen G, Zuo S, Tang J, et al. Inhibition of CRTH2‐mediated Th2 activation attenuates pulmonary hypertension in mice. J Exp Med. 2018;215:2175‐2195. [DOI] [PMC free article] [PubMed] [Google Scholar]
- 12. Fouty BW, Grimison B, Fagan KA, et al. p27(Kip1) is important in modulating pulmonary artery smooth muscle cell proliferation. Am J Respir Cell Mol Biol. 2001;25:652‐658. [DOI] [PubMed] [Google Scholar]
- 13. Fukai K, Nakamura A, Hoshino A, et al. Pyk2 aggravates hypoxia‐induced pulmonary hypertension by activating HIF‐1alpha. Am J Physiol Heart Circ Physiol. 2015;308:H951‐H959. [DOI] [PubMed] [Google Scholar]
- 14. Cao P, Cai X, Lu W, Zhou F, Huo J. Growth inhibition and induction of apoptosis in SHG‐44 glioma cells by Chinese medicine formula "Pingliu Keli". Evid Based Complement Alternat Med. 2011;2011:1‐9. [DOI] [PMC free article] [PubMed] [Google Scholar]
- 15. Das S, Lin D, Jena S, et al. Protection of retinal cells from ischemia by a novel gap junction inhibitor. Biochem Biophys Res Commun. 2008;373:504‐508. [DOI] [PMC free article] [PubMed] [Google Scholar]
- 16. Shi R, Zhu D, Wei Z, et al. Baicalein attenuates monocrotaline‐induced pulmonary arterial hypertension by inhibiting endothelial‐to‐mesenchymal transition. Life Sci. 2018;207:442‐450. [DOI] [PubMed] [Google Scholar]
- 17. Peng Q, Zhou Q, Zhou J, Zhong D, Pan F, Liang H. Stable RNA interference of hexokinase II gene inhibits human colon cancer LoVo cell growth in vitro and in vivo. Cancer Biol Ther. 2008;7:1128‐1135. [DOI] [PubMed] [Google Scholar]
- 18. Chen LB, Xu JY, Yang Z, Wang GB. Silencing SMYD3 in hepatoma demethylates RIZI promoter induces apoptosis and inhibits cell proliferation and migration. World J Gastroenterol. 2007;13:5718‐5724. [DOI] [PMC free article] [PubMed] [Google Scholar]
- 19. Hong Z, Chen KH, DasGupta A, et al. MicroRNA‐138 and MicroRNA‐25 down‐regulate mitochondrial calcium Uniporter, causing the pulmonary arterial hypertension cancer phenotype. Am J Respir Crit Care Med. 2017;195:515‐529. [DOI] [PMC free article] [PubMed] [Google Scholar]
- 20. Potus F, Ruffenach G, Dahou A, et al. Downregulation of MicroRNA‐126 contributes to the failing right ventricle in pulmonary arterial hypertension. Circulation. 2015;132:932‐943. [DOI] [PubMed] [Google Scholar]
- 21. Potus F, Malenfant S, Graydon C, et al. Impaired angiogenesis and peripheral muscle microcirculation loss contribute to exercise intolerance in pulmonary arterial hypertension. Am J Respir Crit Care Med. 2014;190:318‐328. [DOI] [PubMed] [Google Scholar]
- 22. Meloche J, Pflieger A, Vaillancourt M, et al. Role for DNA damage signaling in pulmonary arterial hypertension. Circulation. 2014;129:786‐797. [DOI] [PubMed] [Google Scholar]
- 23. Goldner J. A modification of the masson trichrome technique for routine laboratory purposes. Am J Pathol. 1938;14:237‐243. [PMC free article] [PubMed] [Google Scholar]
- 24. Gong Y, Yang Y, Wu Q, et al. Activation of LXRalpha improves cardiac remodeling induced by pulmonary artery hypertension in rats. Sci Rep. 2017:7:6169. [DOI] [PMC free article] [PubMed] [Google Scholar]
- 25. Ashcroft T, Simpson JM, Timbrell V. Simple method of estimating severity of pulmonary fibrosis on a numerical scale. J Clin Pathol. 1988;41:467‐470. [DOI] [PMC free article] [PubMed] [Google Scholar]
- 26. Zhao YZ, Zhang M, Tian XQ, Zheng L, Lu CT. Using basic fibroblast growth factor nanoliposome combined with ultrasound‐introduced technology to early intervene the diabetic cardiomyopathy. Int J Nanomedicine. 2016;11:675‐686. [DOI] [PMC free article] [PubMed] [Google Scholar]
- 27. Wu RN, Yu TY, Zhou JC, et al. Targeting HMGB1 ameliorates cardiac fibrosis through restoring TLR2‐mediated autophagy suppression in myocardial fibroblasts. Int J Cardiol. 2018;267:156‐162. [DOI] [PubMed] [Google Scholar]
- 28. Yan M, Chen K, He L, Li S, Huang D, Li J. Uric acid induces cardiomyocyte apoptosis via activation of calpain‐1 and endoplasmic reticulum stress. Cell Physiol Biochem. 2018;45:2122‐2135. [DOI] [PubMed] [Google Scholar]
- 29. Franasiak JM, Holoch KJ, Yuan L, Schammel DP, Young SL, Lessey BA. Prospective assessment of midsecretory endometrial leukemia inhibitor factor expression versus alphanubeta3 testing in women with unexplained infertility. Fertil Steril. 2014;101:1724‐1731. [DOI] [PMC free article] [PubMed] [Google Scholar]
- 30. Shi L, Kojonazarov B, Elgheznawy A, et al. miR‐223‐IGF‐IR signalling in hypoxia‐ and load‐induced right‐ventricular failure: a novel therapeutic approach. Cardiovasc Res. 2016;111:184‐193. [DOI] [PubMed] [Google Scholar]
- 31. Poehlmann A, Reissig K, Just A, et al. Non‐apoptotic function of caspases in a cellular model of hydrogen peroxide‐associated colitis. J Cell Mol Med. 2013;17:901‐913. [DOI] [PMC free article] [PubMed] [Google Scholar]
- 32. Zhou W, Negash S, Liu J, Raj JU. Modulation of pulmonary vascular smooth muscle cell phenotype in hypoxia: role of cGMP‐dependent protein kinase and myocardin. Am J Physiol Lung Cell Mol Physiol. 2009;296:L780‐L789. [DOI] [PMC free article] [PubMed] [Google Scholar]
- 33. Howell K, Preston RJ, McLoughlin P. Chronic hypoxia causes angiogenesis in addition to remodelling in the adult rat pulmonary circulation. J Physiol. 2003;547:133‐145. [DOI] [PMC free article] [PubMed] [Google Scholar]
- 34. Owens GK, Kumar MS, Wamhoff BR. Molecular regulation of vascular smooth muscle cell differentiation in development and disease. Physiol Rev. 2004;84:767‐801. [DOI] [PubMed] [Google Scholar]
- 35. Gubrij IB, Pangle AK, Pang L, Johnson LG. Reversal of microRNA dysregulation in an animal model of pulmonary hypertension. PLoS ONE. 2016:11:e0147827. [DOI] [PMC free article] [PubMed] [Google Scholar]
- 36. Bonnet S, Provencher S, Guignabert C, et al. Translating research into improved patient care in pulmonary arterial hypertension. Am J Respir Crit Care Med. 2017;195:583‐595. [DOI] [PMC free article] [PubMed] [Google Scholar]
- 37. Provencher S, Archer SL, Ramirez FD, et al. Standards and methodological rigor in pulmonary arterial hypertension preclinical and translational research. Circ Res. 2018;122:1021‐1032. [DOI] [PubMed] [Google Scholar]
- 38. Jalali S, Ramanathan GK, Parthasarathy PT, et al. Mir‐206 regulates pulmonary artery smooth muscle cell proliferation and differentiation. PLoS ONE. 2012:7:e46808. [DOI] [PMC free article] [PubMed] [Google Scholar]
- 39. Rhodes CJ, Wharton J, Boon RA, et al. Reduced microRNA‐150 is associated with poor survival in pulmonary arterial hypertension. Am J Respir Crit Care Med. 2013;187:294‐302. [DOI] [PubMed] [Google Scholar]
- 40. Phesse TJ, Myant KB, Cole AM, et al. Endogenous c‐Myc is essential for p53‐induced apoptosis in response to DNA damage in vivo. Cell Death Differ. 2014;21:956‐966. [DOI] [PMC free article] [PubMed] [Google Scholar]
- 41. Zhang YH, Li HD, Li B, Jiang SD, Jiang LS. Ginsenoside Rg3 induces DNA damage in human osteosarcoma cells and reduces MNNG‐induced DNA damage and apoptosis in normal human cells. Oncol Rep. 2014;31:919‐925. [DOI] [PubMed] [Google Scholar]
- 42. Ji Q, Xu X, Song Q, et al. miR‐223‐3p inhibits human osteosarcoma metastasis and progression by directly targeting CDH6. Mol Ther. 2018;26:1299‐1312. [DOI] [PMC free article] [PubMed] [Google Scholar]
- 43. Bozec A, Zangari J, Butori‐Pepino M, et al. MiR‐223‐3p inhibits angiogenesis and promotes resistance to cetuximab in head and neck squamous cell carcinoma. Oncotarget. 2017;8:57174‐57186. [DOI] [PMC free article] [PubMed] [Google Scholar]
- 44. Liu X, Deng Y, Xu Y, Jin W, Li H. MicroRNA‐223 protects neonatal rat cardiomyocytes and H9c2 cells from hypoxia‐induced apoptosis and excessive autophagy via the Akt/mTOR pathway by targeting PARP‐1. J Mol Cell Cardiol. 2018;118:133‐146. [DOI] [PubMed] [Google Scholar]
- 45. Ohta‐Ogo K, Hao H, Ishibashi‐Ueda H, et al. CD44 expression in plexiform lesions of idiopathic pulmonary arterial hypertension. Pathol Int. 2012;62:219‐225. [DOI] [PubMed] [Google Scholar]
- 46. Hu L, Zang MD, Wang HX, et al. G9A promotes gastric cancer metastasis by upregulating ITGB3 in a SET domain‐independent manner. Cell Death Dis. 2018:9:278. [DOI] [PMC free article] [PubMed] [Google Scholar]
- 47. Zhang N, Ma D, Wang L, et al. Insufficient radiofrequency ablation treated hepatocellular carcinoma cells promote metastasis by up‐regulation ITGB3. J Cancer. 2017;8:3742‐3754. [DOI] [PMC free article] [PubMed] [Google Scholar]


