

Abstract
Objective: In recent years, support has increased for the notion that a subpopulation of brain tumour cells in possession of properties typically characteristic of stem cells is responsible for initiating and maintaining the tumour. Unravelling details of the brain tumour stem cell (BTSC) hierarchy, as well as interactions of these cells with various therapies, will be essential in the design of optimal treatment strategies.
Materials and methods: Motivated by this, we have developed a mathematical model of the BTSC hypothesis that may aid in characterization of brain tumours, as well as in prediction of effective therapeutic strategies, which can be further validated in experimental and clinical studies. At the level of a small number of cells, the model developed herein is stochastic. For larger populations of cancer cells, the model is handled from a deterministic approach.
Results and conclusions: In the stochastic regime, importance of a relationship between the likelihoods of two distinct types of symmetric BTSC divisions in determining BTSC survival rates becomes apparent, consequently emphasizing the need for a set of biomarkers that are able to better characterize the BTSC hierarchy. At the large scale, we predict the importance of the aforementioned symmetric division rates in dictating brain tumour composition. Furthermore, we demonstrate possible therapeutic benefits of considering combination treatments of radiotherapy and putative BTSC inhibitors, such as bone morphogenetic proteins, while reinforcing the importance of developing novel treatment strategies that specifically target the BTSC subpopulation.
Introduction
While prognoses for many types of cancer have improved in recent years as diligent research has led to better diagnostic and treatment techniques, brain tumours remain consistently devastating in both adults and children. Cancers of the brain and spinal cord are the second most common cause of cancer mortality in children (National Cancer Institute of Canada data: http://www.ncic.cancer.ca). In adults, median patient survival time following diagnosis of the most prevalent type of brain cancer, glioblastoma multiforme (GBM), is a dismal 6–12 months, not significantly improved upon over the last few decades (1). The failure of standard treatment strategies consisting of surgical resection followed by radiation and/or chemotherapy to substantially improve patient outcomes reflects the fact that mechanisms driving human brain tumour growth, as well as interactions of cancer cells with their micro‐environment and with therapeutics, are not yet well understood. In order to explain clinical and experimental results, including shortcomings of conventional treatments, much recent research has focused on the study of brain tumour development and growth in terms of stem cell biology.
The cancer stem cell hypothesis states that tumours are initiated and maintained by a (typically small) subset of cancer cells in possession of certain defining properties of stem cells – namely, the abilities to self‐renew and to produce differentiated cells of various lineages (2). Existence of acute myeloid leukaemia stem cells has been firmly established [see Lapidot et al. (3) and Bonnet & Dick (4)]; more recently, putative cancer stem cells have been identified in many solid tumours, which include breast (5), colon (6, 7) and brain cancers (8, 9, 10, 11, 12). In 2003, brain tumour cells expressing the CD133 cell surface protein marker [also found on normal neural stem cells (13)] were identified as brain tumour stem cells (BTSC) based on their exclusive ability to commence and support tumour growth (11). These CD133+ cells, isolated from human brain tumours, were able to generate tumours with the phenotypic signature of the original human malignancy when transplanted in small numbers (as low as 100) into brains of non‐obese diabetic/severe combined immunodeficient mice. Importantly, CD133− cells were unable to initiate tumorigenesis in mice, even when transplanted in numbers on the order of tens of thousands. Such demonstrations of tumorigenicity on xenografting into immunocompromised mice remain the gold‐standard assay in identification and classification of cancer stem cells (14).
The unique ability of certain cells to both drive and maintain tumour growth appears to be a function of these cells’ capacity for two distinct types of self‐renewal (15). Stem cells can undergo symmetric self‐renewal, cell division in which both daughters possess the stem cell characteristics of the mother stem cell, resulting in expansion of the stem cell population, or asymmetric self‐renewal in which one stem cell (which we denote by S) and one progenitor cell (denoted P) are produced [see, for example, fig. 2 of Dirks (16)]. In terms of the mathematical model to be developed herein, this translates to the assumption that symmetric self‐renewal occurs (represented schematically as S→S+S) with some probability r 1, while with probability r 2 a stem cell divides asymmetrically (S→S+P). In addition to self‐renewal, stem cells can permit symmetric proliferation, yielding two daughter progenitor cells (S→P+P) with probability r 3= 1 –r 1–r 2. The overall stem cell division rate ρS represents the frequency with which each stem cell undergoes any one of the aforementioned mitotic events, and in general may depend on the cell populations.
Figure 2.

Survival rate rsurv vs. time, for various values of r1, r2 and r3 with r=r1–r3= 0.05 fixed for the purpose of comparison.ΓS = 0, and the initial number of cells is nS= 1. Dashed lines are obtained from eqn (3). Note that as T grows large, the curves tend to 1 – (r 3/r 1), as expected. Data points are from 100 000 realizations of the Gillespie algorithm.
Progenitor cells differ from stem cells in that they have limited proliferative potential and limited ability to differentiate. Typically, an early (relatively immature) progenitor will divide into later (more mature) progenitors, undergoing only several rounds of self‐renewing cell division before terminally differentiating. While the precise mechanisms of this process are more complicated, the important effect is an amplification of the number of mature cells (denoted M) [these progenitor cells are sometimes termed ‘transit amplifying’ cells (17)].
The question of how such cancer stem cells originate is unresolved – they could potentially be the product of genetic or epigenetic mutations in normal stem cells, progenitors, or differentiated cells (18). While each of these hypotheses remains viable, the first seems most likely as stem cells have the longevity that may be necessary in order to accumulate oncogenic mutations, and already have functioning self‐renewal pathways. Progenitors and mature cells, on the other hand, are relatively short‐lived and would require that these self‐renewal pathways become activated (16).
While identifying the origins of cancer stem cells remains important from many points of view, the cancer stem cell hypothesis helps to explain certain phenomena independent of these details. The fact that many patients with metastasized cancer cells do not develop metastatic disease can be accounted for by considering a paradigm in which only the metastasis of cancer stem cells can result in new tumour growth (18). Along similar lines, treatments that aim to indiscriminately destroy tumour cells in bulk may fail to consistently provide a cure because they spare a subpopulation of cancer stem cells. Consistent with the latter proposition is the observation that human CD133+ glioma cells exhibit radioresistance due to preferential activation of the DNA damage checkpoint response – in particular, the fraction of CD133+ glioma cells has recently been found to be enriched following treatment with ionizing radiation, both in vitro and in the brains of immunocompromised mice (19).
Another treatment possibility may soon emerge, as Piccirillo et al. (20) have recently demonstrated that certain bone morphogenetic proteins (BMPs) are capable of inducing CD133+ human GBM cells to differentiate and adopt a CD133− cell phenotype, both in culture and, more importantly, in the brains of mice (20). Thus, pharmacological application of BMPs to brain tumours may direct BTSCs to differentiate into cells that are more vulnerable to traditional anti‐cancer treatments (i.e. radiotherapy and chemotherapy). It is becoming increasingly clear that, under the brain cancer stem cell hypothesis, any potentially curative therapy must target BTSCs. The depletion of the cancer stem cell pool via induced differentiation represents one promising strategy. A second approach may be to design drugs that neutralize the key mechanisms that lend BTSCs their capacity to drive tumour growth. In particular, recent mathematical modelling has given support to the notion that an increase in symmetric self‐renewal of cancer stem cells is a condition necessary to explain the observed cell populations in colorectal cancer (21).
Other such continuous cell population dynamics models have provided insights into the dynamics of stem cell hierarchies, including the seminal work of Wichmann and Loeffler on the haematopoietic system (22), Michor et al. (23) in analysing the dynamics of treatment of chronic myeloid leukaemia, and Johnston et al. (24) on colorectal cancer. Several groups have undertaken mathematical examinations of glioma behaviour independent of the cancer stem cell hypothesis. Examples include the work of Swanson and colleagues, who have applied a reaction‐diffusion model to account for the proliferation and diffusion of a homogeneous population of glioma cells in a heterogeneous brain domain (see, e.g. 25), and that of Sander and colleagues, who have studied in vitro glioma cell invasion using a continuous model in which core and invasive cancer cells are treated as distinct subpopulations (26). The deterministic cell compartment approach of Wichmann and Loeffler has subsequently been adopted and modified by Ganguly and Puri to describe brain tumour growth according to the cancer stem cell hypothesis (27, 28). Here, we instead develop a discrete stochastic model in order to shed light on some of the mechanisms driving brain tumour growth as well as the implications of these mechanisms on treatment strategies. Such an approach allows us to incorporate the inherent stochasticity of biological phenomena and, more importantly, allows for meaningful examination of small numbers of cells, where a deterministic method fails. A similar technique was employed, for example, in modelling cell populations in normal murine epidermal homeostasis (29).
The model
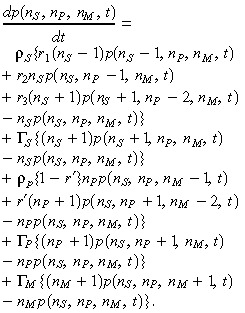
Considering the three types of BTSC divisions with associated probabilities discussed above, we define p (nS, nP, t) as the probability that there are exactly nS BTSCs and nP progenitor cells present at time t. This probability is governed by the following master equation:
 |
(1) |
with initial condition p(nS, nP, 0) =δ(nS,  )δ(nP,
  ), where and are the initial numbers of stem and progenitor cells, respectively. Note that p(nS, nP, t) is indeed the conditional probability p(nS, nP, t | , , 0) of observing the state (nS, nP) at time t, given (, ) at time t= 0. For simplicity, however, we drop the full notation of the conditional probability [as is done, for example, by van Kampen (30)]. The parameters ΓS and ΓP represent rates of apoptosis of BTSCs and progenitors, respectively. Exact solutions of equations such as eqn (1) are typically unknown; consequently, numerical simulation is the method of choice for obtaining solutions.
We have begun by formulating the stochastic master equation, and our strategy will be to perform some analysis on this before deriving from it a set of deterministic equations describing the time evolution of the average values of nS and nP. While a study of these deterministic equations is particularly appropriate and efficient when large numbers of cells are under consideration, examination of the master eqn (1) is prudent when dealing with situations in which small numbers of cells are present, such as may be the case in vitro and during the early stages of tumour formation. In these cases, stochastic fluctuations may be extremely important and cannot be neglected. As a motivating example, Sachs et al. (31) considered stochastic fluctuations in the number of clonogenic tumour cells near the end of a course of radiotherapy (at which time, it is expected that the number of such cells has been decimated to a small value). They determined that the timing of dose delivery is important in dictating tumour control probability, a result that would have escaped deterministic analysis.
The difficulties in analytically solving eqn (1) are circumvented by using the exact stochastic simulation algorithm described by Gillespie (32). The Gillespie algorithm is a relatively straightforward Monte Carlo‐based technique that simulates the time evolution of the populations described by eqn (1) without directly solving the master equation. A run of the algorithm consists of calculating the time and nature of the next event, and then updating the system proportionately. The process is then repeated many times (i.e. for a large number of realizations) to obtain the relevant stochastic quantities. The Gillespie algorithm has been extensively used in the study of chemical kinetics for decades, and is being used increasingly in biological frameworks, for example, in studies of gene expression (33). Examples of probability distributions obtained via this method are shown in Fig. 1.
Figure 1.
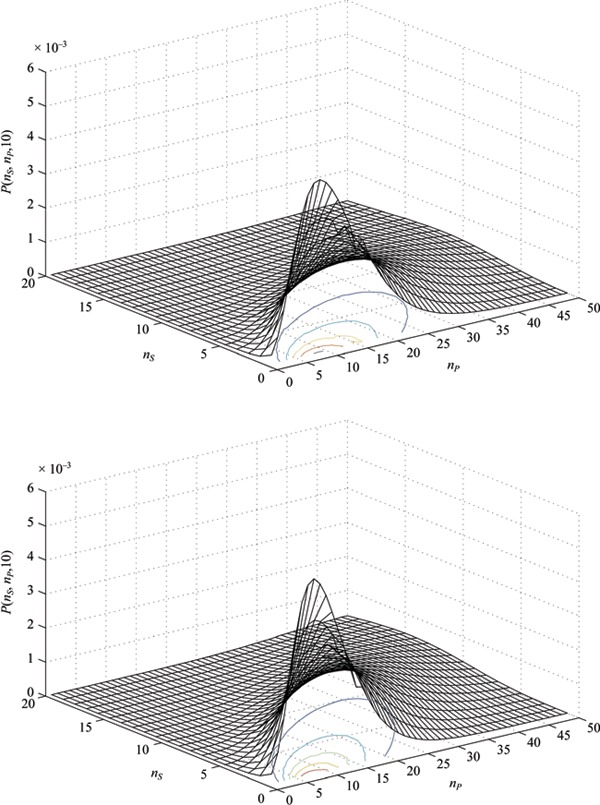
Example probability distributions at time T=ρSt= 10 generated from the master equation ( eqn 1 ) using the Gillespie algorithm. (a) r=r 1–r 3= 0.15 and r 2= 0.55. (b) r=r 1–r 3= 0.20 and r 2= 0.60.
An advantage of the stochastic approach is that it allows for the possibility of a small population of cells becoming extinct after some period of time. One quantity of particular interest is the survival rate r surv, which we define as the proportion of realizations of the stochastic process described by eqn (1) that do not result in extinction of S‐type cells (and, thus, extinction of the tumour, since we assume that P‐type cells alone cannot regenerate the tumour). Using the Gillespie algorithm to simulate experiments in which a single stem cell is left to divide (for various values of the parameters r 1, r 2, and r 3), we can plot r surv against time (Fig. 2).
In order to understand these simulation results, we can use a simple analytical approach to find an expression for r surv. Consider the birth–death process associated with S‐type cells in isolation. The only type of division that increases the stem cell population by one is symmetric self‐renewal, which occurs with birth rate λ=ρS r 1. Both symmetric differentiation and stem cell death decrease the stem cell population by one and, thus, we have death rate µ=ρS r 3+ΓS. This birth–death process is governed by the master equation (34):
 |
(2) |
for nS≥ 1 [with dp(0, t)/dt=µp(1, t)]. Eqn (2) can be solved using the method of generating functions, described, for example, by Bailey (34). We are particularly interested in the quantity 1 –p(0, t), which is the probability that at least one S‐type cell is surviving at time t (i.e. r surv). We find that
 |
(3) |
The long‐term tumour survival rate may be particularly useful; this is found by taking the limit as t→∝ of eqn (3). In the particular case that ΓS is negligibly small, we see that  (when r
1 > r
3 and 0 otherwise) as t→∝. This is in agreement with our numerical simulations (Fig. 2). Thus, the model makes the somewhat encouraging prediction that the occurrence of a single cancer stem cell will not necessarily result in a tumour, even if the probability of self‐renewal is greater than that of differentiation. As a numerical example, consider the case in which oncogenic transformation results in the presence of a single cancer stem cell with characteristic division probabilities r
1= 0.4, r
2= 0.3, and r
3= 0.3: this cell has only a 25% chance of forming a lasting colony (i.e. a tumour). This is in contrast to the exponential growth that is predicted by a deterministic model [d < nS >/dt = (λ – µ) < nS >, see also below] for the same parameter values, again emphasizing the role of fluctuations in small populations. It is worthwhile to comment that the resulting < nS > and
(when r
1 > r
3 and 0 otherwise) as t→∝. This is in agreement with our numerical simulations (Fig. 2). Thus, the model makes the somewhat encouraging prediction that the occurrence of a single cancer stem cell will not necessarily result in a tumour, even if the probability of self‐renewal is greater than that of differentiation. As a numerical example, consider the case in which oncogenic transformation results in the presence of a single cancer stem cell with characteristic division probabilities r
1= 0.4, r
2= 0.3, and r
3= 0.3: this cell has only a 25% chance of forming a lasting colony (i.e. a tumour). This is in contrast to the exponential growth that is predicted by a deterministic model [d < nS >/dt = (λ – µ) < nS >, see also below] for the same parameter values, again emphasizing the role of fluctuations in small populations. It is worthwhile to comment that the resulting < nS > and  from eqn (2) grow exponentially (see Appendix), while the relative standard deviation (defined as the ratio of the standard deviation σ to the mean) for the population of BTSCs is inversely proportional to the square root of the initial number of BTSCs. Thus, we expect that for larger values of , realizations of the stochastic process defined by eqn (2) are increasingly in agreement with the corresponding solution to the average equation (35).
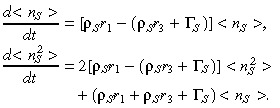
As the cellular population grows, it becomes pertinent to consider the equations for the average numbers < nS > and < nP > of each population, which we derive from eqn (1) and will subsequently refer to as the ‘average equations’ for brevity. Multiplying eqn (1) by nS and summing over all nS and nP, we can use the definition of the mean S= < nS > to write
| (4) |
where we have defined r=r 1–r 3. Similarly for P= < nP >,
| (5) |
In setting up the average equations, it becomes apparent that the difference of symmetric division rates r=r 1–r 3 is the parameter of paramount importance – although we note that, due to the requirement that r 1+r 2+r 3= 1, this difference is not independent of the asymmetric division rate r 2 (clearly, the parameter r could be written in terms of any two of the three division rates).
Another quantity of interest is the fraction of cancer stem cells. Defining X(t) =S(t)/[S(t) +P(t)], we notice that while the average numbers of neither stem cells S(t) nor progenitor cells P(t) reach a steady state, the function X(t) does. To see this, we first differentiate X(t) with respect to time, and use (4), (5) to find that:
| (6) |
Introducing for brevity the notation b=ρS r–ΓS+ΓP and using the relation P/(S + P) = 1 – S/(S + P) = 1 – X, we can write
| (7) |
Some algebraic manipulation then yields
| (8) |
where K=b/[ρS(1 –r) +b]. Notice that eqn (8) is a logistic growth equation for X; setting its time derivative to zero we find that X has stable steady‐state solution K (this nontrivial steady‐state solution is only valid for values of b > 0). When the death rates ΓS and ΓP are small (or their difference is small) compared to ρS r, we can make the approximation K≈r. In other words, as t→∝:
| (9) |
Thus, while the overall number of tumour cells continues to grow, our model indicates that the proportion of stem cells [i.e. the fraction X = S/(S + P)] approaches a constant value that is dependent only on the difference of the probabilities of the two types of symmetric BTSC divisions – this trend is independent of the initial numbers of cells and . Note that, alternatively, this result can be derived by directly solving the average equations and taking the limit of the ratio S/(S + P) as t→∝. This observation is consistent with recent findings that the long‐term maintenance of a specific percentage of stem‐like cells within a tumour is dependent upon the rate of symmetric division (21). Here we have considered the dynamics of only stem and progenitor cells, as these are the proliferating cells that are of primary interest (see the Appendix for the mathematical inclusion of mature cells).
Treatment
A recent study by Piccirillo et al. (20) has suggested the possible use of BMPs in selectively targeting the BTSC subpopulation, while another by Bao et al. (19) has examined the phenomenon of resistance to radiotherapy that is demonstrated preferentially by these cells. Here, we focus on the application of these treatments. To this point we have considered conditions of exponential growth, which are appropriate in vitro or during the early stages of tumour development. To account for the in vivo effects of competition for space and nutrient limitations, we incorporate logistic growth by replacing the formerly constant overall BTSC division rate ρS by  (S, P) =ρS(1 −cSS−cPP), where 1/cS and 1/cP are the limiting populations of stem and progenitor cells, respectively. Stochastic simulations indicate that the results of the model regarding tumour composition and survival rate are conserved from the exponential growth regime to the logistic growth regime, to a good approximation. The use of a logistic growth model now allows for discussion of various in vivo treatment strategies. In the following, we consider the dynamics of only cancer stem cells and progenitor cells, as these are the proliferating populations that are the targets of therapy.
We first consider the application of radiotherapy by using the exponential decay model described by Kohandel et al. (36). The model is incorporated by adding treatment terms to the average (4), (5) for the numbers of stem and progenitor cells, respectively, so that they read:
 |
(10) |
Here, αS and αP represent the radiosensitivities of the stem and progenitor cells (respectively), in units of 1/Gy. The ith acute dosage (in Gy per day) is denoted di, which is applied at time ti. The radiation clearance time (order of doubling time) of CD133+ cells is τS (day), and τP (day) is that of the CD133− cells. Finally, the function f(x) = exp(–x) when x ≥ 0 and equal to zero otherwise.
It has recently been observed in the laboratory that CD133+ GBM cells exhibit greater radioresistance than do cells lacking CD133. In particular, following treatment of cultures of cells isolated from primary human glioblastomas or from human glioblastoma xenografts grown in murine hosts with 2–5 Gy ionizing radiation, the fraction of CD133+ cells was found to have increased 4‐ to 5‐fold (19). Similar results were obtained in vivo, with murine subjects bearing xenograft tumours. These results indicate that the radiosensitivity of BTSCs may be significantly smaller than that of GBM progenitor cells, and, thus, in our model we should choose αS < αP (eqn 10). Based on data of Bao et al. (19), αS was estimated to be 0.2 Gy−1, a value consistent with a previous estimate of stem cell radiosensitivity given by Sachs and Brenner (37). We estimate αP to be 3‐fold greater (0.6 Gy−1). Although not considered here, Bao et al. (19) suggest that administration of an inhibitor of the Chk1 and Chk2 checkpoint kinases (specifically, debromohymenialdisine) concurrent with ionizing radiation renders CD133+ cells more vulnerable, thus acting to increase the value of αS.
While recognizing the radioresistance of CD133+ brain tumour cells is an important if somewhat grim realization, encouraging news comes from recent experiments by Piccirillo and colleagues supporting the notion that BMPs may induce CD133+ GBM cells to differentiate into cells with decreased tumorigenic potential (20). BMPs are a subgroup of the transforming growth factor beta family (38). While BMPs play various roles throughout the body, in neural development they typically induce differentiation into astroglial cells (20). In vitro, treatment of glioblastoma‐derived cells with BMPs resulted in significantly reduced (in the range of 50%) CD133+ populations. In vivo, immunodeficient mice that received gradual administration of BMP4 via beads implanted into their brains either concurrent with or following xenograft of glioma cells lived longer than control mice. The precise mechanisms through which BMPs reduce the tumorigenicity of CD133+ GBM cells remain unclear (20); mathematically, in our model we interpret the effects of BMP4 as decreasing the net symmetric division rate r while leaving r 2 fixed. Based on the work of Piccirillo et al. (20), we estimate that, starting from a pretreatment value of r= 0.1, the effect of treatment with BMP4 is to reduce r to –0.1. Note that we have previously defined r=r 1–r 3, so that the change of r to a negative value represents a simultaneous increase in the proportion of symmetric differentiation divisions and decrease in the proportion of symmetric self‐renewing divisions.
In the laboratory, the minimum number of CD133+ GBM cells required for tumour formation upon injection into immunocompromised mice has been reported as approximately 100, while xenograft of up to 106 CD133− cells lacked the capacity to be tumorigenic (11, 19). For our simulations, we take = 5000 and = 105. This is roughly equivalent to implanting a tumour of 2–3 mm in diameter, which is initially about 5% stem cells by composition. The doubling time of the CD133+ subpopulation is estimated to be about 2 days (36), resulting in ρS
r≈ 0.35 day−1. We take cS and cP to be 10−7 and 10−8, respectively.
Solving the average equations numerically, we can consider the effects of various treatment strategies on GBM cell populations (Fig. 3). A feature of our results is the observed enrichment of the CD133+ population following treatment with ionizing radiation, consistent with the experimental results of Bao et al. (19). In our model, the greater radiosensitivity of CD133− cells dictates that the fraction of CD133+ cells increases (Fig. 3). Furthermore, the logistic growth condition leads to an increase in the growth rate as CD133− cells are destroyed; this allows CD133+ cells to repopulate using resources made newly available. Consequently, we observe a slight increase in the number of CD133+ cells relative to the control case once radiotherapy has ended and the number of cells has plateaued (Fig. 4).
Figure 3.
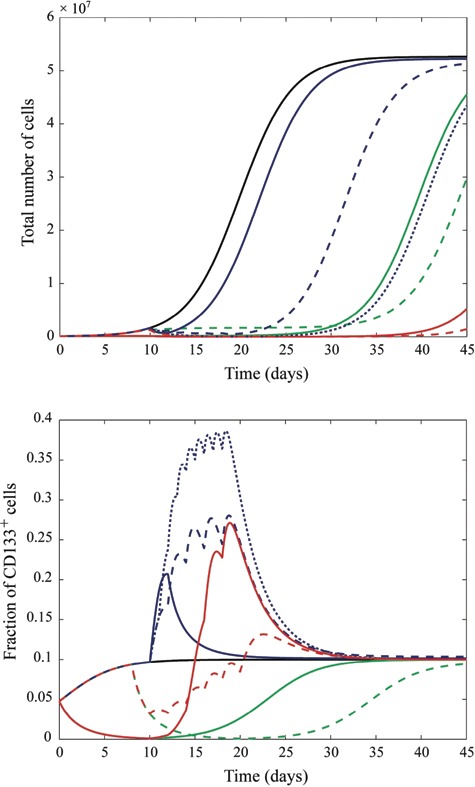
Total number of CD133+ and CD133− cells (a) and fraction of CD133+ cells (b) following various combinations of treatments. The legend is as follows (reproduced in colour online): black, solid (left most in (a), 3rd from bottom at t = 22 in (b)) (no radiation or bone morphogenetic proteins (BMP)); blue, solid (2nd from left in (a), 4th from bottom at t = 22 in (b)) (3 Gy ionizing radiation administered at day 10); blue, dashed (3rd from left in (a), 7th from bottom at t = 22 in (b)) (10 Gy ionizing radiation administered in 2‐Gy doses on days 10, 12, 14, 16, and 18); blue, dotted (5th from left in (a), top‐most at t = 22 in (b)) (18 Gy ionizing radiation administered in 2‐Gy doses on each of days 10–18); green, solid (4th from left in (a), 2nd from bottom at t = 22 in (b)) (10 days BMP4 administered from days 0 to 10); green, dashed (6th from left in (a), bottom‐most at t = 22 in (b)) (BMP4 administered from days 8 to 20); red, solid (7th from left in (a), 6th from bottom at t = 22 in (b)) (BMP4 administered from days 0 to 10 followed by 10‐Gy radiation administered in 2‐Gy doses on days 10, 12, 14, 16, and 18); red, dashed (right‐most in (a), 5th from bottom at t = 22 in (a)) (BMP4 administered from days 8 to 20 with 10‐Gy radiation administered in 2‐Gy doses on days10, 12, 14, 16, and 18).
Figure 4.

Number of CD133+ cells (a) and number of CD133− cells (b) following various combinations of treatments. Black, solid (left‐most) (no radiation or bone morphogenetic proteins (BMP)); blue, solid (2nd from left) (3‐Gy ionizing radiation administered at day 10); blue, dashed (3rd from left) (10‐Gy ionizing radiation administered in 2‐Gy doses on days 10, 12, 14, 16, and 18); blue, dotted (5th from left) (18 Gy ionizing radiation administered in 2‐Gy doses on each of days 10–18); green, solid (4th from left) (10 days BMP4 administered from days 0 to 10); green, dashed (6th from left) (BMP4 administered from days 8 to 20); red, solid (7th from left) (BMP4 administered from days 0 to 10 followed by 10‐Gy radiation administered in 2‐Gy doses on days 10, 12, 14, 16, 18); red, dashed (right‐most) (BMP4 administered from days 8 to 20 with 10‐Gy radiation administered in 2‐Gy doses on days 10, 12, 14, 16, and 18).
Our numerical results (Fig. 4) indicate that a BMP‐type therapy is effective in decreasing CD133+ cell numbers at the expense of a slight increase in the number of CD133− cells and, hence, in the total number of cells (Fig. 3). This net increase is a consequence of our assumption that each CD133+ cell produces two CD133− cells. If, rather, a CD133+ cell transitions directly into a CD133− cell (i.e. an event of the form S→P), then such an increase in overall tumour bulk is not to be expected. In either case, our results suggest that radiotherapy may be more effective when combined with BMP (or another type of differentiation‐inducing) therapy, as is evidenced by the length of time for which cell number is suppressed below saturation in the case of radio‐ and BMP combination therapy relative to other strategies. It should be stressed, however, that at the present time, clinical therapy with BMPs is unfeasible due to the many questions that remain regarding the actions and consequences of these proteins – our theoretical results merely provide additional motivation to investigate such differentiation‐inducing factors. A further prediction of the model is that, following the discontinuation of a treatment regime composed of any combination of radiotherapy and BMP‐type therapy, the GBM cell population will recover to its original constitution (unless the CD133+ population has been rendered extinct). That is, the period of change in the percentage of CD133+ GBM cells that begins with the onset of treatment is only transient, and the tumour will eventually recover its original phenotype (Fig. 3).
Discussion
Mathematical modelling of the cancer stem cell hypothesis is likely to prove useful in two somewhat distinct ways. First, in attempting to establish a mathematical framework that encapsulates such a complex biological process that is only beginning to be understood, important insights and questions may surface that will help to direct future research. Following these initial stages, mathematical modelling will become increasingly useful in predicting strategies for battling the tumour and its resilient cancer stem cells. It seems clear that a deeper understanding, combined with quantitative modelling of cancer stem cells, is central, not only for the design of effective experimental studies to identify particular tumorigenic pathways, but also for the development of effective therapies that will target cancer stem cells.
Related to experimental design, our work has indicated the potential significance of the difference r=r 1–r 3 in determining a steady‐state tumour composition. For example, we predict that a tumour that is 10% BTSCs (relative to total BTSCs and progenitor cells) by composition has r= 0.1. Furthermore, it follows that symmetric, rather than asymmetric, cell divisions are the important divisions in driving tumour growth and maintenance at the macroscopic level. Indeed, by a simple rescaling, we have seen that the rate of asymmetric divisions r 2 can be removed from the average equations altogether. On the microscopic scale of small numbers of cells, however, asymmetric divisions may play an important role. Additional experiments are needed to validate these hypotheses, and to further illuminate the mechanisms of cancer stem cell division. In particular, there is a lack of quantitative estimates for the parameters r 1, r 2, and r 3. It would be worthwhile for experimentalists to develop assays that measure the tendencies for glioblastoma stem cells to undergo these certain types of divisions. A comparison of experimental data with numerically generated probability distributions may permit the interpolation of the frequencies with which BTSCs undergo certain divisions.
In addition to the difference of the rates of symmetric division, we have also demonstrated that the ratio r 3/r 1 may be of importance in determining the survival rate, or frequency of small numbers of potentially tumorigenic cells developing into tumours. It is an experimentally observed phenomenon that typically only a small fraction of singly cultured CD133+ cells develop into tumour spheres. For example, Beier et al. (39) report that only 2–5% of CD133+ cells isolated from primary glioblastomas formed tumour spheres when replated at one cell per well. Parameter values (in particular, the division probabilities r 1, r 2, and r 3) should thus be chosen to satisfy both a low survival rate and a long‐term tumour composition consistent with those observed clinically and experimentally [for brain tumours, the fraction of CD133+ cells has been recognized as in the range of about 5 to 30% (11)]. However, stochastic simulations and the aforementioned analytical survival rate together indicate that the division probabilities r 1 and r 3 cannot be chosen to simultaneously satisfy both the experimentally observed tumour sphere formation likelihood and the necessary condition of consistency with experimentally, and clinically, observed tumour composition. More specifically, the model predicts that a significantly higher percentage of singly cultured CD133+ cells form tumour spheres than is observed.
The lack of concordance between the model prediction and this result is a reflection of the current state‐of‐knowledge of the brain cancer stem cell hierarchy and the markers that are associated with it. It is an assumption of our model that each CD133+ cell has some tumorigenic capacity. CD133, also known as AC133 or human Prominin‐1, is an 865‐amino acid‐long glycosylated protein embedded in the plasma membrane, consisting of five transmembrane domains including two prominent extracellular loops (40, 41). Although its biological function has yet to be established (40, 41), it was first identified as a marker of haematopoietic stem cells (42) and was subsequently recognized as a marker of human central nervous system stem cells (13). Since then, it has been implicated as a marker for various putative cancer stem cells, including those of the brain and prostate [see Singh et al. (11) and Collins et al. (43), respectively]. While sufficient data exist to conclude that CD133 is certainly correlated with cancer cell ‘stemness’, this marker alone does not seem to positively identify human BTSCs while excluding non‐tumour‐initiating progenitor cells, as is evidenced by the relatively low observed frequencies of individual cells from CD133+ tumour‐derived subpopulations forming tumour spheres (10, 11, 39). Additional confusion regarding the significance of CD133 comes from the recent report that a certain subset of glioblastomas may be driven by a CD133− cell subpopulation (39). Together, these considerations emphasize the importance of finding novel markers and methods of characterizing BTSCs as distinct from their non‐tumorigenic progeny. When such advances are made, these can be accommodated by our mathematical model. For example, experimental distinction between BTSCs and non‐tumour‐initiating cells within the CD133+ cell pool would allow for the mathematical treatment of, and assignment of parameter values to, two separate CD133+ cell populations (one capable of self‐renewal and the other not). A similar adaptation could be made to the CD133− population, in light of the results of Beier et al. mentioned above (39).
Our numerical results regarding treatment agree qualitatively with the observations of Bao et al. (19) and Piccirillo et al. (20). They also predict that the application of BMPs, together with radiotherapy, may constitute a highly effective treatment strategy. This should motivate the design of experiments that test such combination therapies. There is also a need for additional research, both experimental and theoretical, focused on the separate actions of BMPs and radiotherapy. How exactly do BMPs act to make BTSCs less tumorigenic, and why is it that some BTSCs may resist these effects (14)? Regarding radioresistance of CD133+ cells, it should prove worthwhile to perform additional quantitative in vivo studies. As pointed out by Hambardzumyan et al. (44), much of the current data are derived from GBM cell cultures, which lack the oxygenic and other stimulatory conditions that define the in vivo tumour microenvironment.
While much remains to be unravelled, it is certainly clear, as further evidenced by our numerical simulations and results, that the entire BTSC subpopulation must be eliminated before we can speak of a curative therapy. This indicates the need for new and improved treatment strategies. One promising direction may involve anti‐angiogenic drugs that disrupt the development of tumour vasculature (45). Folkins et al. (46) have recently demonstrated that anti‐angiogenic therapy may disturb a possible BTSC niche, analogous to the niche of normal neural stem cells, which in turn may cause BTSCs to differentiate as they lose the niche signals that confer ‘stemness’ upon them. By doing so, anti‐angiogenic therapy may act as a primer for conventional treatments in a novel combination treatment strategy aimed at rendering the BTSC subpopulation extinct (46). The cancer stem cell hypothesis represents a landmark step in that it recognizes that not all tumour cells are equal. In addition to the importance of this type of populational heterogeneity, it is becoming increasingly clear that the micro‐environmental heterogeneity of a tumour is an undeniable force in determining cellular behaviour. Considering the effects of irregular vasculature and a possible BTSC niche will be an interesting challenge for future modelling.
While there are current limitations on mathematical modelling of BTSCs, in terms of the previously discussed need for more precise biomarkers and a better understanding of the processes of BTSC proliferation and self‐renewal, our model is adaptable to new features as discoveries are made. As biological knowledge of the BTSC hierarchy grows, so too will the related mathematical modelling. In addition to the radioresistance documented by Bao et al. (19), chemoresistance of CD133+ glioma cells is a recently observed phenomenon [see, for example, Liu et al. (47)]. Ganguly and Puri (28) have included chemotherapy in their mathematical model of cancer stem cell dynamics (27); in the future, it may also be interesting to use a stochastic approach to examine the effects of chemotherapy. The synergistic interplay between mathematical modelling and experiment will lead to computational models that can then play a role in designing treatment strategies that are effective in doing what the cancer stem cell hypothesis implies is clearly necessary: eradicating the underlying cancer stem cells to one day provide a truly curative therapy.
Appendix
Inclusion of mature cells
In the main text, we concerned ourselves with only the populations of stem and progenitor cells. However, the model can easily be generalized to include the population of mature cells. In particular, we assume that progenitor cells can asymmetrically self‐renew with some (typically small) probability 1 – r′ and otherwise perform a symmetric commitment‐type division to mature cells with probability r′ (and that with rate ρP progenitor cells undergo either of these two types of divisions). Introducing a death rate for mature cells ΓM and using the same assumptions as before for stem and progenitor cells, we have the following master equation:
 |
(11) |
Since we have not altered the dynamics of the cancer stem cell population, the survival rate is the same as that given in eqn (3). The associated average equations are
 |
(12) |
where  and, for consistency, we have again taken r = r
1–r
3. By either solving eqn (12) directly and taking the limit as t→∝ or by applying an approach similar to that used in the case of the two‐compartment model (i.e. finding a pair of coupled ordinary differential equations for X=S/(S+P) and Y=S/(S+P+M) and solving for steady‐state solutions), we find that
and, for consistency, we have again taken r = r
1–r
3. By either solving eqn (12) directly and taking the limit as t→∝ or by applying an approach similar to that used in the case of the two‐compartment model (i.e. finding a pair of coupled ordinary differential equations for X=S/(S+P) and Y=S/(S+P+M) and solving for steady‐state solutions), we find that
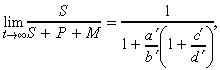 |
(13) |
where a′ = ρS (1 – r) (defined previously), b′ = ρS r + ρP r′ –ΓS + ΓP, c′ = ρP(1 + r′) and d′ = ρS r – ΓS + ΓM. Note that if we take r′ = 0, then the second line of eqn (12) reduces to eqn (5).
Relative standard deviation
We have derived the following deterministic equations for the first and second moments:
 |
(14) |
For brevity, we will write λ = ρSr 1 and µ = ρS r 3 + ΓS so that the above equations can be written simply as
 |
(15) |
These are solved to give
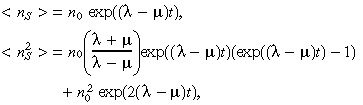 |
(16) |
where n 0=nS (0) is the initial number of BTSCs. From these two equations we can calculate the standard deviation
 |
(17) |
which, for λ > µ (this must be the case for a growing tumour), obeys
 |
(18) |
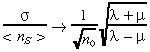
as t → ∝. Thus, we see that while the standard deviation of the stochastic realizations about the mean grows exponentially, the relative standard deviation decreases with increasing initial number of BTSCs. For µ = 0, eqn (18) gives  (35).
(35).
Acknowledgements
Financial support by the Natural Sciences and Engineering Research Council of Canada and Canadian Institutes of Health Research (C.T., A.R.S., M.K., S. Sivaloganathan), as well as Canada Research Chair Program and Canada Foundation for Innovation (S. Singh), is gratefully acknowledged. In addition, we would like to thank E. Jervis and M. Kardar for their helpful discussions.
References
- 1. DeAngelis LM (2005) Chemotherapy for brain tumors – a new beginning. N. Engl. J. Med. 352, 1036–1038. [DOI] [PubMed] [Google Scholar]
- 2. Tan BT, Park CY, Ailles LE, Weissman IL (2006) The cancer stem cell hypothesis: a work in progress. Lab. Invest. 86, 1203–1207. [DOI] [PubMed] [Google Scholar]
- 3. Lapidot T, Sirard C, Vormoor J, Murdoch B, Hoang T, Caceres‐Cortes J, Minden M, Paterson B, Caligiuri MA, Dick JE (1994) A cell initiating human acute myeloid leukaemia after transplantation into SCID mice. Nature 17, 645–648. [DOI] [PubMed] [Google Scholar]
- 4. Bonnet D, Dick JE (1997) Human acute myeloid leukemia is organized as a hierarchy that originates from a primitive hematopoietic cell. Nat. Med. 3, 730–737. [DOI] [PubMed] [Google Scholar]
- 5. Al‐Hajj M, Wicha MS, Benito‐Hernandez A, Morrison SJ, Clarke MF (2003) Prospective identification of tumorigenic breast cancer cells. Proc. Natl. Acad. Sci. USA 100, 3983–3988. [DOI] [PMC free article] [PubMed] [Google Scholar]
- 6. Ricci‐Vitiani L, Lombardi DG, Pilozzi E, Biffoni M, Todaro M, Peschle C, De Maria R (2007) Identification and expansion of human colon‐cancer‐initiating cells. Nature 445, 111–115. [DOI] [PubMed] [Google Scholar]
- 7. O’Brien CA, Pollett A, Gallinger S, Dick JE (2007) A human colon cancer cell capable of initiating tumour growth in immunodeficient mice. Nature 445, 106–110. [DOI] [PubMed] [Google Scholar]
- 8. Ignatova TN, Kukekov VG, Laywell ED, Suslov ON, Vrionis FD, Steindler DA (2002) Human cortical glial tumors contain neural stem‐like cells expressing astroglial and neuronal markers in vitro . Glia 39, 193–206. [DOI] [PubMed] [Google Scholar]
- 9. Hemmati HD, Nakano I, Lazareff JA, Masterman‐Smith M, Geschwind DH, Bronner‐Fraser M, Kornblum HI (2003) Cancerous stem cells can arise from pediatric brain tumors. Proc. Natl. Acad. Sci. USA 100, 15178–15183. [DOI] [PMC free article] [PubMed] [Google Scholar]
- 10. Singh SK, Clarke ID, Terasaki M, Bonn VE, Hawkins C, Squire J, Dirks PB (2003) Identification of a cancer stem cell in human brain tumors. Cancer Res. 63, 5821–5828. [PubMed] [Google Scholar]
- 11. Singh SK, Hawkins C, Clarke ID, Squire JA, Bayani J, Hide T, Henkelman RM, Cusimano MD, Dirks PB (2004) Identification of human brain tumour initiating cells. Nature 432, 396–401. [DOI] [PubMed] [Google Scholar]
- 12. Galli R, Binda E, Orfanelli U, Cipelletti B, Gritti A, De Vitis S, Fiocco R, Foroni C, Dimeco F, Vescovi A (2004) Isolation and characterization of tumorigenic, stem‐like neural precursors from human glioblastoma. Cancer Res. 64, 7011–7021. [DOI] [PubMed] [Google Scholar]
- 13. Uchida N, Buck DW, He D, Reitsma MJ, Masek M, Phan TV, Tsukamoto AS, Gage FH, Weissman IL (2000) Direct isolation of human central nervous system stem cells. Proc. Natl. Acad. Sci. USA 97, 14720–14725. [DOI] [PMC free article] [PubMed] [Google Scholar]
- 14. Dirks PB (2006) Cancer: stem cells and brain tumours. Nature 444, 687–688. [DOI] [PubMed] [Google Scholar]
- 15. Morrison SJ, Kimble J (2006) Asymmetric and symmetric stem‐cell divisions in development and cancer. Nature 441, 1068–1074. [DOI] [PubMed] [Google Scholar]
- 16. Dirks PB (2007) Brain tumour stem cells: the undercurrents of human brain cancer and their relationship to neural stem cells. Philos. Trans. Roy Soc. Lond. B Biol. Sci. 363, 139–152. [DOI] [PMC free article] [PubMed] [Google Scholar]
- 17. Clarke MF, Fuller M (2006) Stem cells and cancer: two faces of eve. Cell 124, 1111–1115. [DOI] [PubMed] [Google Scholar]
- 18. Reya T, Morrison SJ, Clarke MF, Weissman IL (2001) Stem cells, cancer, and cancer stem cells. Nature 414, 105–111. [DOI] [PubMed] [Google Scholar]
- 19. Bao S, Wu Q, McLendon RE, Hao Y, Shi Q, Hjelmeland AB, Dewhirst MW, Bigner DD, Rich JN (2006) Glioma stem cells promote radioresistance by preferential activation of the DNA damage response. Nature 444, 756–760. [DOI] [PubMed] [Google Scholar]
- 20. Piccirillo SG, Reynolds BA, Zanetti N, Lamorte G, Binda E, Broggi G, Brem H, Olivi A, Dimeco F, Vescovi AL (2006) Bone morphogenetic proteins inhibit the tumorigenic potential of human brain tumour‐initiating cells. Nature 444, 761–765. [DOI] [PubMed] [Google Scholar]
- 21. Boman BM, Wicha MS, Fields JZ, Runquist OA (2007) Symmetric division of cancer stem cells–a key mechanism in tumor growth that should be targeted in future therapeutic approaches. Clin. Pharmacol. Ther. 81, 893–898. [DOI] [PubMed] [Google Scholar]
- 22. Wichmann HE, Loeffler M (1985) Mathematical Modeling of Cell Proliferation: Stem Cell Regulation in Hemopoiesis, Vol. I. Boca Raton, FL: CRC Press. [Google Scholar]
- 23. Michor F, Hughes TP, Iwasa Y, Branford S, Shah NP, Sawyers CL, Nowak MA (2005) Dynamics of chronic myeloid leukaemia. Nature 435, 1267–1270. [DOI] [PubMed] [Google Scholar]
- 24. Johnston MD, Edwards CM, Bodmer WF, Maini PK, Chapman SJ (2007) Mathematical modeling of cell population dynamics in the colonic crypt and in colorectal cancer. Proc. Natl. Acad. Sci. USA 104, 4008–4013. [DOI] [PMC free article] [PubMed] [Google Scholar]
- 25. Swanson KR, Rostomily RC, Alvord EC Jr (2008) A mathematical modelling tool for predicting survival of individual patients following resection of glioblastoma: a proof of principle. Br. J. Cancer 98, 113–119. [DOI] [PMC free article] [PubMed] [Google Scholar]
- 26. Stein AM, Demuth T, Mobley D, Berens M, Sander LM (2007) A mathematical model of glioblastoma tumor spheroid invasion in a three‐dimensional in vitro experiment. Biophys. J. 92, 356–365. [DOI] [PMC free article] [PubMed] [Google Scholar]
- 27. Ganguly R, Puri IK (2006) Mathematical model for the cancer stem cell hypothesis. Cell Prolif. 39, 3–14. [DOI] [PMC free article] [PubMed] [Google Scholar]
- 28. Ganguly R, Puri IK (2007) Mathematical model for chemotherapeutic drug efficacy in arresting tumour growth based on the cancer stem cell hypothesis. Cell Prolif. 40, 338–354. [DOI] [PMC free article] [PubMed] [Google Scholar]
- 29. Clayton E, Doupe DP, Klein AM, Winton DJ, Simons BD, Jones PH (2007) A single type of progenitor cell maintains normal epidermis. Nature 446, 185–189. [DOI] [PubMed] [Google Scholar]
- 30. Van Kampen NG (2007) Stochastic Processes in Physics and Chemistry. New York: Elsevier. [Google Scholar]
- 31. Sachs RK, Heidenreich WF, Brenner DJ (1996) Dose timing in tumor radiotherapy: considerations of cell number stochasticity. Math. Biosci. 138, 131–146. [DOI] [PubMed] [Google Scholar]
- 32. Gillespie DT (1977) Exact stochastic simulation of coupled chemical reactions. J. Phys. Chem. 81, 2340–2361. [Google Scholar]
- 33. Ozbudak EM, Thattai M, Kurtser I, Grossman AD, Van Oudenaarden A (2002) Regulation of noise in the expression of a single gene. Nat. Gen. 31, 69–73. [DOI] [PubMed] [Google Scholar]
- 34. Bailey NTJ (1964) The Elements of Stochastic Processes. New York: John Wiley & Sons. [Google Scholar]
- 35. Kleczkowski A (2005) Population and replicate variability in an exponential growth model. Acta Phys. Pol. B 36, 1623–1634. [Google Scholar]
- 36. Kohandel M, Kardar M, Milosevic M, Sivaloganathan S (2007) Dynamics of tumor growth and combination of anti‐angiogenic and cytotoxic therapies. Phys. Med. Biol. 52, 3665–3677. [DOI] [PubMed] [Google Scholar]
- 37. Sachs RK, Brenner DJ (2005) Solid tumor risks after high doses of ionizing radiation. Proc. Natl. Acad. Sci. USA 102, 13040–13045. [DOI] [PMC free article] [PubMed] [Google Scholar]
- 38. Chen D, Zhao M, Mundy GR (2006) Bone morphogenetic proteins. Growth Factors 22, 233–241. [DOI] [PubMed] [Google Scholar]
- 39. Beier D, Hau P, Proescholdt M, Lohmeier A, Wischhusen J, Oefner PJ, Aigner L, Brawanski A, Bogdahn U, Beier CP (2007) CD133+ and CD133− glioblastoma‐derived cancer stem cells show differential growth characteristics and molecular profiles. Cancer Res. 67, 4010–4015. [DOI] [PubMed] [Google Scholar]
- 40. Shmelkov SV, St Clair R, Lyden D, Rafii S (2005) AC133/CD133/Prominin‐1. Int. J. Biochem. Cell Biol. 37, 715–719. [DOI] [PubMed] [Google Scholar]
- 41. Neuzil J, Stantic M, Zobalova R, Chladova J, Wang X, Prochazka L, Dong L, Andera L, Ralph SJ (2007) Tumour‐initiating cells vs. cancer ‘stem’ cells and CD133: what's in the name? Biochem. Biophys. Res. Comm. 355, 855–859. [DOI] [PubMed] [Google Scholar]
- 42. Miraglia S, Godfrey W, Yin AH, Atkins K, Warnke R, Holden JT, Bray RA, Waller EK, Buck DW (1997) A novel five‐transmembrane hematopoietic stem cell antigen: isolation, characterization, and molecular cloning. Blood 90, 5013–5021. [PubMed] [Google Scholar]
- 43. Collins AT, Berry PA, Hyde C, Stower MJ, Maitland NJ (2005) Prospective identification of tumorigenic prostate cancer stem cells. Cancer Res. 65, 10946–10951. [DOI] [PubMed] [Google Scholar]
- 44. Hambardzumyan D, Squatrito M, Holland EC (2006) Radiation resistance and stem‐like cells in brain tumors. Cancer Cell 10, 454–456. [DOI] [PubMed] [Google Scholar]
- 45. Jain RK, Di Tomaso E, Duda DG, Loeffler JS, Sorensen AG, Batchelor TT (2007) Angiogenesis in brain tumours. Nat. Rev. Neurosci. 8, 610–622. [DOI] [PubMed] [Google Scholar]
- 46. Folkins C, Man S, Xu P, Shaked Y, Hicklin DJ, Kerbel RS (2007) Anticancer therapies combining antiangiogenic and tumor cell cytotoxic effects reduce the tumor stem‐like cell fraction in glioma xenograft tumors. Cancer Res. 67, 3560–3564. [DOI] [PubMed] [Google Scholar]
- 47. Liu G, Yuan X, Zeng Z, Tunici P, Ng H, Abdulkadir IR, Lu L, Irvin D, Black KL, Yu JS (2006) Analysis of gene expression and chemoresistance of CD133+ cancer stem cells in glioblastoma. Mol. Cancer 5, 67. [DOI] [PMC free article] [PubMed] [Google Scholar]