Abstract
Abstract. It is well established that protein kinase C (PKC) isozymes are involved in the proliferation of glioma cells. However, reports differ on which PKC isozymes are responsible for glioma proliferation. As a means to further elucidate this, the objectives of our research were to determine how inhibition of PKC‐α, PKC‐β and PKCµ with PD 406976 regulates the cell cycle, cell proliferation and PKC during glioma growth and development. To establish the cell cycle effects of PD 406976 on brain cells (SVG, U‐138MG and U‐373MG glioma cells), specimens were treated with either dimethylsulfoxide (DMSO; control) or PD 406976 (2 µm). Results from flow cytometry demonstrated that PD 406976 delayed the entry DNA synthesis phase in SVG cells and delayed the number of cells entering and exiting the DNA synthesis phase in both U‐138MG and U‐373MG cells, indicating that PD 406976 may inhibit G1/S and S phase progression. Assessment of cell viability demonstrated a cytostatic effect of PD 406976 on SVG, U‐138MG and U‐373MG glioma cell proliferation. The PD 406976‐induced decreased proliferation was sustained at 48–96 h. A PKC activity assay was quantified and demonstrated that exposure of SVG and U‐373MG glioma cells to PD 406976 suppressed PKC activity. Western blotting demonstrated reduced PKC‐β1, PKC‐γ and PKC‐τ protein content in cells treated with PD 406976. We determined that the growth inhibitory effect of PD 406976 was not as a result of apoptosis.
INTRODUCTION
High‐grade gliomas are lethal tumours. Despite rigorous therapy, median survival is less than 1 year for patients with high‐grade tumours (Allalunis‐Turner et al. 1992). Rapid glioma growth rates have been attributed to inherently high levels of PKC (Couldwell et al. 1990; Pollack et al. 1990) and PKCs have been shown to regulate the phosphatidylinositol 3′/Akt survival pathway which is induced to protect against apoptotic stress stimuli (Tenzer et al. 2001). PKC is a family of 14 known isozymes which are found in varying ratios in the cytosolic and membrane fractions of cells, depending on the type of tissue and its physiological state (Nishizuka 1992). PKC isozymes can be classified into three groups. Group I includes Ca2+‐dependent isozymes: cPKC‐α, cPKC‐βI, cPKC‐βII and cPKC‐γ. Isozymes in group II, nPKC‐ɛ, nPKC‐δ, nPKC‐η and nPKC‐θ are Ca2+ independent. Group III includes the atypical PKC: aPKC‐τ (Selbie et al. 1993), aPKC‐ζ, aPKC‐ζII (Hirai et al. 2003), aPKC‐µ (protein kinase D) and aPKC‐υ (Hayashi et al. 1999) which are phospholipid dependent. PKC regulates cellular functions, metabolism and proliferation by phosphorylating proteins in response to transmembrane signals from hormones, growth factors, neuro‐transmitters and pharmacological agents. Some PKC isozymes are transiently translocated from the cytosol to a membrane structure. Membrane association leads to binding alterations in PKC's regulatory subunit (phospholipid‐/diacylglycerol/phorbol ester) and its 50‐kD catalytic domain (ATP/substrate). Proteolytic degradation of membrane PKC leads to its down‐regulation. PKC is the major receptor for tumour‐promoting phorbol esters, but the extent of PKC involvement in malignancy is not clearly defined. Various studies indicate that increased tumourigenicity results from dysregulation of PKC activity, or changes in PKC concentration, or both (Kamata et al. 1987; Housey et al. 1988; Mizuguchi et al. 1988; Persons et al. 1988; Weyman et al. 1988). Thus, agents that inhibit PKC isozymes may be employed to block tumour progression; if the mechanism(s) by which PKC isozymes regulate cell cycle progression and proliferation are revealed.
Previous work investigating the role of PKC isozymes in cell cycle regulation and proliferation in the budding yeast Saccharomyces cerevisiae showed that depletion of a single gene (PKC1), which is closely related to genes that code for mammalian PKC‐α, ‐β and ‐γ, blocked cell division at a point following DNA replication but prior to mitosis (Levin et al. 1990). The PKC1‐depleted cells had a uniform phenotype similar to cell division cycle mutants. However, PKC1‐depleted cells arrested their growth with small buds. Thus, PKC1 may regulate an unrecognized checkpoint in the cell cycle. Recently, it was shown that PKC‐α and PKC‐δ play opposite roles in the proliferation and apoptosis of glioma cells (Mandil et al. 2001). PKC‐α enhanced cell proliferation while PKC‐δ was involved in regulating apoptosis. Others have found that PKC‐ζ, and not PKC‐α, regulates cell proliferation (Donson et al. 2000) and that PKC‐τ protects cells against apoptosis (Murray & Fields 1997; Xie et al. 2000).
In this study, we examined the effects of PD 406976 on cell cycle regulation, cell proliferation, PKC activity, PKC isozyme content and apoptosis in SVG‐transformed glial cells (Major et al. 1985), U‐138MG and U‐373MG glioma cells which are high‐grade brain tumour cell lines. PD 406976 inhibits PKC with particular specificity for the Ca2+‐dependent isoforms α, β and also for atypical PKC‐µ (Donson et al. 2000). Of interest, were the results depicting changes in the SVG and U‐373MG protein content of PKC‐βI, PKC‐γ, and PKC‐τ and no significant change in PKC‐α, PKC‐δ, and PKC‐ζ. This study and the results of others suggest that different PKC isozymes may play different roles in glioma proliferation, depending on the specific glioma cell type.
MATERIALS AND METHODS
Materials
PD 406976 was provided by Dr Wilbur Leoplod III from Parke Davis Inc. Other chemicals were purchased from Sigma (St Louis, MO, USA) and were of the purest grade.
Cell culture
The U‐138MG, U‐373MG and SVG‐transformed cell lines (glial cells transformed with the human papovavirus JCV; Major et al. 1985) were obtained from the American Tissue Culture Collection (Rockville, MD, USA). Cells were seeded (1 × 10⁶) and grown as monolayers in 75‐cm2 flasks containing 90% Dulbecco's modified Eagle's medium (DMEM), 10% fetal calf serum (FCS), 2 mm l‐glutamine, 4.5 g/l glucose, and antibiotics (penicillin 10 U/ml and streptomycin 10 µg/ml) according to Ponten & MacIntrye (1968).
Cell cycle analysis by flow cytomerty
Cell cycle analysis was performed as previously described (Acevedo‐Duncan et al. 1997). Confluent cell cultures were semisynchronized by contact inhibition and serum starvation for 48 h. Subsequently, cells were collected every 2 h post‐serum/dimethylsulfoxide (DMSO; vehicle, control) or PD 406976 treatment by washing twice with phosphate‐buffered saline (PBS) and then trypsinized. The cells in the trypsin suspension were centrifuged and the trypsin decanted. To fix the cells, 3 ml of ice‐cold PBS was added and the cell pellet was re‐suspended. While vortexing gently, 7 ml of ethanol were added drop wise. The day before analysis, the 70% ethanol was decanted and PBTB (PBS, 0.2% Triton and 1% BSA) was added. Cells were counted, diluted to 1 × 10⁶ cells/ml with PBTB, filtered, and 50 µl of RNase was added. Nuclei were analysed for DNA content using a propidium iodine (10 µl) staining protocol and flow cytometry (Carlton et al. 1991). The distributions of 40 000 nuclei were quantified using a FAC STARPlus flow cytometer (Becton Dickinson, San Jose, CA, USA) and ModFitLT Cell Cycle Analysis program (Version 2.0; Verity Software House, Inc., Topsham, ME, USA).
Statistics
Mean separation was by Student's t‐test using Minitab software (Minitab Inc. State College, PA, USA).
Cell viability assay
The effects of PD 406976 were determined in exponentially growing transformed glial SVG, U‐138MG and U‐373MG glioma cells in complete media over 72 h. Cells were plated on 25 cm2 at a density of 9 × 10⁵ cells/flask. Twenty‐four hours post‐plating, cells were incubated with either DMSO or PD 406976 (1 µm or 2 µm; dissolved in DMSO). Following the initial exposure to DMSO or PD 406976, additional PD 406976 was neither applied nor removed during the 3‐day incubation period. Following treatments, cells were washed with PBS, trypsinized and re‐suspended in 3 ml of PBS. Cell viability was quantified using a trypan blue exclusion assay. Two hundred microlitres of the cell suspension was added to 50 µl of trypan blue and the number of unstained and stained cells was counted.
Cell fractionation
The effect of 2 µm PD 406976 was determined on SVG and U‐373MG cells over 72 h. Cells were plated on 75‐cm2 flasks at a density of 3 × 10⁵ cells/flask for SVG and 1 × 10⁶ cells/flask for U‐373MG. Twenty‐four hours post‐plating the cells were treated with DMSO as a control, or 2 mm PD 406976. After the incubation period, all cells were washed twice with PBS, trypsinized, and then re‐suspended in ice‐cold PBS. The cells in the PBS suspension were centrifuged and the PBS was decanted. The cells were placed on ice and re‐suspended in 1.2 ml of ice‐cold homogenization buffer [50 mm HEPES at pH 7.5, 150 mm NaCl, 0.1% Tween‐20, 1 mm EDTA, 2 mm EGTA, 0.1 mm Na3VO4, 1 mm NaF, 2 mm PMSF, 2.5 mg/ml leupeptin, 1 mm dithiothreitol (DTT), and 0.15 mg/ml aprotinin]. The suspension was sonicated for three 15‐s cycles on ice. The cell extracts were then clarified at 100 000 g for 30 min. Protein content then was quantified by Bradford (1976) analysis.
PKC activity assay
Total PKC phosphotransferase activity in SVG and U‐373MG cells following treatments was assayed by Pierce Colorimetric PKC Assay Kit (non‐radioactive; Pierce, Rockford, IL, USA). Briefly, a component mixture containing crude cell lysate with PKCs (25 mm Tris‐HCl, pH 7.0, 3 mm MgCl2, 0.1 mm ATP, 2 mm CaCl2, 50 mg/ml phosphatidylserine, 0.5 mm EDTA, 1 mm EGTA, and 5 mmβ‐mercaptoethanol) was incubated for 20 min at 25 °C in wells with immobilized pseudosubstrate. After incubation, the mixture was removed and the wells were washed, then biotinylated antibody was added to the wells and incubated for 60 min. The antibody was then removed and a peroxidase‐conjugated strepavidin was added to each well and incubated for 60 min. A colour development solution was then added to the wells and incubated for 5 min. After colour development, the absorbance measured at 492 nm was used to quantify the PKC‐dependent phosphorylated peptide.
Western blot analysis
Cell extracts (10–50 µg) containing equal amounts of protein in each lane were run on sodium dodecyl sulfate – polyacrylamide gel electorphoresis (SDS‐PAGE) gels according to Laemmli (1970). Proteins were transblotted according to Towbin et al. (1979). Immunoreactive bands were visualized with enhanced chemiluminescence according to manufacturer's instructions (ECL; Amersham, Piscataway, NJ, USA).
Densitometry
The intensity of each band was measured using Scion Image software. Briefly, the background intensity was subtracted from the intensity of each band, to derive the corrected intensity. Then, the control samples, time 24 DMSO, time 48 DMSO and time 72 DMSO corrected intensities, were averaged to create the baseline intensity. All points were normalized against the baseline intensity by dividing the corrected intensities by the baseline intensity. The controls are approximately equal to 1; any number less than 1 indicates a less intense band, and any number greater than 1 indicates a more intense band.
Annexin V‐FITC flow cytometry
Approximately 500 000 SVG or U‐373MG cells were plated and treated with DMSO or PD 406976 over the time course. Twelve hours prior to apoptosis analysis, one flask was treated with 1 µm staurosporine to compensate for analysis. After completion of the time course, cells were lifted using trypsin application and were then centrifuged. The trypsin was aspirated and cells were washed with cold PBS three times and re‐suspended in BD Pharmingen Annexin V (San Diego, CA, USA) binding buffer to a concentration of 1 × 10⁶ cells/ml. The cell suspension was filtered and 5 µl of Annexin V‐FITC protein was added to 500 µl of cell suspension. The antibody was incubated with the cell suspension for 15 min in the dark at room temperature and specimens were then analysed by flow cytometry. Untreated cells were used for the negative control and cells treated with 1 µm staurosporine were used to compensate for analysis (Bossy‐Wetzel 2000; Van Engeland 1998).
Annexin V‐FITC microscopy
Approximately 25 000 cells on chamber glass slides were plated and treated with DMSO or 2 µm PD 406976 over the time course. Twelve hours prior to apoptosis analysis, one slide was treated with 1 µm staurosporine to compensate for analysis. After completion of the time course, the media were removed and cells were washed twice with PBS and once with BD Pharmingen Annexin V binding buffer. The cells were then stained with 100 µl Annexin V‐FITC protein and 900 µl binding buffer. The antibody was incubated with the cells for 15 min in the dark at room temperature. After incubation, the cells were washed again with binding buffer. Subsequently, binding buffer was added to ensure that the cells did not dry out during microscope observation.
RESULTS
PD 406976 blocks G1/S‐phase progress in SVG cells and delays S‐phase progression in U‐138 and U‐373MG glioma cells
To establish a relationship between inhibition of PKC‐α, PKC‐β, PKC‐µ and cell cycle regulation, cells were grown to confluence and serum starved for 48 h. Because serum starvation did not produce a synchronous G0/G1 cell population, we examined the cell cycle effects of PD 406976 on an asynchronous cell population. These results are consistent with published data indicating that it is difficult to completely arrest transformed cells (Hans et al. 1995). Cell cycle progression was initiated by serum addition in combination with either DMSO (vehicle control) or PD 406976 (2 µm; dissolved in DMSO). Following addition of serum and DMSO or PD 406976, cells were fixed at 2‐h intervals for analysis of total DNA by flow cytometry. Figure 1(a) illustrates representative cellular DNA content frequency histograms from a single experiment in which serum deprivation for 48 h produced an SVG‐transformed cell population (at time zero in culture; T0) consisting of 40% G0/G1, 25% S and 35% G2 + M. In SVG cells, PD 406976 inhibited the progression from the G1 phase to S phase. Control cells (DMSO) started with 40% in the G1 phase and by 8 h post‐treatment only 18% were still in G1 phase (Figs 1a and c). The control DMSO‐treated cells progressed through S phase; at T0 only 25% were in the S phase, but increased to 58%. The PD 406976‐treated cells began with approximately the same profile as the control; 44% in G1 phase and 26% in S phase; however, did not follow a similar progression (1, 4). Eight hours post‐treatment only a few of the G1 phase cells progressed into the S phase (44% in G1 phase and 30% in S phase). For the remainder of the SVG time course, the number of PD 406976‐treated cells in S phase remained constant (1, 4). These results indicate that PD 406976 delays G1/S phase progression in SVG cells.
Figure 1.
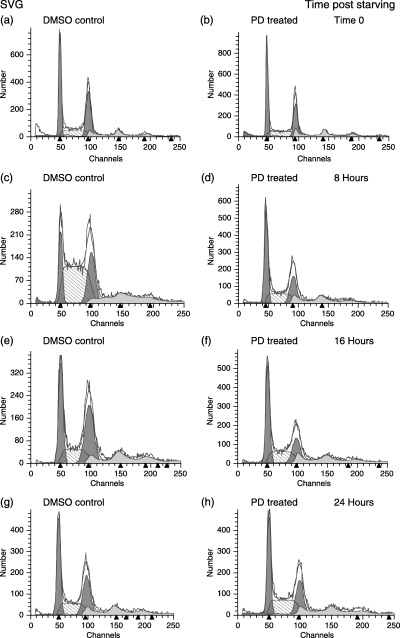
Effects of PD 406976 on SVG‐transformed glial cell cycle distribution as a function of time. FACS analysis of DNA replication during a mitotic time course. Cells were stimulated with 10% FCS and either 5.5 µl of DMSO/7 ml of media (controls; left column) or PD 406976 (2 µm; right column). Number of events collected was 40 000 per time point and treatment group. Data are representative of three experiments.
Figure 4.
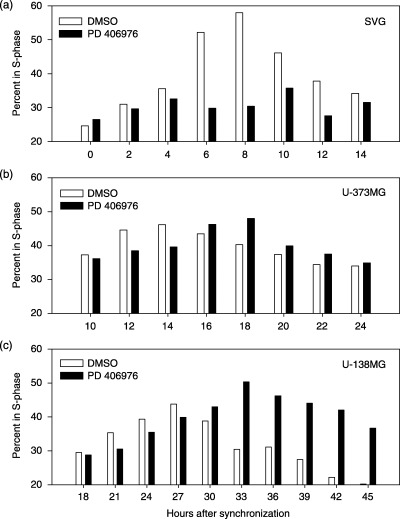
Effects of PD 406976 on SVG‐transformed glial cells (a), U‐373MG (b) and U‐138MG glioma (c) DNA synthesis phase as a function of time. Percentage of cells in S‐phase. Open bars represent control (DMSO) treated cells; solid bars represent cells treated with PD 406976 (2 µm). Number of events collected was 40 000 per time point and treatment group. Data are representative of three experiments with SVG‐transformed glial cells and U‐373MG glioma cells and two experiments with U‐138MG glioma cells.
In contrast, the PD 406976‐treated malignant cell lines (U‐373MG and U‐138MG), were able to progress from the G1 phase into S phase, but the transition was delayed in S (4, 2, 3). In U‐373MG glioma cells, absence of a G1 arrest is expected as the p53 tumour suppressor is mutated and there is no functional p53 pathway (Russell et al. 1995). In the malignant cell lines treated with PD 406976, the percentages peaked in S phase 3–4 h behind the control.
Figure 2.

Effects of PD 406976 on U‐373MG cell cycle distribution as a function of time. FACS analysis of DNA replication during a mitotic time course. Cells were stimulated with 10% FCS and either 5.5 µl of DMSO/7 ml of media (controls; left column) or PD 406976 (2 µm; right column). To establish DNA flow cytometry settings, U‐373MG cells were karyotyped (Genzyme Genetics, Tampa, FL, USA) and found to be aneuploid. The number of events collected was 40 000 per time point and treatment group. Data are representative of three experiments.
Figure 3.
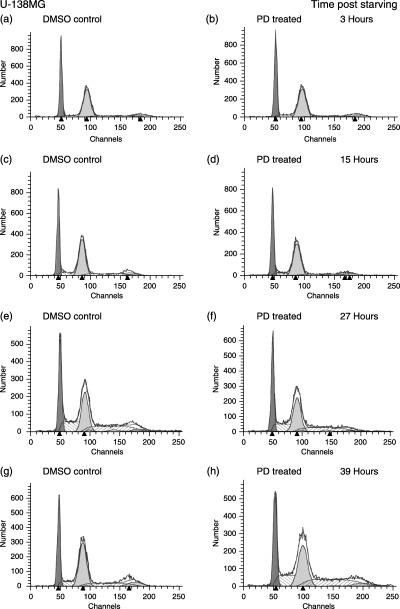
Effects of PD 406976 on U‐138MG cell cycle distribution as a function of time. FACS analysis of DNA replication during a mitotic time course. Cells were stimulated with 10% FCS and either 5.5 µl of DMSO/7 ml of media (controls; left column) or PD 406976 (2 µm; right column). Data are representative of two independent experiments. Number of events collected was 40 000 per time point and treatment group.
Cytostatic effects of PD 406976 on U‐373MG glioma cell and transformed glial SVG cell viability
The effects of continuous PD 406976 exposure on transformed glial SVG cell viability and proliferation was evaluated by trypan blue dye exclusion (Fig. 5). Cell viability was counted at 24, 48, 72 and 96 h following addition of either DMSO (vehicle control) or PD 406976 (1 or 2 µm). Incubation of transformed glial SVG cells with 1 µm PD 406976 did not decrease the viability of the SVG cells compared with controls (Fig. 5a). However, exposure of SVG cells to 2 µm PD 406976 significantly reduced the number of viable SVG cells at 42, 72 and 96 h post‐treatment (Fig. 5b). Subsequently, we established whether continuous PD 406976 exposure generally inhibited cell proliferation by comparing the effects of PD 406976 in SVG cells to that of U‐138MG and U‐373MG glioma cells (Fig. 6). PD 406976 (2 µm) significantly reduced the proliferation of SVG cells (P = 0.05 at 48 and 72 h; paired t‐test), U‐138 and U‐373MG cells at all times points (P = 0.01; paired t‐test). Additionally, PD 406976 was more effective in inhibiting the proliferation of SVG (69% decrease at 72 h; Fig. 6a) than of U‐373MG (46% decline at 72 h; Fig. 6b). These results are expected because the SVG cells are transformed glial cells but not tumourgenic, whereas the U‐373MG cells are tumourgenic (they form tumours in nude mice). These results indicate that PKC‐α, β, and µ may be required for cell proliferation.
Figure 5.
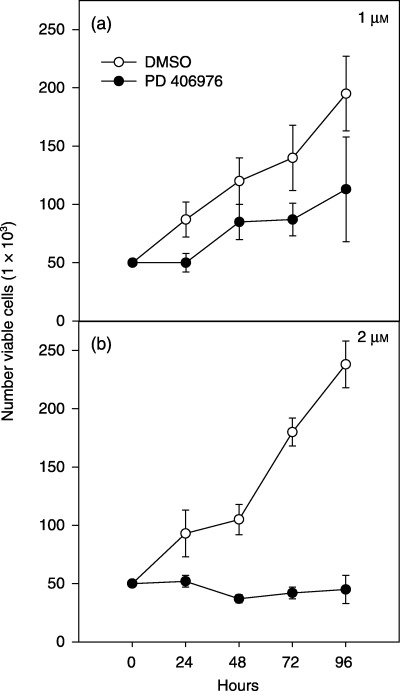
Cytostatic effects of PD 406976 on SVG cells. (○) SVG cells treated with DMSO (control, vehicle); (•) solid symbols SVG cells treated with 1 or 2 µm PD 406976, dissolved in DMSO. Results are means ± SEM for two independent experiments.
Figure 6.
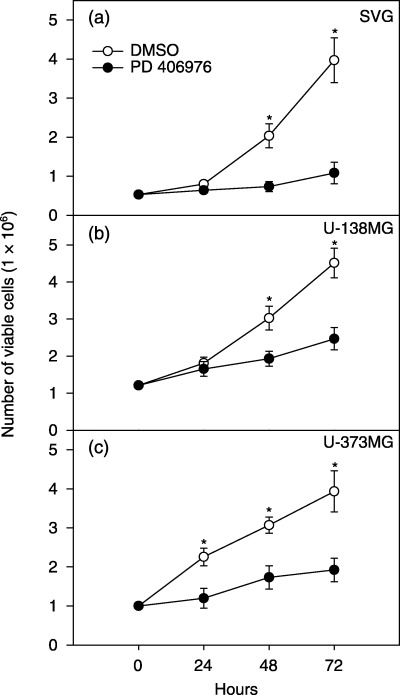
Cytocidal effects of PD 406976 on (a) SVG, (b) U‐138MG and (c) U‐373MG cells. Cells were plated on 75 cm2 flasks at a density of 1.0 × 10⁶ cells/flask. Twenty‐four hours post‐plating, cells were incubated with either DMSO (vehicle; control) or PD 406976 (2 µm, dissolved in DMSO). Following a 3‐day incubation with either DMSO or PD 406976, the number of viable cells were quantified by trypan blue dye exclusion assay. Results are means ± SEM of three independent experiments. (○) Control (DMSO‐treated) cells; (•) solid symbols represent cells treated with PD 406976 (2 µm).
In‐vitro effects of PD 406976 on PKC enzyme activity
The in‐vitro effects of PD 406976 (2 µm) on PKC activity were evaluated in SVG and U‐373MG cells. As shown in Fig. 7(a), exposure to PD 406976 (2 µm) decreased PKC enzyme activity in SVG cells by 63% at 48 h, and 70% at 72 h, post‐treatment. In U‐373MG cells, PD 406976 (2 µm) was more effective in diminishing PKC enzyme activity; 21% at 48 h, and 67% at 72 h post‐treatment (Fig. 7b). These data indicate that PD 406976 modulates the PKC signalling pathway, resulting in abatement of PKC activity.
Figure 7.
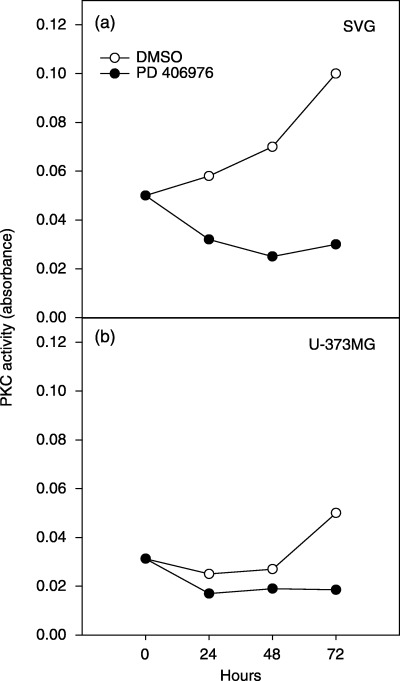
Temporal effects of PD 406976 on SVG and U‐373MG glioma cells PKC enzyme activity. Cells were exposed to either DMSO (vehicle, control) or PD 406976 (2 µm) for 24, 48 and 72 h. Protein kinase C enzyme activity was quantified by measuring the dye‐labelled phosphorylated substrate using a Pierce Colorimetric PKC Activity Assay Kit. Data shown are from three experiments. The standard deviations at each point are shown but the error is too small to be seen. (○) Control (DMSO‐treated) cells; (•) cells treated with PD 406976 (2 µm).
Western blotting
The effects of PD 406976 were most pronounced on two of the classical PKCs in both SVG and U‐373MG cells. PD 406976 had no significant effect on the expression of cPKC‐α (8, 9, 10) but greatly reduced the expression of cPKC‐βI and cPKC‐γ (8, 9, 10). In SVG cells, incubation with PD 406976 caused a rapid reduction (within 24 h) in the expression of cPKC‐βI (Fig. 9b). The amount that cPKC‐βI decreased was time dependent, the longer the incubation with PD 406976 the greater the reduction in cPKC‐βI protein content. In U‐373MG cells, PD 406976 had little or no effect for 24 h post‐treatment but by 72 h post‐treatment there was a 90% reduction of cPKC‐βI protein levels (Fig. 10b). In comparison, PD 406976 treatment caused a rapid decline in cPKC‐γ immunoreactivity in SVG cells (8, 9) and in U‐373MG cells there was a slight decrease in cPKC‐γ which remained constant over the incubation period (8, 10). These results may be expected as PD 406976 inhibits the classical PKCs (‐α and ‐β) as well as PKC‐µ. With the exception of aPKC‐τ, the expression levels of the rest of the tested PKCs (cPKC‐α, nPKC‐δ, and aPKC‐ζ) remained constant with or without PD 406976 treatment. Western blots of aPKC‐τ in SVG and U‐373MG cells depicted an immediate reduction of protein levels followed by a further gradual decrease over time (8, 9, 10). The mechanism by which inhibition of classical PKCs (‐α and ‐β) and PKC‐µ with PD 406976 provokes a reduction in aPKC‐τ is currently unknown. However, the PD 406976‐induced decrease of PKC‐τ is of interest as PKC‐τ protects cells from apoptosis (Murray & Fields 1997; Xie et al. 2000).
Figure 8.
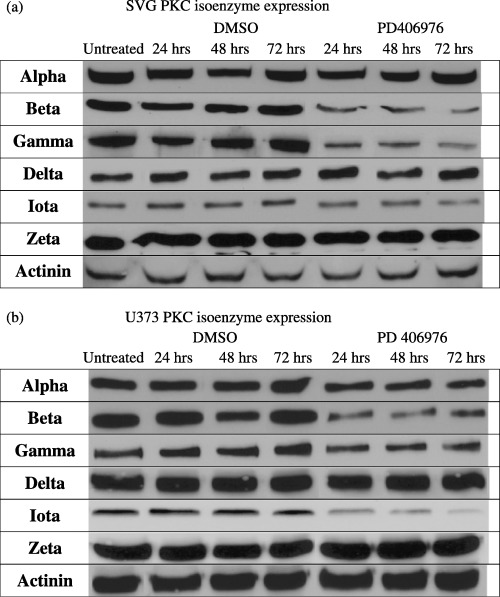
Western blot analysis of PKC isoenzyme expression in (a) SVG and (b) U‐373MG cells post‐PD 406976 treatment. Equal amounts of cellular protein (10 µg) were loaded per well and antibodies (used at 1 : 2000 dilutions; 0.1 µg/ml) against the antigens which were purchased from Santa Cruz Biotechnology (Santa Cruz, CA, USA) for PKC‐α (SC‐8393), PKC‐βI (SC‐8049), PKC‐γ (SC‐211), PKC‐δ (SC‐937), aPKC‐ζ (SC‐216), and actinin (SC‐1616) and from BD Transduction Laboratories (Lexington, KY, USA) for PKC‐τ (catalogue no. 610176). Secondary antibodies were obtained from Accurate (Westbury, NY, USA) (JGM035146, JGM025144) and were used at 1 : 15 000 dilution. Representative immunoblots from three independent experiments are shown.
Figure 9.
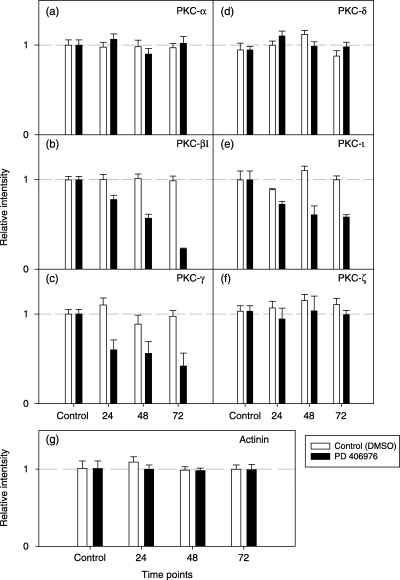
Normalization of SVG cells western band intensity. The intensity of each band was measured by the Scion Image program (Scion Corporation, Frederick, MD, USA). Samples treated with PD 406976 band intensities were normalized against samples treated with DMSO. Open bars represent control (DMSO‐treated) cells; solid bars represent cells treated with PD 406976 (2 µm).
Figure 10.
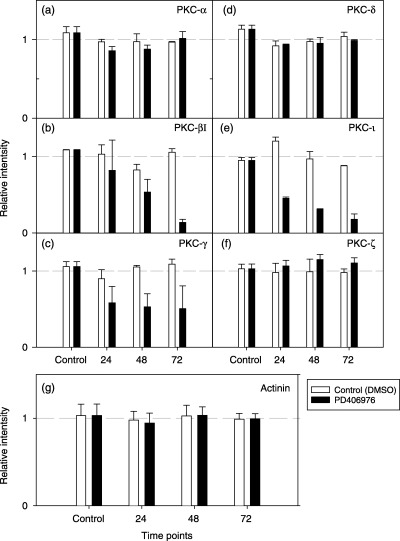
Normalization of U‐373MG cells western band intensity. The intensity of each band was measured by the Scion Image program (Scion Corporation). Samples treated with PD 406976 band intensities were normalized against samples treated with DMSO. Open bars represent control (DMSO‐treated) cells; solid bars represent cells treated with PD 406976 (2 µm).
PD 406976 does not induce apoptosis in transformed glial (SVG) cells or U‐373MG cells
The effect of PD 406976 on apoptosis was measured by flow cytometry of Annexin V‐FITC labelling (11, 12) and fluorescence microscopy (Fig. 13). The cells were tested for the induction of apoptosis at the same time points as those of the proliferation assay. Cells were treated with DMSO (vehicle, control) or 2 µm PD 406976. As the positive control for drug‐induced apoptosis, one flask was treated with 1 µm staurosporine dissolved in DMSO. The 1 µm of staurosporine induced a significant shift in binding of Annexin V‐FITC antibody represented by the shift to the right on the FACS analysis (11, 12). The DMSO control and PD 406976 cells did not cause any shift when analysed (11, 12). Both flow cytometry of Annexin V‐FITC labelling (11, 12) and fluorescense microscopy (Fig. 13) indicate that there was no induction of apoptosis by 2 µm PD 406976 treatment.
Figure 11.
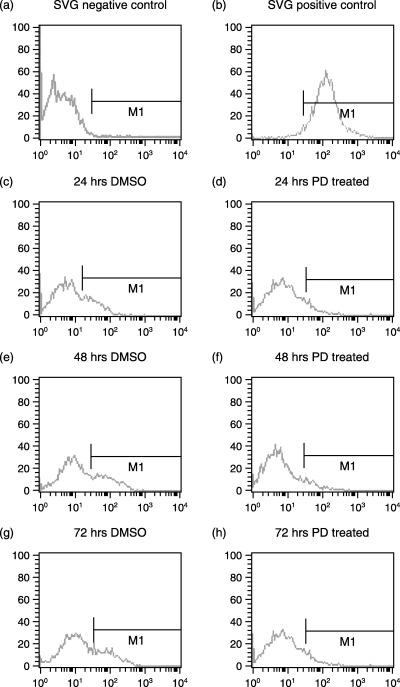
Annexin V‐FITC FACS analysis of apoptosis in transformed glial cells (SVG). (a) Cells untreated used to compensate the instrument, (b) positive control for apoptosis, the cells were treated with 1 µm staurosporine. The cells were incubated with either DMSO (vehicle, control) or PD 406976 (2 µm; dissolved in DMSO). Results are representative three independent experiments.
Figure 12.
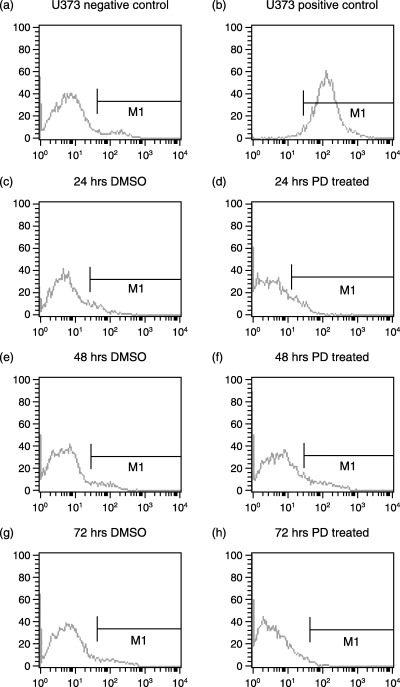
Annexin V‐FITC FACS analysis of apoptosis in U‐373MG cells. (a) Cells untreated used to compensate the instrument, (b) positive control for apoptosis, the cells were treated with 1 µm staurosporine. The cells were incubated with either DMSO (vehicle, control) or PD 406976 (2 µm; dissolved in DMSO). Results are representative three independent experiments.
Figure 13.
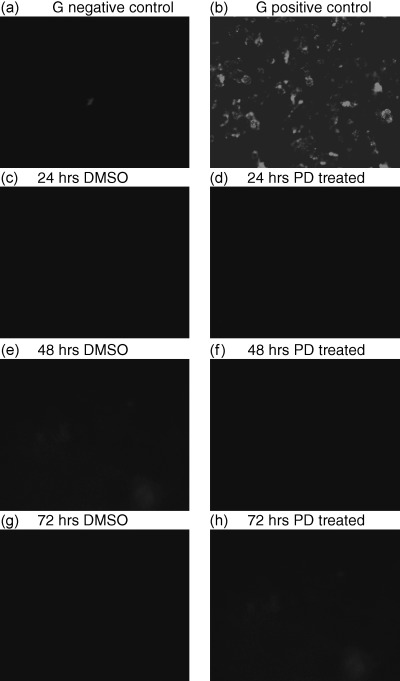
Annexin V‐FITC fluorescence microscopy analysis of apoptosis in SVG cells. (a) Untreated SVG cells with ≥ 90% viability; (b) SVG cells treated with 1 µm staurosporine, the positive control for apoptosis. The cells were incubated with either DMSO (vehicle, control) or PD 406976 (2 µm; dissolved in DMSO). Results are representative of three independent experiments.
DISCUSSION
Our experiments provide support for the involvement of PKC‐α, PKC‐β and/or PKC‐µ in cell cycle regulation of transformed SVG glial cells and glioma U‐138MG and U‐373MG cells. The data presented here have established that PD 406976 blocks G1/S entry in SVG cells and delays S‐phase progression in glioma U‐138MG and U‐373MG cells. Additionally, PD 406976 decreased SVG, U‐138 MG and U‐373MG cell proliferation, and decreased PKC activity as well as reduced PKC‐βI, PKC‐γ and PKC‐τ protein content. However, PD 406976 did not induce apoptosis. Other laboratories have tested the effects of bisindolymaleimide GE 109293X and Go 6976 (identical to PD 406976) on human glioblastoma cell lines and reported that inhibition of PKC‐ζ blocked the proliferation of the glioblastoma cell lines (Donson et al. 2000). Caution should be taken with interpretation of these results as the bisindolymaleimide GE 109293X and Go 6976 concentrations used were those for inhibition of purified PKC‐α, PKC‐βI, PKC‐βII, PKC‐γ, PKC‐δ, PKC‐ɛ PKC‐µ and PKC‐ζ, and not for inhibition of these PKC‐isozymes in intact cells. Although intracellular PKC isozyme content does not represent PKC enzyme activity levels, our study did not find any changes in PKC‐ζ protein levels post‐PD 406976 treatment. Collectively, previous reports and our results suggest that different PKC isozymes may play different roles in glioma cell cycle and proliferation depending on the specific glioma cell type. Thus, the need is present to concretely establish which PKC isozymes regulate glioma cell proliferation in order to develop anti‐PKC therapy for the treatment of human brain cancers.
ACKNOWLEDGEMENTS
Sincere thanks to Dr Wilbur R. Leopold III for the generous gift of PD 406976 (Parke Davis). We acknowledge the excellent contribution of the Flow Cytometry Core, H. Lee Moffitt Cancer Center. We are indebted to Jeff Painter for technical assistance and the analysis of apoptosis. This project was supported in part by and the Research Service of the Veterans Administration, Inhibetex Therapeutics Inc., The Dorr Foundation, The Oncologic Foundation of Buffalo and the Abraham J. & Phyllis Katz Foundation.
REFERENCES
- Acevedo‐Duncan M, Zhang R, Cooper DR, Greenberg H (1997) Effects interferon and PKC modulators on human glioma protein kinase C, cell proliferation and cell cycle. Neurochem. Res. 22, 775. [DOI] [PubMed] [Google Scholar]
- Allalunis‐Turner JM, Barron GM, Day RS , Fulton DS, Urtasun RC (1992) Radiosensitivity testing of human primary brain tumor specimens. Int. J. Radiat. Onco. Biol. Phys. 23, 339. [DOI] [PubMed] [Google Scholar]
- Bossy‐Wetzel E, Green D (2000) Detection of apoptosis by annexin V labeling. Meth. Enzymol. 322, 15. [DOI] [PubMed] [Google Scholar]
- Bradford MM (1976) A rapid and sensitive method for the quantitation of microgram quantities of protein utilizing the principle of protein‐dye binding. Anal. Biochem. 72, 248. [DOI] [PubMed] [Google Scholar]
- Carlton JC, Terry NHA, White A (1991) Measuring potential doubling times of murine tumors using flow cytometry. Cytometry 12, 645. [DOI] [PubMed] [Google Scholar]
- Couldwell W, Antel JP, Apuzzo MLJ, Yong VW (1990) Inhibition of growth of established human glioma cell lines by modulators of the protein kinase‐C system. J. Neurosurg. 73, 594. [DOI] [PubMed] [Google Scholar]
- Donson AM, Banerjee A, Gamboni‐Robertson F, Fleitz JM (2000) Protein kinase C zeta isoform is critical for proliferation in human glioblastoma cell lines. J. Neuro-Oncol. 47, 109. [DOI] [PubMed] [Google Scholar]
- Hans EK, Cacace AM, Sgambato A, Weinstein IB (1995) Altered expression of cyclins and c‐fos in R6 cells that overproduce PKCe. Carcinogenesis 16, 2423. [DOI] [PubMed] [Google Scholar]
- Hayashi A, Seki N, Hattori A, Kozuma S, Saito T (1999) PKCn, a new member of the protein kinase C family, composes a fourth subfamily with PKCm. Biochim. et Biophys. Acta. 1450, 99. [DOI] [PubMed] [Google Scholar]
- Hirai T, Niino Y, Chida K (2003) PKC zeta II, a small molecule of protein kinase C zeta, specifically expressed in mouse brain. Neurosci. Lett. 348, 151. [DOI] [PubMed] [Google Scholar]
- Housey GM, Johnson MD, Hsiao WLM, O'Brian CA, Murphy JP, Kirschmeier P, Weinstein IB (1988) Overproduction of protein kinase C causes disordered growth control in rat fibroblasts. Cell 52, 343. [DOI] [PubMed] [Google Scholar]
- Kamata T, Sullivan NF, Wooten MW (1987) Reduced protein kinase C activity in a ras‐resistant cell line derived from Ki‐MSV transformed cells. Oncogene 1, 37. [PubMed] [Google Scholar]
- Laemmli UK (1970) Cleavage of structural proteins during the assembly of the head of bacteriophage T4. Nature 237, 680. [DOI] [PubMed] [Google Scholar]
- Levin DE, Fields FO, Kunisawa R , Bishop JM, Thorner J (1990) A candidate protein kinase C gene, PKC1, is required for the S. cerevisiae cell cycle. Cell 62, 213. [DOI] [PubMed] [Google Scholar]
- Major EO, Miller AE, Mourrain P, Traub RG, De Widt E (1985) Establishment of a line of human fetal glial cells that supports JC virus multiplication. Proc. Natl Acad. Sci. USA 82, 1257. [DOI] [PMC free article] [PubMed] [Google Scholar]
- Mandil R, Ashkenazi E, Blass M, Kronfeld I, Kazimirsky G, Rosenthal G, Umansky F, Lorenzo PS, Blumberg PM, Brodie C (2001) Protein kinase Calpha and protein kinase Cdelta play opposite roles in the proliferation and apoptosis of glioma cells. Cancer Res. 61, 4612. [PubMed] [Google Scholar]
- Mizuguchi J, Nakabayashi H, Yoshida Y, Huang KP, Uchida T, Sasaki T, Ohno S, Suzuki K (1988) Increased degradation of protein kinase C without diminution of mRNA level after treatment of WEH1‐231 B lymphoma cells with phorbol esters. Biochem. Biophy. Res. Commun. 155, 1311. [DOI] [PubMed] [Google Scholar]
- Murray NR, Fields AP (1997) Atypical protein kinase C iota protects human leukemia cells against drug‐induced apoptosis. J. Biol. Chem. 272, 27521. [DOI] [PubMed] [Google Scholar]
- Nishizuka Y (1992) Intracellular signalling by hydrolysis of phospholipids and activation of protein kinase C. Science 258, 607. [DOI] [PubMed] [Google Scholar]
- Persons DA, Wilkison WO, Bell RM, Finn OJ (1988) Altered growth regulation and enhanced tumorigenicity of NIH 3T3 fibroblasts transfected with protein kinase C‐I DNA. Cell 52, 447. [DOI] [PubMed] [Google Scholar]
- Pollack IF, Randall MS, Kristofik MP, Kelly RH, Selker RG, Vertosick FT Jr (1990) Response of malignant glioma lines to activation and inhibition of protein kinase C mediated pathways. J. Neurosurg. 73, 98. [DOI] [PubMed] [Google Scholar]
- Ponten J, MacIntyre EH (1968) Long‐term culture of normal and neoplastic human glia. Act. Pathol. Microbiol. Scand. 74, 465. [DOI] [PubMed] [Google Scholar]
- Russell SJ, Ye YW, Waber PG, Shuford M, Schold SC Jr, Nisen PD. (1995) p53 mutation, O6‐alkylguanine DNA alkytransferase activity, and sensitivity to procarbazine in human brain tumors. Cancer 75, 1339. [DOI] [PubMed] [Google Scholar]
- Selbie LA, Schmitz‐Peiffer C, Sheng Y, Biden T (1993) Molecular cloning and characterization of PKCι, an atypical isoform of PKC derived from insulin‐secreting cells. J. Biol. Chem. 268, 24296. [PubMed] [Google Scholar]
- Tenzer A, Zingg D, Rocha S, Hemmings B, Fabbro D, Glanzmann C, Schubiger PA, Bodis S, Pruschy M (2001) The phosphatidylinositide 3′‐kinase/Akt survival pathway is a target for the anticancer and radiosensitizing agent PKC412, an inhibitor of protein kinase C. Cancer Res. 61, 8203. [PubMed] [Google Scholar]
- Towbin H, Staehelin T, Gordon PE (1979) Electrophoretic transfer of proteins from polyacrylamide gels to nitrocellulose sheets: procedure and some applications. Proc. Natl Acad. Sci. USA 76, 4350. [DOI] [PMC free article] [PubMed] [Google Scholar]
- Van Engeland LJW, Nieland FCS, Ramaekers BS, Reutelingsperger CPM (1998) Annexin V‐affinity assay: a review on an apoptosis detection system based on phosphatidylserine. Cytometry 31, 1. [DOI] [PubMed] [Google Scholar]
- Weyman CM, Taparowsky EJ, Wolfson M, Ashendel CL (1988) Partial down‐regulation of protein kinase C in C3H10tl/2 mouse fibroblasts transfected with the human Ha‐ras oncogene. Cancer Res. 48, 6535. [PubMed] [Google Scholar]
- Xie J, Guo Q, Zhu H, Wooten M, Mattson M (2000) Protein kinase Cι protects neural cells against apoptosis induced by amyloid β‐peptide. Mol. Brain Res. 82, 107. [DOI] [PubMed] [Google Scholar]


