Abstract
Objectives: The major goal of anti‐cancer therapies is selective destruction of tumour cells with minimum side effects on normal cells. Towards this aim, combination of different therapeutic modalities has been evaluated for improving control of neoplastic diseases and quality of life for the patient. Photodynamic therapy (PDT) is a procedure for treatment of various types of cancer, but its combination with other established treatments has not been evaluated in detail. We have used KYSE‐510 cells from a human oesophageal carcinoma as an in vitro model to investigate whether cisplatin (CDDP) could be combined with PDT to increase cell death with respect to single treatments.
Materials and methods: p53‐mutated KYSE‐510 cells were treated with CDDP alone or in combination with PDT. Analyses of cell viability, cell cycle progression and apoptosis induction were carried out at specific times after treatments.
Results: Decrease in cell viability, cell cycle arrest at the G2/M‐ and S‐phases boundary, and apoptosis induction were observed after single and combined treatments.
Conclusions: Our results show that low CDDP doses (0.25–1 μm) induce cell mortality and cell cycle perturbation, which were more evident when given in combination with PDT, but in contrast to work of other authors no synergistic activity was found. Apoptosis occurred via intrinsic pathways in treated cells, although it did not represent the predominant mode of cell death.
Introduction
Cisplatin [cis‐diammine‐dichloroplatinum(II)] (CDDP) is a chemotherapeutic agent widely used in treatment of several types of cancer, including testicular, ovarian, cervical, head and neck, lung and oesophageal malignancies (1, 2). CDDP binds to DNA and forms intra‐ and inter‐strand crosslinks, which interfere with DNA replication/transcription, blocking cell cycle progression and promoting cell death. While it is generally accepted that formation of adducts to nuclear DNA is the major factor of CDDP cytotoxicity, additional cell components such as mitochondrial DNA, membrane phospholipids and cytoskeletal elements have been described as affected targets contributing to its antitumour activity (3). CDDP is a potent anti‐cancer agent but its application can be limited due its side effects, in particular neurotoxicity is dose‐limiting, and also inherent and acquired resistance can exist (4). CDDP alone induces DNA damage, arrest of the cell cycle at a specific G2/M checkpoint, followed by apoptosis induction in a variety of proliferating cells (5, 6, 7, 8, 9). Antitumour effects of CDDP have been evaluated also in combination with a number of non‐platinum drugs such as antimetabolites, taxanes and topoisomerase inhibitors (10, 11). Preclinical and clinical investigations on these combination therapies have provided contradictory results as cytotoxic effects ranged from synergy to antagonism between the components and appeared to depend strongly on schedules applied and tumour cell types (12, 13, 14). A few preclinical studies have also been performed to establish potential advantages produced through combination of CDDP treatment with photodynamic therapy (PDT) (15, 16). PDT is a recently emerging modality of cancer treatment based on administration of a photosensitizing drug, that once taken up by cancer cells is activated by irradiation with light from red wavelength spectra (600–800 nm) (17, 18). Apoptotic or necrotic cell death can be caused by reactive oxygen species, mainly singlet oxygen radicals, produced by the activated photosensitizer (19).
In the present study, we investigated the possibility of treating oesophageal squamous cell carcinoma using combination of conventional chemotherapy with CDDP, and PDT with Photofrin as photosensitizer. Oesophageal cancer, globally, has highly heterogeneous geographical distribution with regions of low and high incidence. In China, it is the fourth leading cause of cancer death, and in most Western countries the incidence is rising (20). It has been estimated that more than 85% of oesophageal cancer patients die within 2 years of diagnosis due to late stages of the condition at presentation and consequent inefficacy of treatment to produce long‐term survival. PDT, in general, is used for palliative treatment of obstructive carcinomas, while only few patients with superficial oesophageal carcinomas and high‐grade Barrett’s dyplasia have been treated with PDT as curative intent (21, 22). Squamous cell carcinoma is the major histological type of oesophageal cancers and its development is associated with mutation of the p53 tumour suppressor gene, disruption of cell cycle control mechanisms and activation of oncogenes (for example, EGFR, c‐myc) (23). We used p53‐mutated KYSE‐510 cells as in vitro model of human oesophageal carcinoma, to evaluate possible positive interaction between CDDP and PDT in terms of cell mortality, so that doses of the individual agents could be kept low to avoid major side effects, but of sufficient level to produce relevant therapeutic responses. In this study, we show that low doses of cisplatin induced cell cycle alterations and cell death in KYSE‐510 cells and that its combination with PDT increased cytotoxic effects, more evident by comparing fraction of cell death occurring by non‐apoptotic means.
Materials and methods
Cell line and chemicals
The human oesophageal squamous carcinoma cell line KYSE‐510 was purchased from Deutsche Sammlung von Mikroorganismen und Zellkulturen GmbH/Braunschweig (DSMZ, Germany). KYSE‐510 cells were cultured in RPMI 1640 medium supplemented with 10% heat‐inactivated foetal bovine serum (FBS) (Gibco, Invitrogen, Carlsbad, CA, USA), 1 mm l‐glutamine, 38 units/ml streptomycin and 100 units/ml penicillin G (Sigma‐Aldrich, St. Louis, MO, USA). Cell cultures were kept at 37 °C in a humidified atmosphere containing 5% CO2. Cells were re‐seeded every 3 days, before reaching confluence. The photosensitizer Photofrin II (a haematoporphyrin derivative) was purchased from Axcan Pharma Inc. (Mont‐Saint‐Hilaire, Canada) as freeze‐dried powder and was dissolved in water containing 5% glucose to obtain a 2.5 mg/ml stock solution. Small aliquots of the stock were stored at −20 °C and diluted to desired concentrations in the cell culture medium immediately before use. CDDP (Sigma‐Aldrich) was dissolved in DMSO at a concentration of 2 mm and used freshly after appropriate dilution in the cell culture medium.
Photodynamic and chemotherapeutic treatments
For photodynamic treatment, 5 × 10⁴ cells were seeded in duplicate in 35 mm diameter dishes with 2 ml of RPMI 1640 containing 10% FBS, and were allowed to attach for 24 h. After this, cells reached exponential growth phase and medium was replaced with fresh RPMI containing 3% FBS; after 8 h, cells were incubated in 2.5 μg/ml Photofrin for 16 h and washed twice in phosphate‐buffered saline (PBS) before exposure to increasing doses of the appropriate red light. Irradiations were performed at room temperature, keeping cells in PBS, which was replaced with complete culture medium immediately after irradiation. The light source was a PTL Penta quartz‐halogen lamp (model STL‐B‐049, Desys SA, S. Antonino, Switzerland) equipped with a bundle of optical fibres and filters that allowed selection of light wavelengths in the range of 600–700 nm. Light fluence rate at the level of the cell monolayer was fixed at 5 mW/cm2 while time of irradiation was varied accordingly to administer increasing doses of light (0–3.75 J/cm2). Irradiated cells were retained in the incubator for 24 h until selected responses of cells to the treatment were analysed.
For treatment with CDDP, cell samples were prepared as described for photodynamic treatment. One day after seeding, cell culture medium was removed and replaced with fresh medium containing 3% FBS, and increasing concentrations of CDDP (0–5 μm). Cells were kept in the incubator for 24 h in presence of the drug and after this incubation period, the drug was removed by replacing drug‐containing medium with drug‐free complete medium. Cells were retained in the incubator for 24 h until specific analyses were performed.
Cells treated with the combination of chemotherapy and PDT were incubated almost simultaneously with CDDP and Photofrin and then irradiated with the selected dose of appropriate red light. One day after seeding, cells were exposed to selected CDDP concentrations (0.25, 1 and 5 μm) and after 8 h, Photofrin (2.5 μg/ml) was added and incubation continued for an additional 16 h. After 24 h incubation with CDDP, of which 16 h was with Photofrin, both drugs were removed, cells were washed twice and irradiated in PBS with light dose of 1.8 J/cm2. Immediately after irradiation, PBS was replaced with complete culture medium and the cells were again retained in the incubator for 24 h. To evaluate effects of CDDP plus Photofrin in the dark, some cell samples were treated as described earlier but not exposed to light.
Cell viability
Viability of KYSE‐510 cells was determined by the trypan blue dye exclusion test, MTS [(3‐(4,5‐dimethylthiazol‐2‐yl)‐5‐(3‐carboxymethoxyphenyl)‐2‐(4‐sulphophenyl)‐2H‐tetrazolium)] and clonogenic assays. For trypan blue exclusion, fraction of viable cells of treated samples was calculated based on number of trypan blue‐negative cells in comparison to untreated controls. MTS assay was performed using CellTiter 96® Aqueous One Solution Cell Proliferation Assay (Promega, Madison, WI, USA), which provides indication of mitochondrial integrity and activity, which is interpreted as measurement of cell viability. The assay displays ability of the cells to convert yellow tetrazolium salt to purple 1‐(4,5‐dimethylthiazal‐2‐yl)‐3,5‐diphenyl formazan by mitochondrial dehydrogenase activity of living cells. Briefly, 1 × 10³ cells/well were seeded in triplicate in 96‐well plates in RPMI medium with 10% FBS, and measurements of cell dehydrogenase activity to form purple formazan by MTS were performed by adding 20 μl CellTiter 96® Aqueous One Solution Reagent to 100 μl serum‐free media in each well, followed by 1 h incubation at 37 °C in the dark. Amount of the formazan product formed is directly proportional to number of living cells; therefore, cell proliferation can be quantified by recording absorbance at 490 nm using a 96‐plate reader (Spectramax 190; Molecular Devices, Orleans Drive Sunnyvale, CA, USA). Cell viability was determined by comparing values with untreated control sets, where mean value of control was considered to be 100%. For colony‐forming assays, five culture dishes (60 mm diameter) were seeded with 100 treated cells in 5 ml complete medium at the end of 24 h incubation with CDDP alone, combined with PDT, and with PDT alone, and five dishes were plated with untreated cells as controls for each experiment. Cells were grown for 10–12 days before being stained with crystal violet for colony counting (only colonies with more than 50 cells were considered for the determination). Control dishes were used to calculate cloning efficiency (CE) as proportion of number of colonies versus number of cells seeded, and the surviving fraction was determined as ratio between CE of treated cells to that of untreated cells.
Cell cycle analyses
Effects of single or combined treatments on cell cycle progression were analysed by flow cytometry at selected times. Cells (1.5 × 10⁶) were harvested, fixed in 70% cold ethanol and stored at 4 °C at least overnight. Before analysis, cells were washed in distilled water, centrifuged and resuspended in 1 ml PBS containing 50 μg/ml propidium iodide (PI, Sigma) and 100 μg/ml rnase, for DNA staining. Samples were incubated for 1 h at 37 °C and then analysed in a FACScan flow cytometer (BD Biosciences, San Jose, CA, USA) using CellQuest and ModFit LT 3.0 softwares (BD Biosciences, San Jose, CA, USA), respectively, for data acquisition and cell cycle distribution analysis.
Identification of apoptotic cells
Apoptosis was determined by morphological analyses of KYSE‐510 cells at 7 (24 h + 7 h) and 24 h (24 h + 24 h) after treatment with CDDP alone, combined with PDT, PDT alone and of untreated control cells. At each time point, 1 × 10⁶ cells were collected, centrifuged and incubated in the dark for 15 min at 37 °C with 1.5 μg/ml Hoechst 33342 (Sigma). Apoptotic morphology was also detected after nuclear staining with DAPI (4,6‐diamino‐2‐phenylindol). Briefly, 1 × 10⁶ cells were washed once in Hank’s solution then fixed in ice‐cold ethanol: acetic acid (9:1) solution following standard procedures. Fixed cells were placed on clean slides and finally stained in 2 μg/ml DAPI (Roche Diagnostics, Indianapolis, IN, USA) in anti‐fade solution (Vectashield; Vector Laboratories, CA, USA). Images of cells stained either with Hoechst 33342 or DAPI were captured using a Leica DMR fluorescence microscope equipped with a Leica DC 300F videocamera and CASTI IMAGENT software for image analysis (63× magnification). Counting of apoptotic cells was carried out on images captured by the microscope. A total of 400 (Hoechst stained) and 2000 (DAPI stained) cells were scored by eye for nuclear morphology at each time point and treatment, by two different persons. Apoptotic cells (Fig. 1) were expressed as percentage of total cells determined in the cell sample analysed. Four independent experiments were carried out and average of the scores was used; values are expressed as the mean ± SE and differences were compared using Student’s t‐test.
Figure 1.
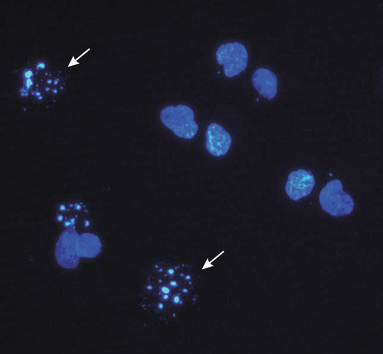
Fluorescence micrograph of treated KYSE‐510 cells stained with DAPI. White arrows point typical apoptotic nuclei (power of magnification 63×).
Measurement of mitochondrial membrane potential
To test whether single or combined treatments could induce decrease in mitochondria trans‐membrane potential, untreated and treated cells were analysed by flow cytometry after staining with the potential sensitive probe JC‐1. Cells (0.5 × 10⁶) were incubated in the dark with 4.5 μm JC‐1 for 30 min at 37 °C, washed and analysed. Changes in green (FL1) fluorescence emitted by the JC‐1 monomers were measured at various times after single or combined treatments (24).
Subcellular fractionation and SDS–PAGE
Cells (3 × 10⁶) were harvested, centrifuged, washed in PBS 1×, and digitonin‐permeabilized for 5 min on ice in cytosolic extraction buffer, following the procedure described by Adrain et al. (25). Cell plasma membrane permeability/non‐permeability was confirmed by trypan blue staining. Cells were then centrifuged for 5 min at 1000 g at 4 °C and supernatants (cytosolic fraction) were recovered. Pellets were resuspended in mitochondrial lysis buffer for 15 min on ice, centrifuged at 10 000 g for 10 min at 4 °C and recovered. Twenty micrograms of each subcellular fraction was separated on 12% SDS–polyacrylamide gels and transferred to nitrocellulose membranes (Hybond‐C Extra; Amersham, GE HealthCare, Piscataway, NJ, USA). Membranes were then probed with primary antibodies: anti‐cytochrome c (BioSource International, Camarillo, CA, USA; 1:1000), anti‐BAX (Santa Cruz Biotechnology, Santa Cruz, CA, USA, 1:200), anti‐BCL‐2 (Becton Dickinson, 1:200), anti cyclin B1 (Santa Cruz Biotechnology, 1:200) and anti β‐actin (Sigma, 1:5000) and then incubated with Amersham ECL horseradish peroxidase‐conjugated secondary antibodies (GE Healthcare, 1:40.000). Resulting immunoreactive bands were detected using enhanced chemioluminescent HRP substrate (Millipore, Billerica, MA, USA). Signal intensities of bands were measured and analysed using ImageJ program (National Institutes of Health).
Immunofluorescence staining for BAX, BCL‐2, cytochrome c and cyclin B1
KYSE‐510 cells were grown on glass coverslips for 24 h before treatments. Treated and control cells were fixed in 4% formaldehyde (Sigma), permeabilized with 0.2% Triton X‐100 in PBS at 37 °C for 10 min and blocked in 10% goat serum‐PBS for 1 h at room temperature. Coverslips/cells were then incubated for 2 h at room temperature with primary antibodies, mouse monoclonal anti‐cytochrome c (Biosource, 1:200), rabbit polyclonal anti‐BAX (Santa Cruz Biotechnology Inc., 1:200), mouse monoclonal anti‐BCL‐2 (Becton Dickinson, 1:50) and mouse monoclonal anti‐cyclin B1 (Santa Cruz, 1:50). Cells were washed twice in PBS and incubated in secondary antibodies, Alexa Fluor® 488 goat anti‐mouse and Alexa Fluor® 594 donkey anti‐rabbit (Molecular Probes, Invitrogen, Carlsbad, CA, USA; 1:350), for 1 h at room temperature. Cells were washed, counterstained with 2 μg/ml DAPI (4,6‐diamidino‐2‐fenilindole) in anti‐fade solution and cells on the coverslips were mounted. Immunofluorescence images were captured using an epifluorescence microscope (Leica 5000, Wetzlar, Germany) equipped with a CCD imaging system and MRC‐1024 Laser Scanning Confocal Imaging System (Bio‐Rad, Hercules, CA, USA). Spaced (0.5 μm) optical sections were recorded with the focus motor using a 100× oil‐immersion objective. Images were processed using the Adobe PhotoShop 8.0 software (Adobe, San José, CA, USA).
Results
Cell survival after single or combined treatments
To investigate whether CDDP and PDT had positive interaction with mortality of KYSE‐510 cells when given in combination, we first established dose–response curves for the two individual treatments. Effects of chemotherapy alone on viability of KYSE‐510 cells were determined after 24 h exposure to increasing concentrations of CDDP. The dose–response curve obtained after trypan blue dye exclusion showed that CDDP concentrations of as much as 1 μm killed up to 80% of cells, whereas the remaining fraction appeared to be more resistant to treatment, and increase of CDDP concentration to 5 μm induced further 10% cell death only (Fig. 2a). Effects of PDT on cell viability were determined using a fixed concentration of photosensitizer (Photofrin) equivalent to 2.5 μg/ml,and increasing doses of the appropriate red light (Fig. 2b). Concentration of Photofrin was selected on the basis of preliminary studies showing that concentrations higher than 2.5 μg/ml are toxic for KYSE‐10 cells, even in the dark. Therefore, cells were incubated for 16 h with Photofrin and then irradiated with doses of light up to 3.75 J/cm2. Subsequent experiments with combined treatment were performed using 2.5 μg/ml Photofrin and 1.8 J/cm2 light as dose of PDT, which produced 50% cell mortality (Fig. 2b), and CDDP concentrations of 0.25, 1 and 5 μm. Interaction between chemotherapy with CDDP and Photofrin‐PDT was assessed by comparing cell viability, determined at the end of single or combined treatments, with trypan blue dye exclusion and MTS assays (Fig. 3). In general, fraction of viable cells determined by trypan blue exclusion was lower than that measured by MTS, this was probably due to specific features of the two assays; MTS assay measures residual dehydrogenase activity present also in dying cells, whereas trypan blue penetrates only in dead cells, not living ones. Nevertheless, both assays showed the same trend; KYSE‐510 cells subjected to combined treatments were generally less viable with respect to those treated by chemotherapy only, and in many cases the differences were significant. Contribution of Photofrin in cells incubated in the dark with CDDP did not decrease cell viability significantly (not shown). Colony formation assay is an in vitro cell survival test based on ability of a single cell to grow into a colony consisting of at least 50 cells. For the lower dose of cisplatin analysed, that is 0.25 μm, significant decrease in cell survival after combined therapy with respect to single treatments (42.8% CDDP 0.25 μm alone versus 20.7% CDDP + PDT, P < 0.05) was observed. After treatment with higher doses (1 and 5 μm), cells almost completely lost the colony forming ability (5% and 0% of cell survival with CDDP 1 and 5 μm, respectively Fig. 3c).
Figure 2.
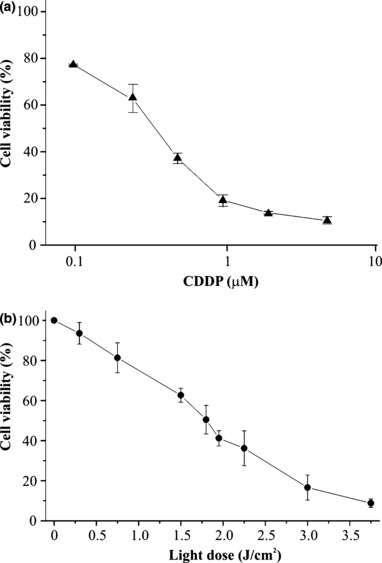
Dose–response curves after treatments with CDDP and PDT with Photofrin. KYSE‐510 cells were exposed to increasing doses of CDDP (0–5 μm) for 24 h and then incubated for 24 h in fresh complete medium (a). Cells were incubated in the dark for 16 h with 2.5 μg/ml Photofrin, irradiated with increasing red light doses (0–3.75 J/cm2) and incubated for 24 h in fresh complete medium (b). Values are expressed as mean percentage ± SD of Trypan blue negative cells with respect to untreated and unirradiated controls, of 3–4 independent experiments.
Figure 3.
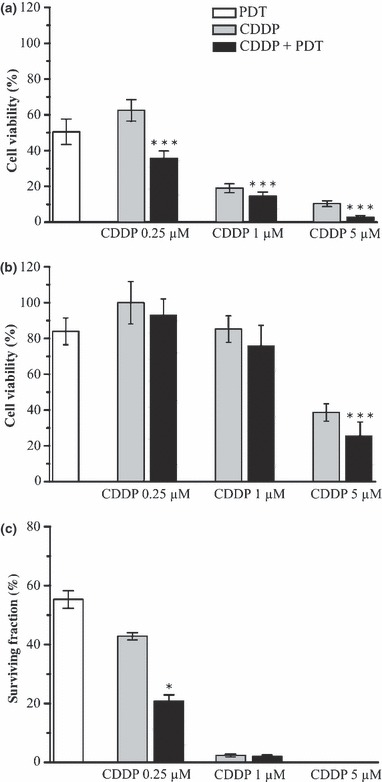
Cytotoxicity in KYSE‐510 cells after treatments with CDDP alone, PDT alone and in combination. Cell viability was determined by Trypan blue dye exclusion test (a), MTS assay (b) and clonogenic assay (c) 24 h after the end of each treatment. Surviving fraction was determined as the ratio between the cloning efficiency of treated and that of untreated cells and expressed in percentage. In all cases values represent the mean ± SD of 3–5 independent experiments (*P < 0.05; ***P < 0.001, combined versus single treatments, t‐test).
Cell cycle progression after single or combined treatments
To investigate the mechanism of interaction between CDDP and Photofrin‐PDT, we monitored progression of cell cycle after each treatment, administered alone or in combination. KYSE‐510 cells were analysed by flow cytometry at 8 h treatment with CDDP (that is, time at which Photofrin was added to the cells in the combined treatment), at the end of treatment/s (24 h) and 24 h later (24 h + 24 h) (Fig. 4). Presence of Photofrin in the dark neither induced appreciable alteration with respect to untreated control cells when administered alone, nor modified effect of CDDP when combined with it (not shown). After 8 h exposure to 0.25, 1 or 5 μm CDDP alone, no alteration in cell cycle progression was observed with respect to control cells. At the end of 24 h incubation, we detected cell cycle changes by function of the CDDP dose: G2/M arrest with 0.25 and 1 μm CDDP (28% and 46%, respectively) and S‐phase block with 5 μm CDDP (85%). After removal of CDDP and 24 h release in drug‐free medium, G2/M block persisted in 0.25 and 1 μm CDDP‐treated cells (25% and 62%, respectively). Five micromolar CDDP at 24 h + 24 h was highly cytotoxic and analyses of cell cycle progression were difficult to perform: S‐phase block (52%) as well as G2/M block (48%) persisted and appeared even in a high fraction of ‘sub G1’ DNA content (∼70%). Cells subjected to combined treatment with PDT were arrested in a similar manner but, with respect to single treatment, showed a fraction of cells with ‘sub‐G1’ DNA content that increased with dose of cisplatin: 28%, 44% and 76% with 0.25, 1 and 5 μm CDDP, respectively. At the same time point, cells treated with PDT alone showed a 17%‘sub G1’ DNA content versus ∼2% in control cells. To investigate whether the G2/M block induced by CDDP treatment was related to increase in cyclin B1, we analysed its expression by western blotting and immunofluorescent staining. CDDP, either alone or in combination with PDT, slightly increased cyclin B1 expression over control cells (∼1.7‐fold). As expected from cell cycle analyses, PDT alone did not induce appreciable increase in amount of cyclin B1 (Fig. 5).
Figure 4.
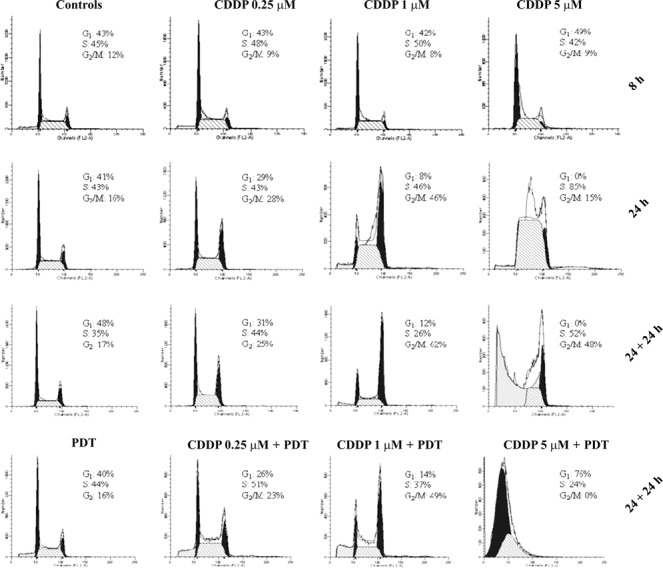
Representative histograms of cell cycle distribution of KYSE‐510 cells after treatments with CDDP alone, PDT alone and in combination. Flow cytometric analyses were carried out at 8 h of treatment with CDDP, at the end of treatment/s (24 h) and 24 h later (24 h + 24 h). CDDP alone induced cell cycle arrest at the boundary of G2/M‐ and S‐phases after a 24 h incubation and blocks persisted 24 h after the end of treatments. In cells subjected to combined treatments appeared the ‘sub‐G1’ DNA content which increased with dose and was significantly higher for CDDP 0.25 and 1 μm compared with CDDP alone: 28% versus 2% (P < 0.01, t‐test), and 44% versus 18% respectively (P < 0.05, t‐test). CDDP 5 μm was highly cytotoxic and the sub‐G1 DNA content was about 70%. PDT alone caused a 17% of ‘sub G1’ DNA content versus about 2% in untreated control cells.
Figure 5.
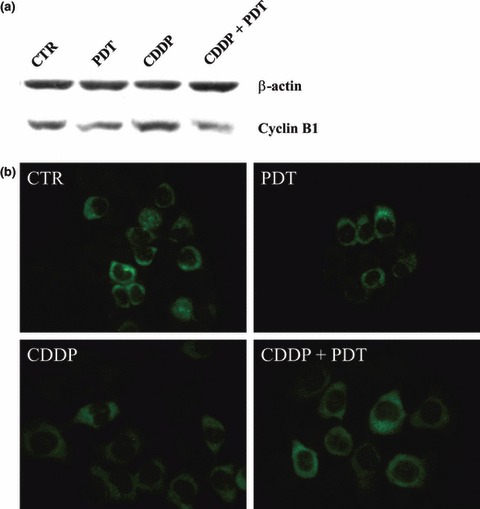
Expression analyses of cyclin B1 in control and treated KYSE‐510 cells. SDS–PAGE performed 24 h after the end of individual (PDT; CDDP 1 μm) or combined (PDT + CDDP 1 μm) treatments (a). Immunolocalization of cyclin B1 in cells accumulated in S‐ and G2 phases (b).
Induction of apoptosis after single and combined treatments
Oesophageal squamous carcinoma KYSE‐510 cells carry a deletion of 32 bp in exon 7 of the p53 gene that creates a stop codon at position 263 (26). The truncated p53 protein should maintain a greater part of the DNA binding domain, and thus could be able to exert its pleiotropic role. To verify whether KYSE‐510 cells possess truncated p53 protein, we tested its presence in untreated and treated cells by immunoblotting analyses using an antibody mapping to the amino terminus of p53 (Fig. 6). TK6 cells p53 (+/+) irradiated with γ‐rays (5 Gy) were used as positive control for p53 activation. No band corresponding to truncated protein was detected, indicating that in KYSE‐510 cells, the stress response takes place in a p53‐independent way.
Figure 6.
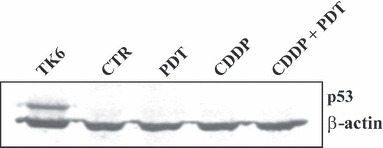
Immunoblotting analyses of p53 protein in control and treated KYSE‐510 cells. Twenty micrograms of protein extracts from control cells and cells incubated 24 h in fresh medium after the end of individual (PDT; CDDP 1 μm) or combined (PDT + CDDP 1 μm) treatments, were subjected to 12% SDS–PAGE. TK6 cells irradiated with 5Gy of γ‐rays were used as positive control for p53 detection.
Occurrence of apoptosis was evaluated in KYSE‐510 cells, after single or combined treatment with the selected dose of CDDP 1 μμ, by morphological assay, based on nuclear staining observed by fluorescence microscopy. KYSE‐510 cells were treated with PDT (2.5 μg/ml of Photofrin and 1.8 J/cm2 of light) alone, CDDP alone or combined with PDT and percentages of apoptotic cells were determined 7 and 24 h after end of treatments (Fig. 7). No induction of apoptosis was detected in cells incubated in the dark with Photofrin only (A.I. = 1.8%, not shown). After PDT, we found an ∼5‐fold increase of apoptotic cells at both times analysed (∼4% versus ∼0.8%), similar to that observed at 7 h after treatment with CDDP alone (A.I. = 5.1%). Combination of PDT and CDDP increased apoptotic cells at 7 h after treatment (A.I. = 9.5%), whereas at 24 h + 24 h, extent of apoptosis was similar to that of CDDP alone (21% versus 19%, respectively). Cytometric assessment of apoptotic cells as ‘sub‐G1 peak’ failed due to presence of a high fraction of nuclear fragments from necrotic cells. The ‘sub‐G1’ DNA content, measured by flow cytometric analyses at 24 h + 24 h, was significantly higher in cells subjected to combined treatment than in single treatments (P < 0.001 for CDDP 0.25 μm + PDT and P < 0.05 for CDDP 1 μm + PDT versus CDDP alone, respectively). CDDP 5 μm was highly cytotoxic and ‘sub‐G1’ fraction was similar after single and combined treatments.
Figure 7.
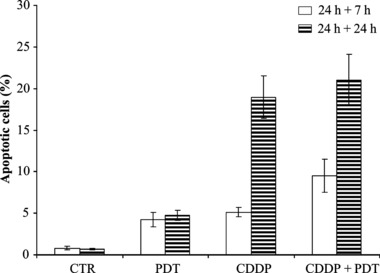
Percentage of apoptotic KYSE‐510 cells after combined treatments compared to PDT alone and CDDP alone (1 μm). Cells were stained with DAPI or Hoechst 33342 dyes 7 h and 24 h after the end of 24 h‐treatments. Values represent the mean ± SE of four independent experiments (P < 0.05, t‐test, combined versus single treatments at 24 h + 7 h).
To evaluate whether apoptosis was triggered by the intrinsic pathway, we measured dissipation of mitochondrial membrane potential using the probe JC‐1 (Fig. 8). Decrease in potential‐sensitive probe JC‐1 accumulation was detected by the fluorescence switch from aggregates of yellow‐orange to monomers in green. At 7 h post‐treatment, we found no significant differences between untreated and treated cells (not shown), whereas at 24 h post‐treatment, CDDP alone or combined with PDT, induced a significant mitochondrial membrane depolarization, whereas PDT alone did not affect accumulation of the probe. Induction of apoptosis via an intrinsic pathway was further analysed by western blotting analyses to assess expression of anti‐apoptotic BCL‐2 protein, BAX, a pro‐apoptotic member of the BCL‐2 family, and of cytochrome c (Fig. 9). BAX was present either in the cytosol or associated with mitochondria, both in untreated and treated cells, without differences between single or combined modalities of treatment. BCL‐2 was present mainly associated with pellets, both in untreated and treated cells, without differences between single and combined treatments. Cytochrome c was present exclusively in mitochondria of untreated control cells and absent in the cytosol. In response to CDDP, alone or combined with PDT, cytochrome c accumulation within the cytosol was detected, but without differences between single and combined modalities.
Figure 8.
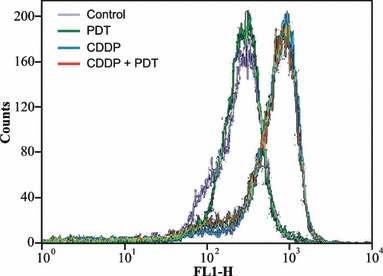
Flow cytometric analyses of green (FL‐1) fluorescence of the potential sensitive probe JC‐1 in KYSE‐510 cells. The increased fluorescence from JC‐1 monomers indicated the dissipation of the mitochondrial membrane potential. Analyses were carried out at 24 h after the end of treatments with PDT alone, CDDP alone (1 μm) and their combination.
Figure 9.
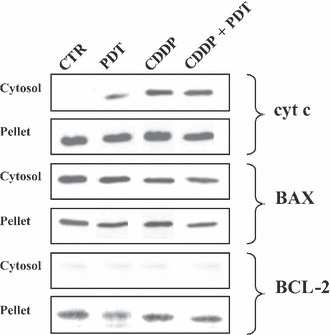
Immunoblotting analyses of cytochrome c, BAX and BCL‐2 proteins in control and treated cells. SDS–PAGE were carried out on cell lysates from subcellular fractions (cytosolic and pellet) of control cells and at 24 h after the end of treatments with PDT alone, CDDP alone (1 μm) and their combination.
Intracellular distribution of BAX, BCL‐2 and cytochrome c was assessed by immunofluorescence analyses carried out at the same time point (24 h + 24 h). Figure 10 shows BCL‐2 having diffuse staining in control and treated cells, reflecting its localization to multiple organelles. BAX translocated from the cytosol to mitochondria after treatment with cisplatin, either alone or combined with PDT treatment. In PDT‐alone treated cells, BAX was detected in the cytosol and associated with mitochondria, whereas in untreated control cells, it was mainly cytosolic. Cytochrome c revealed a punctuate pattern distribution, in agreement with its mitochondrial localization, in untreated cells. In response to CDDP, it had diffuse staining pattern observed in many cells after single or combined treatment. In addition, images of cytochrome c distribution in Figure 10 show that in cells treated with CDDP alone and in combination it was ∼2‐fold higher than in controls.
Figure 10.
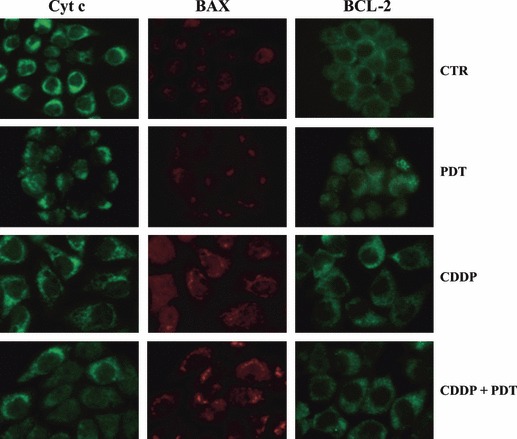
Immunolocalization of cytochrome c, BAX and BCL‐2 proteins in control and treated KYSE‐510 cells. Immunoreaction for cytochrome c, BAX and BCL‐2 in control cells and at 24 h after the end of treatments with PDT alone, CDDP alone (1 μm) and their combination. In response to treatments cyt c is released from mitochondria and can be seen in a diffuse pattern throughout the cell, whereas BAX translocation to mitochondria is evident by punctuate distribution. BCL‐2 show a diffuse staining in control and treated cells, associated with its localization to multiple organelles. Power of magnification 63×. Cells treated with CDDP were about 2‐fold larger than controls.
Discussion
The possibility of combining low doses of a specific chemotherapeutic agent, such as cisplatin, with low doses of PDT, could represent an efficient approach for tumour treatment. Cisplatin alone induces cell death in primary rat neuronal cells and renal cells (27, 28), as well as in tumour cells (15, 29, 30, 31). PDT alone induces nuclear morphological changes typical of apoptosis, which follow the mitochondria‐dependent pathway to apoptosis (32, 33). In murine and human cancer cells, PDT has induced expression and phosphorylation of the inhibitor of apoptosis protein (IAP) survivin, which blocks apoptosis, and is associated with resistance to chemotherapy and radiation (34). To date, few studies on combined effects of PDT with cisplatin have been reported, showing that only certain combinations of PDT and chemotherapy may result in enhanced cytotoxic effects (35). PDT in combination with CDDP significantly prolonged survival of mice bearing leukaemia and lymphoma p53+/+ tumours (15), has enhanced apoptotic cell death in p53+/+ lymphoma cells in vitro (30) and has shown additive/synergistic effects in human p53−/− non‐small cell lung cancer H1299 cells (31).
In the present study, we analysed responses of human p53‐mutated oesophageal carcinoma cells (KYSE‐510) treated with low doses of cisplatin (0–5 μm), given alone or in combination with PDT (2.5 μg/ml of Photofrin and 1.8 J/cm2 of light). Cell viability assays showed dose‐dependent decrease in cell survival after incubation with cisplatin and cytotoxic effects, as assessed by trypan blue exclusion and clonogenic assays, were higher when CDDP was given in combination with PDT. Cisplatin‐treated KYSE‐510 cells arrested cell cycle progression at the G2/M‐ and S‐phase boundary after 24 h incubation with CDDP 0.25, 1 and 5 μm, respectively, and the block persisted 24 h after the end of treatments. Cyclin B1, which is pivotal in regulating G2/M transition, begins to accumulate in S phase and reaches maximal levels in mitosis. In CDDP‐treated KYSE‐510 cells, cyclin B1 increased in concomitance with the cells G2/M arrest, which is in agreement with previous studies (36, 37). Cells subjected to combined treatment showed similar alterations of cell cycle progression and increase in their ‘sub‐G1’ DNA content, indicating more DNA fragmentation. Identification of a ‘sub‐G1’ peak is frequently used to estimate fraction of apoptotic cells (38); nevertheless, our flow cytometry analyses, performed to measure percentage of apoptotic cells, failed. The reason could depend on incomplete DNA fragmentation during apoptosis, which stopped at 50–300 kb fragments and did not proceed to internucleosomal sized fragments (39). Thus, each nuclear fragment was recorded using flow cytometry inciating individual objects characterized by ‘sub‐G1’ DNA content and therefore classified each an individual apoptotic cell. For this reason, the percentage grossly exceeded that of real apoptotic cells present in the sample, as estimated by fluorescence microscopy after staining nuclei. Moreover, extraction of DNA from apoptotic G2, M or S cells may not be adequate to have them at the sub‐G1 peak position, as they may end up as ‘sub‐G2/M’ or ‘sub‐S’ peaks, located on DNA content histograms in place of S‐ and G1‐phase peaks respectively (40). To have a valid measure of apoptotic index, KYSE‐510 cells were scored for chromatin condensation and fragmentation. Results showed that for only a fraction of cells treated with CDDP 1 μm, cell death occurred by apoptosis (25%), whereas for the majority of cells (75%), cell death occurred probably in other ways, in accordance to ‘sub‐G1’ DNA content measured by flow cytometry. Cisplatin may induce cell death by a defective apoptotic programme or by causing necrosis, depending on both cisplatin dose and cell status (41), and in the same population of cisplatin‐treated cells, apoptosis and necrosis could be found (29). Increased cell size observed after CDDP treatment may indicate occurrence of necrosis also in KYSE‐510 cells (Fig. 10). Although evidence of positive interaction between cisplatin and PDT on KYSE‐510 cells, we did not detect additive/synergistic effects on cell mortality after single or combined treatment, in contrast to data from Nonaka et al. (30) and Crescenzi et al. (31). Genetic features of KYSE‐510 cells may account for this lack of correspondence, in part because of loss‐of‐function mutation of p53 tumour suppressor protein. Status of p53 is a critical determinant of cisplatin chemosensitivity, as it plays a key role in G1/S and G2/M cell cycle arrest after DNA damage, through induction of p21WAF1/CIP1 protein, as well as in DNA repair and apoptosis. Studies on the role of p53 in sensitivity of human ovarian cancer cell lines to CDDP treatment, have shown either no association (42) or association (43, 44) between wild‐type p53 expression and platinum sensitivity. Moreover, enhanced platinum sensitivity observed in ovarian cancer cells has been attributed to loss of functional p53 (29). In other cancer cells with no functional p53 (Hep‐2, HPV 18 inactivated ‐ p53; CAL 27 p53 mutated), adenovirally mediated p53 overexpression increased anti‐proliferative effect of cisplatin (37). Cell cycle regulator p21WAF1/CIP1 protein, responsible for G1 arrest, is up‐regulated in non‐small cell lung cancer H1299 cells in a p53‐independent way after CDDP treatment (31), but not in KYSE‐510 cells used in our study (not shown), where G1 phase block was missing. G2/M arrest observed in cisplatin‐treated cells is in accordance with the molecular mechanism of CDDP cytotoxicity and with alterations of cell cycle detected in KYSE‐510 cells treated with flavones and flavonols (45). Furthermore, in KYSE‐510 cells, survivin, which is involved in both control of cell division and inhibition of apoptosis, is overexpressed, as it is in most cancers characterized by high aggressiveness and poor response to chemotherapy (3). Thus, it appears evident (as in cytotoxicity studies) and important to investigate effects of similar antitumoural protocols on different cell types, as different cell responses can be triggered.
Our results show that cisplatin‐treated KYSE‐510 cells underwent apoptosis also in absence of p53 protein, and that the apoptotic process involved the intrinsic pathway, as demonstrated by loss of mitochondrial potential and release of cytochrome c. Our data are in agreement with a recent study on human primary proximal tubular p53‐deficient renal cells treated with cisplatin, reporting ∼30% of apoptotic cells after 24 h incubation with CDDP 30 μm (28). However, the same dose of cisplatin induced more apoptosis in cells harbouring functional p53 gene (28, 46, 47). Thus, loss‐of‐function mutation of p53 tumour suppressor protein can directly be linked to relative low fraction of apoptotic cells after antitumoural treatment, detected in KYSE‐510 cells.
BCL‐2 is an anti‐apoptotic protein localized primarily to cytoplasmic facing membranes, and is most commonly associated with mitochondria, endoplasmic reticulum and nuclear envelope (48). BCL‐2 on outer mitochondrial membranes, is capable of forming heterodimers with pro‐apoptotic family members such as BAX and, thus prevents initiation of apoptosis through blocking formation of mitochondrial transition pores, and release of cytochrome c (49). By western blot analyses BCL‐2 was expressed mainly in the pellet of cell lysates and almost absent in the cytosol, in accordance with its localization on multiple organelles, in control and treated cells. Ratio of BAX/BCL‐2 measured by densitometry analyses was ∼2‐fold and ∼1.3‐fold, respectively, in cytosolic and pellet fractions, without differences between control and treated cell (single or combined treatments) samples (data not shown). Although BAX/BCL‐2 ratio did not increase in the cytosol of KYSE‐510 cells, we observed activation of the intrinsic apoptotic pathway. A possible explanation could be that cytosolic increase in BAX/BCL‐2 ratio becomes evident when a large fraction of cells undergo apoptosis, as in human cervical cancer cells treated with T‐2 toxin, where the ratio increased from 1.62‐ to 2.47‐fold over control, which corresponded to, respectively, ∼7% and ∼45% apoptotic cells (50). Absence of a shift in BAX/BCL‐2 ratio in the cytosol could be related to relatively low fraction of apoptotic KYSE‐510 cells at 24 h after treatment (∼20%).
BAX is a BCL‐2 family protein with pro‐apoptotic activity and its translocation to mitochondria precedes release of cytochrome c (51). BAX is present in the cytosol and weakly associated with mitochondria as a monomer, with an apparent molecular mass of 20 kDa, in control HeLa cells, whereas in cells undergoing apoptosis, BAX translocates to mitochondria forming oligomer complexes of 96 and 260 kDa, integrated into mitochondrial membranes, and its cytosolic concentration decreases (52). In control KYSE‐510 cells, BAX was found both in cytosolic and mitochondrial fractions, whereas after treatments, it translocated to mitochondria, without differences between single and combined treatments. PDT treatment promoted BAX translocation which result is in accordance with those of other authors (19, 32). BAX translocation was evident only by immunolocalization analyses, in which single cells can be observed, but not by western blotting, which is carried out on cell lysates, and only strong differences in protein concentrations can be detected.
Cytochrome c is found in mitochondria of control cells, and by both the immunodetection methods, we were able to assess its release from mitochondria without differences between single and combined treatments. PDT alone induced a slight release of cytochrome c in the cytosol in accordance with the small induction of apoptosis seen.
In conclusion, we have demonstrated that viability of oesophageal carcinoma KYSE‐510 cells was affected when low doses of cisplatin were administered in combination with PDT. Apoptosis occurred in treated cells via an intrinsic pathway although, at the dose selected in our study, it did not represent the principal mode of cell death. By comparing the fraction of cell death by non‐apoptotic pathways, cytotoxic effects of combined treatment with respect to single treatment were more evident, indicating positive interaction between cisplatin and PDT.
Acknowledgements
This study was supported by MIUR (Ministero dell’Istruzione, Università e Ricerca, Rome, program PRIN 2002) and by the University of Padova.
References
- 1. O’Dwyer PJ, Stevenson JP, Johnson SW (2000) Clinical pharmacokinetics and administration of established platinum drugs. Drugs 59, 19–27. [DOI] [PubMed] [Google Scholar]
- 2. Muggia FM, Fojo T (2004) Platinums: extending their therapeutic spectrum. J. Chemother. 16, 77–82. [DOI] [PubMed] [Google Scholar]
- 3. Wang D, Lippard SJ (2005) Cellular processing of platinum anticancer drugs. Nat. Rev. Drug Discov. 4, 307–320. [DOI] [PubMed] [Google Scholar]
- 4. Rabik CA, Dolan ME (2007) Molecular mechanisms of resistance and toxicity associated with platinating agents. Cancer Treat. Rev. 33, 9–23. [DOI] [PMC free article] [PubMed] [Google Scholar]
- 5. Barry MA, Behnke CA, Eastman A (1990) Activation of programmed cell death (apoptosis) by cisplatin, other anticancer drugs, toxins and hyperthermia. Biochem. Pharmacol. 40, 2353–2362. [DOI] [PubMed] [Google Scholar]
- 6. Eastman A (1991) Analysis and quantitation of the DNA damage produced in cells by the cisplatin analog cis‐[3H]dichloro(ethylenediamine)platinum (II). Anal. Biochem. 197, 311–315. [DOI] [PubMed] [Google Scholar]
- 7. Bose RN, Ghosh SK, Moghaddas S (1997) Kinetic analysis of the cis diamminedichloroplatinum(II)‐cysteine reaction: implications to the extent of platinum‐DNA binding. J. Inorg. Biochem. 65, 199–205. [DOI] [PubMed] [Google Scholar]
- 8. Sekiguchi I, Suzuki M, Tamada T, Shinomiya N, Tsuru S, Murata M (1996) Effects of cisplatin on cell cycle kinetics, morphological change, and cleavage pattern of DNA in two human ovarian carcinoma cell lines. Oncology 53, 19–26. [DOI] [PubMed] [Google Scholar]
- 9. Krajcí D, Mares V, Lisá V, Bottone MG, Pellicciari C (2006) Intranuclear microtubules are hallmarks of an unusual form of cell death in cisplatin‐treated C6 glioma cells. Histochem. Cell Biol. 125, 183–191. [DOI] [PubMed] [Google Scholar]
- 10. Crul M, Van Waardenburg RCAM, Beijnen JH, Schellens JHM (2002) DNA‐based drug interactions of cisplatin. Cancer Treat. Rev. 28, 291–303. [DOI] [PubMed] [Google Scholar]
- 11. Fuertes MA, Alonso C, Pérez JM (2003) Biochemical modulation of Cisplatin mechanisms of action: enhancement of antitumor activity and circumvention of drug resistance. Chem. Rev. 103, 645–662. [DOI] [PubMed] [Google Scholar]
- 12. Berek JS, Schink JC, Knox RM (1989) Synergistic effect of combined intraperitoneal cisplatin and cytosinearabinoside in a murine ovarian cancer model. Obstet. Gynecol. 74, 663–666. [PubMed] [Google Scholar]
- 13. Bergman AM, Ruiz van Haperen VW, Veerman G, Kuiper CM, Peters GJ (1996) Synergistic interaction between cisplatin and gemcitabine in vitro. Clin. Cancer Res. 2, 521–530. [PubMed] [Google Scholar]
- 14. Voigt W, Bulankin A, Muller T, Schoeber C, Grothey A, Hoang‐Vu C et al. (2000) Schedule‐dependent antagonism of gemcitabine and cisplatin in human anaplastic thyroid cancer cell lines. Clin. Cancer Res. 6, 2087–2093. [PubMed] [Google Scholar]
- 15. Canti G, Nicolini A, Cubeddu R, Taroni P, Bandieramonte G, Valentini G (1998) Antitumor efficacy of the combination of photodynamic therapy and chemotherapy in murine tumors. Cancer Lett. 125, 39–44. [DOI] [PubMed] [Google Scholar]
- 16. Uehara M, Inokuchi T, Ikeda H (2006) Enhanced susceptibility of mouse squamous cell carcinoma to photodynamic therapy combined with low‐dose administration of cisplatin. J. Oral Maxillofac. Surg. 64, 390–396. [DOI] [PubMed] [Google Scholar]
- 17. Brown SB, Brown EA, Walker I (2004) The present and future role of photodynamic therapy in cancer treatment. Lancet Oncol. 5, 497–508. [DOI] [PubMed] [Google Scholar]
- 18. Palumbo G (2007) Photodynamic therapy and cancer: a brief sightseeing tour. Expert Opin. Drug Deliv. 4, 131–148. [DOI] [PubMed] [Google Scholar]
- 19. Oleinick NL, Morris RL, Belichenko I (2002) The role of apoptosis in response to photodynamic therapy: what, where, why, and how. Photochem. Photobiol. Sci. 1, 1–21. [DOI] [PubMed] [Google Scholar]
- 20. Parkin DM, Pisani P, Ferlay J (1999) Estimates of the worldwide incidence of 25 major cancers in 1990. Int. J. Cancer 80, 827–841. [DOI] [PubMed] [Google Scholar]
- 21. Keeley SB, Pennathur A, Gooding W, Landreneau RJ, Christie NA, Luketich J (2007) Photodynamic therapy with curative intent for Barrett’s esophagus with high grade dysplasia and superficial esophageal cancer. Ann. Surg. Oncol. 14, 2406–2410. [DOI] [PubMed] [Google Scholar]
- 22. Gill KR, Wolfsen HC, Preyer NW, Scott MV, Gross SA, Wallace MB et al. (2009) Pilot study on light dosimetry variables for photodynamic therapy of Barrett’s esophagus with high‐grade dysplasia. Clin. Cancer Res. 15, 1830–1836. [DOI] [PubMed] [Google Scholar]
- 23. Mandard AM, Hainaut P, Hollstein M (2000) Genetic steps in the development of squamous cell carcinoma of the esophagus. Mutat. Res. 462, 335–342. [DOI] [PubMed] [Google Scholar]
- 24. Cossarizza A, Baccarani‐Contri M, Kalashnikova G, Franceschi C (1993) A new method for the cytofluorimetric analysis of mitochondrial membrane potential using the J‐aggregate forming lipophilic cation 5,5′,6,6′‐tetrachloro‐1,1′,3,3′‐tetraethylbenzimidazolcarbocyanine iodide (JC‐1). Biochem. Biophys. Res. Commun. 197, 40–45. [DOI] [PubMed] [Google Scholar]
- 25. Adrain C, Creagh EM, Martin SJ (2001) Apoptosis‐associated release of Smac/DIABLO from mitochondria requires active caspases and is blocked by Bcl‐2. EMBO J. 20, 6627–6636. [DOI] [PMC free article] [PubMed] [Google Scholar]
- 26. Tanaka H, Shibagaki I, Shimada Y, Wagata T, Imamura M, Ishizaki K (1996) Characterization of p53 gene mutations in esophageal squamous cell carcinoma cell lines: increased frequency and different spectrum of mutations from primary tumors. Int. J. Cancer 65, 372–376. [DOI] [PubMed] [Google Scholar]
- 27. Bottone MG, Soldani C, Veneroni P, Avella D, Pisu M, Bernocchi G (2008) Cell proliferation, apoptosis and mitochondrial damage in rat B50 neuronal cells after cisplatin treatment. Cell Prolif. 41, 506–520. [DOI] [PMC free article] [PubMed] [Google Scholar]
- 28. Jiang M, Wang C, Huang S, Yang T, Dong Z (2009) Cisplatin‐induced apoptosis in p53‐deficient renal cells via the intrinsic mitochondrial pathway. Am. J. Physiol. Renal. Physiol. 296, F983–F993. [DOI] [PMC free article] [PubMed] [Google Scholar]
- 29. Pestell KE, Hobbs SM, Titley JC, Kelland LR, Walton MI (2000) Effect of p53 status on sensitivity to platinum complexes in a human ovarian cancer cell line. Mol. Pharmacol. 57, 503–511. [DOI] [PubMed] [Google Scholar]
- 30. Nonaka M, Ikeda H, Inokuchi T (2002) Effect of combined photodynamic therapy and chemotherapeutic treatment on lymphoma cells in vitro . Cancer Lett. 184, 171–178. [DOI] [PubMed] [Google Scholar]
- 31. Crescenzi E, Chiaviello A, Canti G, Reddi E, Veneziani BM, Palumbo G (2006) Low doses of cisplatin or gemcitabine plus Photofrin/photodynamic therapy: disjointed cell cycle phase‐related activity accounts for synergistic outcome in metastatic non‐small cell lung cancer cells (H1299). Mol. Cancer Ther. 5, 776–785. [DOI] [PubMed] [Google Scholar]
- 32. Chiu SM, Xue LY, Azizuddin K, Oleinick NL (2005) Photodynamic therapy‐induced death of HCT 116 cells: apoptosis with or without Bax expression. Apoptosis 10, 1357–1368. [DOI] [PubMed] [Google Scholar]
- 33. Choi H, Lim W, Kim JE, Kim I, Jeong J, Ko Y et al. (2009) Cell death and intracellular distribution of hematoporphyrin in a KB cell line. Photomed. Laser Surg 27, 453–460. [DOI] [PubMed] [Google Scholar]
- 34. Ferrario A, Rucker N, Wong S, Luna M, Gomer CJ (2007) Survivin, a member of the inhibitor of apoptosis family, is induced by photodynamic therapy and is a target for improving treatment response. Cancer Res. 67, 4989–4995. [DOI] [PubMed] [Google Scholar]
- 35. Nahabedian MY, Cohen RA, Contino MF, Terem TM, Wright WH, Berns MW et al. (1988) Combination cytotoxic chemotherapy with cisplatin or doxorubicin and photodynamic therapy in murine tumors. J. Natl. Cancer Inst. 80, 739–743. [DOI] [PubMed] [Google Scholar]
- 36. Dan S, Yamori T (2001) Repression of cyclin B1 expression after treatment with adriamycin, but not cisplatin in human lung cancer A549 cells. Biochem. Biophys. Res. Commun. 280, 861–867. [DOI] [PubMed] [Google Scholar]
- 37. Kraljević Pavelić S, Marjanović M, Poznić M, Kralj M (2009) Adenovirally mediated p53 overexpression diversely influence the cell cycle of HEp‐2 and CAL 27 cell lines upon cisplatin and methotrexate treatment. J. Cancer Res. Clin. Oncol. 37, 1741–1761. [DOI] [PubMed] [Google Scholar]
- 38. Darzynkiewicz Z, Bruno S, Del Bino G, Gorczyca W, Hotz MA, Lassota P et al. (1992) Features of apoptotic cells measured by flow cytometry. Cytometry 13, 795–808. [DOI] [PubMed] [Google Scholar]
- 39. Oberhammer F, Wilson JW, Dive C, Morris ID, Hickman JA, Wakeling AE et al. (1993) Apoptotic death in epithelial cells: cleavage of DNA to 300 and/or 50 kb fragments prior to or in the absence of internucleosomal fragmentation. EMBO J. 12, 3679–3684. [DOI] [PMC free article] [PubMed] [Google Scholar]
- 40. Huang X, Halicka HD, Traganos F, Tanaka T, Kurose A, Darzynkiewicz Z (2005) Cytometric assessment of DNA damage in relation to cell cycle phase and apoptosis. Cell Prolif. 38, 223–243. [DOI] [PMC free article] [PubMed] [Google Scholar]
- 41. Gonzalez VM, Fuertes MA, Alonso C, Perez JM (2001) Is cisplatin‐induced cell death always produced by apoptosis? Mol. Pharmacol. 59, 657–663. [DOI] [PubMed] [Google Scholar]
- 42. De Feudis P, Debernardis D, Beccaglia P, Valenti M, Graniela Siré E, Arzani D et al. (1997) DDP‐induced cytotoxicity is not influenced by p53 in nine human ovarian cancer cell lines with different p53 status. Br. J. Cancer 76, 474–479. [DOI] [PMC free article] [PubMed] [Google Scholar]
- 43. Wu GS, El‐Diery WS (1996) p53 and chemosensitivity. Nat. Med. 2, 255–256. [DOI] [PubMed] [Google Scholar]
- 44. Pestell KE, Medlow CJ, Titley JC, Kelland LR, Walton MI (1998) Characterisation of the p53 status, BCL‐2 expression and radiation and platinum drug sensitivity of a panel of human ovarian cancer cell lines. Int. J. Cancer 77, 913–918. [DOI] [PubMed] [Google Scholar]
- 45. Zhang Q, Zhao XH, Wang ZJ (2009) Cytotoxicity of flavones and flavonols to a human esophageal squamous cell carcinoma cell line (KYSE‐510) by induction of G(2)/M arrest and apoptosis. Toxicol. In Vitro 23, 797–807. [DOI] [PubMed] [Google Scholar]
- 46. Ju JF, Banerjee D, Lenz HJ, Danenberg KD, Schmittgen TC, Spears CP et al. (1998) Restoration of wild‐type p53 activity in p53‐null HL‐60 cells confers multidrug sensitivity. Clin. Cancer Res. 4, 1315–1322. [PubMed] [Google Scholar]
- 47. Park CM, Park MJ, Kwak HJ, Moon SI, Yoo DH, Lee HC et al. (2006) Induction of p53‐mediated apoptosis and recovery of chemosensitivity through p53 transduction in human glioblastoma cells by cisplatin. Int. J. Oncol. 28, 119–125. [PubMed] [Google Scholar]
- 48. Krajewski S, Tanaka S, Takayama S, Schibler MJ, Fenton W, Reed JC (1993) Investigation of the subcellular distribution of the bcl‐2 oncoprotein: residence in the nuclear envelope, endoplasmic reticulum, and outer mitochondrial membranes. Cancer Res. 53, 4701–4714. [PubMed] [Google Scholar]
- 49. Zou H, Li Y, Liu X, Wang X (1999) An APAF‐1 cytochrome c multimeric complex is a functional apoptosome that activates procaspase‐9. J. Biol. Chem. 274, 11549–11556. [DOI] [PubMed] [Google Scholar]
- 50. Chaudhari M, Jayaraj R, Bhaskar ASB, Lakshmana R (2009) Oxidative stress induction by T‐2 toxin causes DNA damage and triggers apoptosis via caspase pathway in human cervical cancer cells. Toxicology 262, 153–161. [DOI] [PubMed] [Google Scholar]
- 51. Sánchez‐Alcázar JA, Ault JG, Khodjakov A, Schneider E (2000) Increased mitochondrial cytochrome c levels and mitochondrial hyperpolarization precede camptothecin‐induced apoptosis in Jurkat cells. Cell Death Differ. 7, 1090–1100. [DOI] [PubMed] [Google Scholar]
- 52. Antonsson B, Montessuit S, Sanchez B, Martinou JC (2001) Bax is present as a high molecular weight oligomer/complex in the mitochondrial membrane of apoptotic cells. J. Biol. Chem. 276, 11615–11623. [DOI] [PubMed] [Google Scholar]


