Abstract
Objective
The aim of this study was to investigate effects of low‐intensity pulsed ultrasound (LIPUS) on differentiation of adipose‐derived stem cells (ASCs), in vitro.
Materials and methods
Murine ASCs were treated with LIPUS for either three or five days, immediately after adipogenic induction, or delayed for 2 days. Expression of adipogenic genes PPAR‐γ1, and APN, was examined by real‐time PCR. Immunofluorescence (IF) staining was performed to test for PPAR‐γ at the protein level.
Results
Our data revealed that specific patterns of LIPUS up‐regulated levels of both PPAR‐γ1 and APN mRNA, and PPAR‐γ protein.
Conclusions
In culture medium containing adipogenic reagents, LIPUS enhanced ASC adipogenesis.
Introduction
Mesenchymal stem cells (MSCs) compose a group of multipotent stem cells derived from adult organs and tissues including from bone marrow, ligaments, muscles, adipose tissue and dental pulp 1, 2, 3. MSCs may undergo self‐renewal over several generations while maintaining capacity to differentiate into multi‐lineage tissues such as bone, cartilage, muscle and fat 4. In previous studies, we have investigated MSCs derived from human adipose tissue as well as from other species, reporting the multi‐lineage potential focusing on adipogenic differentiation 5. Adipose‐derived stem cells (ASCs) can be readily available, being relatively easily isolated from elective surgery to remove excess adipose tissue 6. They can be differentiated into adipocytes using standard cocktail differentiation medium (DM) containing dexamethasone, 3‐isobutyl‐1‐methylxanthine (IBMX), insulin and indomethacin 7. Thus, differentiation of ASCs provides an excellent in vitro model to uncover mechanisms of adipogenic differentiation and insulin sensitivity of mature adipocytes, vital for treatment of obesity, insulin resistance and fat tissue regeneration. Recently, functional studies on adipogenic differentiation have been performed on pre‐adipogenic progenitor cell lines such as 3T3‐L1, but research based on the ASC model would be more beneficial to clinical use, as translation of knowledge from primary cells to clinical practice would be safer than from immortalized cells.
Strength of low‐intensity pulsed ultrasound (LIPUS) is below 100 mW/cm2 and a time interval is incorporated between each two pulses. Relative heat production of LIPUS is weak and it is less invasive than more traditional ultrasound 8. Previous studies have confirmed that LIPUS can effectively promote healing of recent fractures and can be used for treatment of bone discontinuities 9, 10. In 1983, Duarte and Xavier 11 first reported that low‐intensity (30 mW/cm2) pulsed ultrasound could be used successfully as treatment for refractory bone non‐union. In 1994, the FDA approved a commercial LIPUS device designed by Exogen (Smith & Nephew Inc., London, UK) for fracture healing, and a further device to treat bone non‐union was designed in 2000. Recently, studies performed on SAOS‐2 and bone marrow stromal cells (BMSCs) have shown effectiveness of high‐frequency vibration treatment for their differentiation into osteoblasts.
Mechanical stimuli are thought to be important for regulation of tissue development and cell differentiation 12; they have roles in structure and function of cells and are responsible for post‐natal adaptation through pre‐ and post‐transcriptional regulation 13. Additionally, mechanical stimulation can promote osteogenic and adipogenic differentiation of stem cells, a moderate level of mechanical loading being considered essential for physiological bone modelling and remodelling 14. Modulation of bone mass and architecture is mainly performed by osteoblasts 15. A variety of studies has shown that daily mechanical loading can increase β‐catenin signal duration and suppress PPAR‐γ‐induced expression of adiponectin and lipid droplet accumulation, indicating that mechanical stimuli might inhibit adipogenesis; however, up to now no study had been performed to examine effects of LIPUS on ASCs. Much research has been limited to parameter choices available commercially. Many studies have been focused on different variations in intensity 16, 17, 18, 19, 20, 21, 22, 23; however, a system consisting of a 1 MHz sine wave, 30 mW/cm2 spatial‐averaged temporal‐averaged intensity, pulsed for 200 μs with a PRF of 1 kHz, providing a 20% duty cycle, applied for 20 min per day is the most commonly used. Here, we employed different patterns of LIPUS to stimulate mouse ASCs (mASCs) and to investigate expression patterns of adipogenesis‐related genes, in a murine model.
Materials and methods
Isolation and culture of mASCs
Four‐week‐old Kunming mice from the Sichuan University Animal Center 24, 25 were used in this study, in accordance with International Guiding Principles for Animal Research (1985). Inguinal fat pads were dissected from the mice and were washed extensively in sterile PBS to remove tissue debris. Fat pads were then digested using 0.075% type I collagenase (Sigma‐Aldrich, St. Louis, MO, USA) in PBS, for 60 min at 37° C, with agitation. After neutralization of collagenase, cells released from specimens were filtered and collected by centrifugation at 1200 g for 10 min. Resulting pellets were resuspended, washed three times in medium and cells were seeded in plastic flasks in control medium (a‐MEM, 10% FBS) 26. Cultures were maintained in a humidified atmosphere of 5% CO2 at 37° C and resultant mASCs were passaged three times prior to differentiation or measurement.
Adipogenic induction and experimental groups
The third passage of mASCs was seeded into flasks, and on glass coverslips into six‐well plated at an appropriate initial density. Cells were thus cultured in basic medium for 2 days to reach confluence, then basic medium was replaced with adipogenic induction medium containing α‐MEM, 10% FBS, dexamethasone(1 μm), insulin (10 μm), indomethacin (200 μm) and isobutyl‐methylxan‐thine (0.5 mm) (Sigma‐Aldrich).
Potentially enhanced effects of LIPUS on adipogenesis of ASCs, were investigated at two time points, immediately after adipogenic induction or 2 days after induction. These murine ASCs were divided into four experimental groups (Fig. 1). Group 1(2 + 5D), mASCs cultured in adipogenic induction medium for 2 days, before LIPUS being applied for 5 days and mASCs in the control group cultured in adipogenic induction medium for 7 days (Fig. 1a). Group 2(2 + 3D), LIPUS applied for 3 days after 2 days culture of mASCs in adipogenic induction medium and mASCs in the control group cultured in adipogenic induction medium for 5 days (Fig. 1b). Group 3(5D), mASCs treated with LIPUS directly after adipogenic induction for 5 days and mASCs in the control group cultured in adipogenic medium for 5 days (Fig. 1c). Group 4(3D), mASCs treated with LIPUS for 3 days immediately after adipogenic induction and mASCs in the control group cultured in adipogenic induction medium for 3 days (Fig. 1d).
Figure 1.
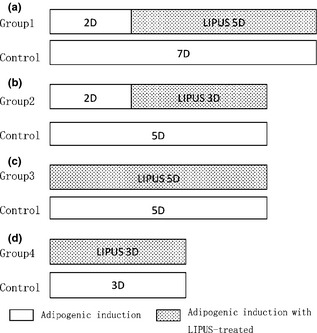
Experimental groups. (a) Group 1: mouse ASCs (mASCs) cultured in adipogenic induction medium for 2 days, before low‐intensity pulsed ultrasound (LIPUS) being applied for 5 days; relevant controls were cultured in adipogenic induction medium for 7 days. (b) Group 2: LIPUS applied for 3 days after 2 days culture of mASCs in adipogenic induction medium; relevant controls cultured in adipogenic induction medium for 5 days. (c) Group 3: mASCs treated with LIPUS directly after adipogenic induction for 5 days; relevant controls cultured in adipogenic medium for 5 days. (d) Group 4: mASCs treated with LIPUS for 3 days immediately after adipogenic induction; relevant controls cultured in adipogenic induction medium for 3 days.
The LIPUS system
Principles of LIPUS are the same as for general ultrasound. However, our LIPUS system has two innovative aspects, designed to fulfil several criteria: first, to precisely control stimulatory waveforms over a relatively wide, adjustable frequency range. Second, to deliver LIPUS to the cells, transducers of the LIPUS system were designed as 3 cm diameter structures (the same as of a single well of standard 6‐well plates), and operated in close proximity beneath the target cells, seeded in wells of the plates.
Extraction of total RNA, RT‐PCR and real‐time PCR
RNA was extracted half an hour after completion of ultrasound stimulation. We assessed transcriptional levels of PPAR‐γ1 and APN by real‐time PCR assay. Initially, total RNA of the cells was extracted using Total Tissue⁄cell RNA Extraction Kit (Watson, Yunnan, China) according to the manufacturer's protocol. Total RNA (11 μl) was reverse‐transcribed into cDNA in a 20 μl reverse transcription system (Fermentas, Vilnius, Lithuania). Total RNA and cDNA of each sample were examined using agarose electrophoresis according to protocols outlined in Molecular Cloning: A Laboratory Manual (2001, 3rd edition). cDNA samples were amplified using an RT‐PCR kit (Tiangen, Peking, China) with primers as displayed in Table 1. Expression of specific genes was then quantified using real‐time PCR and SYBR Premix Ex TaqTM (Perfect Real Time) kit (Takara, Tokyo, Japan); reactions were carried out on the ABI 7300 system (ABI, Foster City, CA, USA). For each reaction, a melting curve was generated to test primer dimmer formation and false priming, then relative quantification of mRNA levels was carried out by means of a double standard curve method. To compare transcription levels of target genes in different quantities of sample, expression of GAPDH was used for normalization of real‐time PCR results.
Table 1.
Primer sequences of target genes and GAPDH for real‐time PCR
| Target gene (mouse) | Primer sequence (5′–3′) |
|---|---|
| PPAR‐γ1 | F: CCAACTTCGGAATCAGCTCTR: CAACCATTGGGTCAGCTCTT |
| Adiponectin | F: GCAGAGATGCACTCCTGGAR: CCCTTCAGCTCCTGTCATTCC |
| GAPDH | F: TATGACTCTACCCACGGCAAGTR: ATACTCAGCACCAGCATCACC |
Immunofluorescence staining of de‐PPAR‐γ and ph‐PPAR‐γ
Mouse ASCs cultured in adipogenic medium were plated on glass coverslips in six‐well plates 24 h before use of LIPUS. Cells of experimental and control groups were then washed briefly in PBS, fixed in cold acetone for 30 min at room temperature and blocked in 0.5% bovine serum albumin for 15 min. Coverslips were subsequently incubated overnight at 4° Cwith rabbit polyclonal antibody against.
PPAR‐γ (1:100) (AbCam, Cambridge, UK) or rabbit monoclonal antibody against PPAR‐γ with phosphoserine at residue 82 (1:100) (Upstate, Lake Placid, NY, USA). Sequentially, slides were incubated in secondary antibodies conjugated to rhodamine (Pierce) for 1 h at room temperature, and nuclei were stained with DAPI (Molecular Probes, Eugene, OR, USA) for 10 min. After rinsing in PBS, cells were observed and photomicrographs were taken using an Olympus IX 710 microscope (Olympus, Tokyo, Japan). Images were analysed using Image‐Pro Plus 6.0.0.260 (Media Cybernetics, Rockville, MD, USA) and integral optical density (IOD) was measured to evaluate PPAR‐γ.
Statistical analysis
We performed three or more independent sets of experiments, and each experiment was run at least three times. Quantified data are expressed as mean values ± SD and ANOVA was used to analyse differences within groups in all assays. To specify significant difference between experimental groups and controls, the Dunnett t‐test was conducted. To determine effectiveness of different durations of action, data were also analysed using LSD t‐testing. P values <0.05 were considered to be statistically significant.
Results
LIPUS promoted PPAR‐γ1 and APN transcription after adipogenic induction
In all groups, PPAR‐γ1 and APN mRNAs were detected by real‐time PCR. mRNA level of PPAR‐γ1 increased to 63.22 ± 8.96 of its previous value (Group 1), 15.07 ± 3.44 (Group 2), 3.27 ± 0.51 (Group 3) and 2.85 ± 0.08 (Group 4), with significant differences from control groups, respectively, P values were 0.0102 (Group 1), 0.0286 (Group 2), 0.0244 (Group 3) and 0.0010 (Group 4), respectively (P < 0.05, Dunnett t‐test). Data of real‐time PCR indicated that mRNA level of PPAR‐γ1 Group 1 was significantly higher than of other groups, with P values being 0.0030, 0.0030, 0.0030, respectively (P < 0.05, by LSD t‐test); there was no statistically significant difference between data of Groups 2–4 (Fig. 2a). mRNA level of APN increased to 126.85 ± 37.37 of its previous value (Group 1), 6.46 ± 1.57 (Group 2), 7.05 ± 0.96 (Group 3) and 7.19 ± 1.71 (Group 4), with significant differences from control groups, respectively. P values were 0.0414 (Group 1), 0.0388 (Group 2), 0.0125 (Group 3) and 0.0361 (Group 4), respectively (P < 0.05, Dunnett t‐test). This indiates that mRNA level of APN on 2 + 5 days was significantly higher than that on 3 days, 5 days, 2 + 3 days and that of control groups. P values were <0.0001, <0.0001 and 0.0010 respectively (P < 0.05, by LSD t‐test); mRNA levels of APN on days 3.2 + 3, 5 were similar to each other (Fig. 2b). PCR products were then run on argarose gel to test specificity of primers (Fig. 2c).
Figure 2.
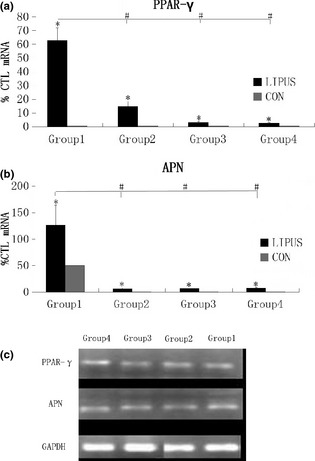
Low‐intensity pulsed ultrasound ( LIPUS ) promoted PPAR‐γ1 and APN transcription after adipogenic induction. (a) In all groups, PPAR‐γ1 mRNA was detected by real‐time PCR. Data obtained indicated that mRNA level of PPAR‐γ1 Group 1 was significantly higher than that of other groups, and there was no statistically significant differences between data of Groups 2–4. (b) In all groups, APN mRNA was detected by real‐time PCR. Data obtained indicated that mRNA level of APN group 1 was significantly higher than that of the other groups, and there was no statistically significant difference between data of Groups 2–4. P values <0.05 were considered statistically significant, as indicated by * (Dunnett t‐test) and # (LSD t‐test), * for comparison between different groups on the same day, and # for comparison between different groups 2 + 5D, 2 + 3D, 5D and 3D. (c) RT‐PCR showed expression of PPAR‐γ1 and APN.
LIPUS promoted expression of de‐PPAR‐γ and ph‐PPAR‐γ with adipogenic induction
PPAR‐γ is commonly activated by dephosphorylation in the cytoplasm. Dephosphorylated PPAR‐γ moves into nuclei and functions as in intranuclear transcriptional factor. After 3 days (Group 4), 2 + 3 days (Group 2), 5 days (Group 3) and 2 + 5 days (Group 1) differentiation, IF was performed using anti‐de‐PPAR‐γ (Fig. 3) and anti‐ph‐PPAR‐γ (Fig. 4) antibodies, respectively. Expression of de‐PPAR‐γ and ph‐PPAR‐γ on day 3 (Group 4), 2 + 3 (Group 2), 5 (Group 3) and 2 + 5 (Group 1) were higher when compared to control groups, respectively, and de‐PPAR‐γ (Fig. 5) was expressed significantly more highly in LIPUS‐treated groups compared to control groups: in Group 1, de‐PPAR‐γ expression (7.16 ± 0.30%) was higher than controls (3.07 ± 0.15%); in Group 2, de‐PPAR‐γ expression (16.25 ± 0.21%) was higher than in controls (2.03 ± 0.11%); in Group 3, de‐PPAR‐γ expression (11.73 ± 0.20%) was higher than in controls (3.01 ± 0.06%) and in Group 4, de‐PPAR‐γ expression (2.50 ± 0.04%) was higher than in controls (1.97 ± 0.013%); P values were 0.0033, 0.0001, 0.0003 and 0.0032, respectively (P < 0.05, by Dunnett t‐test). ph‐PPAR‐γ (Fig. 6) was also found to be higher in LIPUS‐treated compared to control cells: in Group 1 ph‐PPAR‐γ expression (9.56 ± 0.34%) was higher than in controls (3.02 ± 0.06%); in Group 2 ph‐PPAR‐γ expression (3.73 ± 0.23%) was higher than in controls (2.19 ± 0.32%); in Group 3 ph‐PPAR‐γ expression (8.22 ± 0.57%) was higher than in controls (1.82 ± 0.16%) and in Group 4 ph‐PPAR‐γ expression (2.36 ± 0.21%) was higher than in controls (1.21 ± 0.08%); P values were 0.0014, 0.0312, 0.0042 and 0.0181, respectively (P < 0.05, by Dunnett t‐test).
Figure 3.
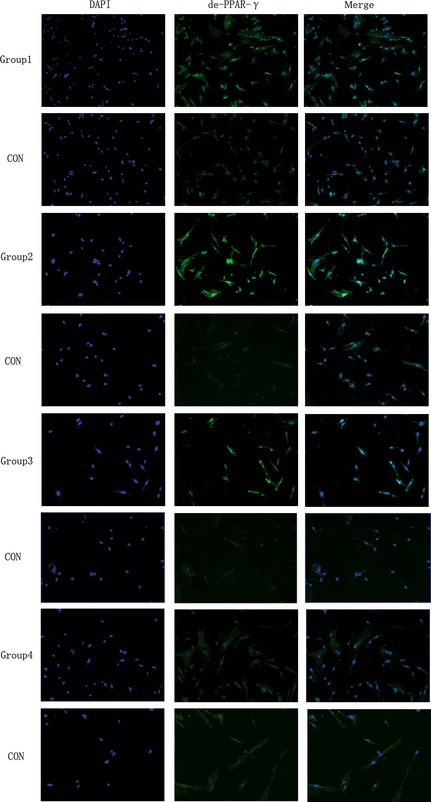
Low‐intensity pulsed ultrasound ( LIPUS ) promoted de‐PPAR‐γ protein expression. After 2 + 5 days (Group 1), 2 + 3 days (Group 2), 5 days (Group 3), 3 days (Group 4) of adipogenic induction. Immunofluorescence staining was performed using anti‐de‐PPAR‐γ (green). Cell nuclei were counterstained with 4, 6‐diamidino‐2‐phenylindole (blue). (Magnification ×100).
Figure 4.
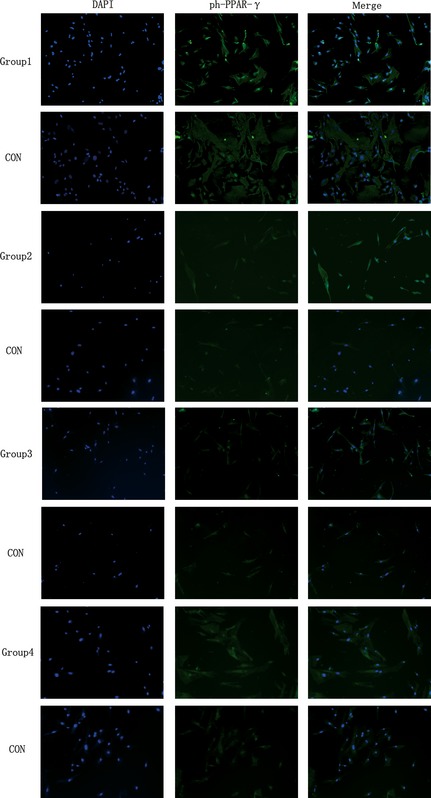
Low‐intensity pulsed ultrasound ( LIPUS ) promoted ph‐PPAR‐γ protein expression. After 2 + 5 days (Group 1), 2 + 3 days (Group 2), 5 days (Group 3), 3 days (Group 4) of adipogenic induction. Immunofluorescence staining was performed using anti‐ph‐PPAR‐γ (green). Cell nuclei were counterstained with 4, 6‐diamidino‐2‐phenylindole (blue). (Magnification ×100).
Figure 5.
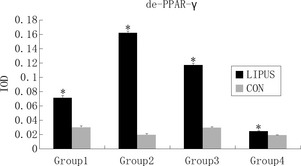
Integral optical density ( IOD ) was measured to evaluate de‐PPAR‐γ concentration; de‐PPAR‐γ was condensed in nuclei, with significantly higher IOD in low‐intensity pulsed ultrasound (LIPUS)‐treated groups than in controls. P values <0.05 were considered as statistically significant, as indicated by *.
Figure 6.
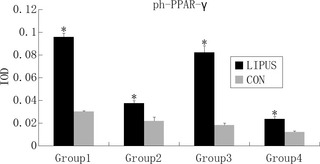
Integral optical density ( IOD ) was measured to evaluate ph‐PPAR‐γ concentration; ph‐PPAR‐γ was condensed in cytoplasm, with significantly higher IOD in low‐intensity pulsed ultrasound (LIPUS)‐treated groups than in the controls. P values <0.05 were considered statistically significant, as indicated by *.
Discussion
In this study, we assessed transcription levels of PPAR‐γ1 27 and APN in mASCs, by real‐time PCR assay. Adiponectin is a protein hormone that modulates a number of metabolic processes, including glucose regulation and fatty acid catabolism 28. It is mainly secreted into blood from adipose tissue, as well as from the placenta during pregnancy 29; it is more abundant in plasma relative to many other hormones. PPAR‐γ is the most important regulator of transcriptional control of adipogenesis 30, 31, 32. When activated by its ligands, PPAR‐γ alone can drive adipogenic differentiation and lipid deposition. It has been reported that expression of PPAR‐γ is initiated in early adipogenesis, and increases during the process of adipogenesis.
Here we used a 1 MHz sine wave, 100 mW/cm2 spatial‐averaged temporal‐averaged intensity pulsed for 200 μs with PRF of 1 kHz, providing a 20% duty cycle and applied for 3 min per day. Our data indicated that mRNA levels of PPAR‐γ1 and APN, as well as protein levels of phospho‐PPAR and de‐phospho‐PPAR, could be increased by LIPUS in 3D, 5D, 2 + 3D and 2 + 5D loading patterns. We found that it didn't matter whether LIPUS was loaded on to the mASCs five days, three days or immediately after adipogenic induction, adipogenesis of the ASCs was enhanced.
Cell manipulation techniques are important in many areas of cell biology, molecular genetics, biotechnological production, clinical diagnostics and therapeutics. Physical methods of manipulating suspended cells at single‐particle microscopic resolution include by hydrodynamic 33, optical 34, dielectrophoretic 35, magnetic 36 and ultrasonic 37, 38, 39 cell trapping. Of the above mentioned methods, ultrasound trapping has up to now been less extensively exploited. Compared to other methods, ultrasound cell manipulation is an inexpensive and non‐contact technique that allows simultaneous and synchronous manipulation of large numbers of cells over a very short time period. To a certain extent, LIPUS is similar to mechanical stimuli, as they both apply external force to cells and there are many recent articles reporting that mechanical stress on ASCs at certain times can restrain the adipogenic potential. Mechanical strain applied for 6 h daily inhibits expression of PPAR and adiponectin mRNA by up to 35% and 50% 40. Hossain's data have suggested that SGBS, a human pre‐adipocyte cell line, was inhibited from adipogenesis when subjected to compressive force of 226 Pa for 12 h before adipogenic induction 41. Yet so far, previous studies have pointed out that mechanical stimuli inhibit adipogenic differentiation of ASCs. Our data, however, have lead to different conclusions due to three reasons: first, immortalized cell lines were used in most of the previous studies, but we used mouse ASCs. Secondly, characteristics of mechanical forces used were different from LIPUS; mechanical forces in the above‐mentioned studies were uniform strain, while in ours studies, we used a mechanical waves and lastly, times of mechanical loading were different – we used briefer time periods than the others.
In conclusion, we have demonstrated that LIPUS induced enhanced adipogenesis of ASCs, by increasing expression of adipogenic genes.
Conflict of interest
The authors have declared that no competing interests exist.
Acknowledgements
This work was funded by National Natural Science Foundation of China (81071273, 31170929, 81201211, 81200810), Foundation for the Authors of National Excellence Doctoral Dissertations of China (FANEDD 200977) and Funding for Distinguished Young Scientists in Sichuan (2010 JQ0010).
References
- 1. Vats A, Tolley N, Polak J, Buttery L (2002) Stem cells: sources and applications. Clin. Otolaryngol. Allied Sci. 27, 227–232. [DOI] [PubMed] [Google Scholar]
- 2. Turksen K (2004) Revisiting the bulge. Dev. Cell 6, 454–456. [DOI] [PubMed] [Google Scholar]
- 3. Grottkau BE, Purudappa PP, Lin YF (2010) Multilineage differentiation of dental pulp stem cells from green fluorescent protein transgenic mice. Int. J. Oral Sci. 2, 21–27. [DOI] [PMC free article] [PubMed] [Google Scholar]
- 4. Le Blanc K, Pittenger M (2005) Mesenchymal stem cells: progress toward promise. Cytotherapy 7, 36–45. [DOI] [PubMed] [Google Scholar]
- 5. Lin Y, Yan Z, Liu L, Qiao J, Jing W, Wu L et al (2006) Proliferation and pluripotency potential of ectomesenchymal cells derived from first branchial arch. Cell Prolif. 39, 79–92. [DOI] [PMC free article] [PubMed] [Google Scholar]
- 6. Mizuno H (2009) Adipose‐derived stem cells for tissue repair and regeneration: ten years of research and a literature review. J. Nippon Med. Sch. 76, 56–66. [DOI] [PubMed] [Google Scholar]
- 7. Jing W, Lin Y, Wu L, Li X, Nie X, Liu L et al (2007) Ectopic adipogenesis of preconditioned adipose‐derived stromal cells in an alginate system. Cell Tissue Res. 330, 567–572. [DOI] [PubMed] [Google Scholar]
- 8. Heckman JD, McCabe J, Rni JJ (1994) Acceleration of tibial fracture‐healing by non‐invasive, low‐intensity pulsed ultrasound. J. Bone Joint Surg. Am. 76, 26–34. [DOI] [PubMed] [Google Scholar]
- 9. Mayr E, Rudzki M, Rudzki M, Borchardt B, Hausser H, Ruter A (2000) Does low intensity, pulsed ultrasound speed healing of scaphoid fractures? Handchir. Mikrochir. Plast. Chir. 32, 115–122. [DOI] [PubMed] [Google Scholar]
- 10. Nolte PA, van der Krans A, Patka P, Janssen I, Ryaby JP, Albers G (2001) Low‐intensity pulsed ultrasound in the treatment of nonunions. J. Trauma 51, 693–703. [DOI] [PubMed] [Google Scholar]
- 11. Duarte L, Xavier C (1983) Estimulação ultra‐sônica do calo ósseo. Rev. Bras. Ortop. 18, 73–80. [Google Scholar]
- 12. Tomasek JJ, Gabbiani G, Hinz B, Chaponnier C, Brown RA (2002) Myofibroblasts and mechano‐regulation of connective tissue remodelling. Nat. Rev. Mol. Cell Biol. 3, 349–363. [DOI] [PubMed] [Google Scholar]
- 13. Powell CA, Smiley BL, Mills J, Vandenburgh HH (2002) Mechanical stimulation improves tissue‐engineered human skeletal muscle. Am. J. Physiol. Cell Physiol. 283, C1557–C1565. [DOI] [PubMed] [Google Scholar]
- 14. Frost HM (2004) A 2003 update of bone physiology and Wolff's Law for clinicians. Angle Orthod. 74, 3–15. [DOI] [PubMed] [Google Scholar]
- 15. Lundberg P, Lie A, Bjurholm A, Lehenkari P, Horton M, Lerner U et al (2000) Vasoactive intestinal peptide regulates osteoclast activity via specific binding sites on both osteoclasts and osteoblasts. Bone 27, 803–810. [DOI] [PubMed] [Google Scholar]
- 16. Harle J, Salih V, Knowles J, Mayia F, Olsen I (2001) Effects of therapeutic ultrasound on osteoblast gene expression. J. Mater.Sci. Mater. Med. 12, 1001–1004. [DOI] [PubMed] [Google Scholar]
- 17. Iwashina T, Mochida J, Miyazaki T, Watanabe T, Iwabuchi S, Ando K et al (2006) Low‐intensity pulsed ultrasound stimulates cell proliferation and proteoglycan production in rabbit intervertebral disc cells cultured in alginate. Biomaterials 27, 354. [DOI] [PubMed] [Google Scholar]
- 18. Kobayashi Y, Sakai D, Iwashina T, Iwabuchi S, Mochida J (2009) Low‐intensity pulsed ultrasound stimulates cell proliferation, proteoglycan synthesis and expression of growth factor‐related genes in human nucleus pulposus cell line. Eur. Cell Mater. 17, 15–22. [PubMed] [Google Scholar]
- 19. Lavandier B, Gleizal A, Béra JC (2009) Experimental assessment of calvarial bone defect re‐ossification stimulation using low‐intensity pulsed ultrasound. Ultrasound Med. Biol. 35, 585–594. [DOI] [PubMed] [Google Scholar]
- 20. Li JGR, Chang WHS, Lin JCA, Sun JS (2002) Optimum intensities of ultrasound for PGE2 secretion and growth of osteoblasts. Ultrasound Med. Biol. 28, 683–690. [DOI] [PubMed] [Google Scholar]
- 21. Reher P, Harris M, Whiteman M, Hai H, Meghji S (2002) Ultrasound stimulates nitric oxide and prostaglandin E2 production by human osteoblasts. Bone 31, 236–241. [DOI] [PubMed] [Google Scholar]
- 22. Saito M, Soshi S, Tanaka T, Fujii K (2004) Intensity‐related differences in collagen post‐translational modification in MC3T3‐E1 osteoblasts after exposure to low‐and high‐intensity pulsed ultrasound. Bone 35, 644–655. [DOI] [PubMed] [Google Scholar]
- 23. Tien YC, Lin SD, Chen CH, Lu CC, Su SJ, Chih TT (2008) Effects of pulsed low‐intensity ultrasound on human child chondrocytes. Ultrasound Med. Biol. 34, 1174–1181. [DOI] [PubMed] [Google Scholar]
- 24. Li J, Hu S, Zhang C, Yang H, Ni C (2008) Impact of chronic restraint stress on splenocyte immunity and growth of mouse forestomach carcinoma xenografts in Kunming mice. Ai Zheng 27, 471–475. [PubMed] [Google Scholar]
- 25. Wang Q, An ZX, Gu L, Ma LB, Zheng YM, Zhang Y (2004) Demecolcine‐induced enucleation of Kunming mouse oocyte. Yi Chuan 26, 653–657. [PubMed] [Google Scholar]
- 26. Lin Y, Jing W, Wu L, Li X, Wu Y, Liu L et al (2008) Identification of osteo–adipo progenitor cells in fat tissue. Cell Prolif. 41, 803–812. [DOI] [PMC free article] [PubMed] [Google Scholar]
- 27. Nickoloff B, Qin J, Chaturvedi V, Denning M, Bonish B, Miele L (2002) Jagged‐1 mediated activation of notch signaling induces complete maturation of human keratinocytes through NF‐kappa B and PPAR gamma. Cell Death Differ. 9, 842. [DOI] [PubMed] [Google Scholar]
- 28. Diez JJ, Iglesias P (2003) The role of the novel adipocyte‐derived hormone adiponectin in human disease. Eur. J. Endocrinol. 148, 293–300. [DOI] [PubMed] [Google Scholar]
- 29. Chen J, Tan B, Karteris E, Zervou S, Digby J, Hillhouse E et al (2006) Secretion of adiponectin by human placenta: differential modulation of adiponectin and its receptors by cytokines. Diabetologia 49, 1292–1302. [DOI] [PubMed] [Google Scholar]
- 30. Moerman EJ, Teng K, Lipschitz DA, Lecka‐Czernik B (2004) Aging activates adipogenic and suppresses osteogenic programs in mesenchymal marrow stroma/stem cells: the role of PPAR‐γ2 transcription factor and TGF‐β/BMP signaling pathways. Aging Cell 3, 379–389. [DOI] [PMC free article] [PubMed] [Google Scholar]
- 31. Fink T, Abildtrup L, Fogd K, Abdallah BM, Kassem M, Ebbesen P et al (2004) Induction of adipocyte‐like phenotype in human mesenchymal stem cells by hypoxia. Stem Cells 22, 1346–1355. [DOI] [PubMed] [Google Scholar]
- 32. Schadinger SE, Bucher NLR, Schreiber BM, Farmer SR (2005) PPARγ2 regulates lipogenesis and lipid accumulation in steatotic hepatocytes. Am. J. Physiol. Endocrinol. Metab. 288, E1195–E1205. [DOI] [PubMed] [Google Scholar]
- 33. Lin CM, Lai YS, Liu HP, Chen CY, Wo AM (2008) Trapping of bioparticles via microvortices in a microfluidic device for bioassay applications. Anal. Chem. 80, 8937–8945. [DOI] [PubMed] [Google Scholar]
- 34. Mohanty SK, Mohanty KS, Berns MW. (2008). Manipulation of mammalian cells using a single‐fiber optical microbeam. J. Biomed. Opt. 13, 054049. [DOI] [PMC free article] [PubMed] [Google Scholar]
- 35. Jang LS, Huang PH, Lan KC (2009) Single‐cell trapping utilizing negative dielectrophoretic quadrupole and microwell electrodes. Biosens. Bioelectron. 24, 3637–3644. [DOI] [PubMed] [Google Scholar]
- 36. Koschwanez JH, Carlson RH, Meldrum DR (2007). Easily fabricated magnetic traps for single‐cell applications. Rev. Sci. Instrum. 78, 044301‐5. [DOI] [PubMed] [Google Scholar]
- 37. Bazou D, Kuznetsova LA, Coakley WT (2005) Physical environment of 2‐D animal cell aggregates formed in a short pathlength ultrasound standing wave trap. Ultrasound Med. Biol. 31, 423–430. [DOI] [PubMed] [Google Scholar]
- 38. Evander M, Johansson L, Lilliehorn T, Piskur J, Lindvall M, Johansson S et al (2007) Noninvasive acoustic cell trapping in a microfluidic perfusion system for online bioassays. Anal. Chem. 79, 2984–2991. [DOI] [PubMed] [Google Scholar]
- 39. Oberti S, Neild A, Dual J (2007) Manipulation of micrometer sized particles within a micromachined fluidic device to form two‐dimensional patterns using ultrasound. J. Acoust. Soc. Am. 121, 778–785. [DOI] [PubMed] [Google Scholar]
- 40. Sen B, Xie Z, Case N, Ma M, Rubin C, Rubin J (2008) Mechanical strain inhibits adipogenesis in mesenchymal stem cells by stimulating a durable β‐catenin signal. Endocrinology 149, 6065–6075. [DOI] [PMC free article] [PubMed] [Google Scholar]
- 41. Hossain MG, Iwata T, Mizusawa N, Shima SWN, Okutsu T, Ishimoto K et al (2010) Compressive force inhibits adipogenesis through COX‐2‐mediated down‐regulation of PPARγ2 and C/EBPα. J. Biosci. Bioeng. 109, 297–303. [DOI] [PubMed] [Google Scholar]


