

Abstract
Abstract. The oral mucosa is a rapidly replacing body tissue that has received relatively little attention in terms of defining its cell kinetics and cellular organization. The tissue is sensitive to the effects of cytotoxic agents, the consequence of which can be stem cell death with the subsequent development of ulcers and the symptoms of oral mucositis. There is considerable interest in designing strategies to protect oral stem cells and, hence, reduce the mucositis side‐effects in cancer therapy patients. Here we present details of a new histometric approach designed to investigate the changing patterns in cellularity in the ventral tongue mucosa. This initial paper in a series of four papers presents observations on the changing patterns in the labelling index following tritiated thymidine administration, which suggest a delayed uptake of tritiated thymidine from a long‐term intracellular thymidine pool, a phenomenon that will complicate cell kinetic interpretations in a variety of experimental situations. We also provide data on the changing pattern of mitotic activity through a 24‐h period (circadian rhythms). Using vincristine‐induced stathmokinesis, the data indicate that 54% of the basal cells divide each day and that there is a high degree of synchrony in mitotic activity with a mitotic peak occurring around 13.00 h. The mitotic circadian peak occurs 9‐12 h after the circadian peak in DNA synthesis. The data presented here and in the subsequent papers could be interpreted to indicate that basal cells of BDF1 mice have an average turnover time of about 26‐44 h with some cells cycling once a day and others with a 2‐ or 3‐day cell cycle time.
Keywords: cell kinetics, circadian rhythms, histometry, mouse tongue, thymidine metabolism
Introduction
The oral mucosa is an epithelial site currently receiving a revival of research interest, primarily because of the major clinical problem of oral mucositis in cancer therapy patients. The tissues lining the inner surface of the mouth represent a major sensory organ of the body with many differing sensory nerve endings, glandular tissues and epithelial cells, which are being constantly replaced and are thus sensitive to the cytotoxic effects of drugs and radiation. Damage to the epithelial stem cells in the mucosa results in an amplified loss of epithelial cells within the stratified keratinizing epithelium. If severe enough, this can result in a substantial interruption of cell production. However, because cell loss continues unabated, this interruption causes a thinning of the mucosa and ultimately leads to ulceration. Such oral mucositis is associated with severe pain and distress in cancer patients, resulting in difficulties in swallowing, eating and talking, and making the patient susceptible to infection due to breaching of the epithelial barrier. The damage commonly limits the dose regimens that can be administered and, hence, reduces the effectiveness of the cancer treatment. Considerable clinical and commercial interests are currently directed towards ways of reducing the sensitivity of the crucial oral stem cells to cytotoxic treatments, while not simultaneously affecting the sensitivity of any primary or metastatic cancer cells. Treatment strategies include rendering the normal oral mucosae stem cells less sensitive by a protective pretreatment, or alternatively facilitating the tissue regeneration process that originates from surviving stem cells. Ultimately a combination of both approaches should be most effective. Such treatments that reduce the effects of oral and gastrointestinal mucositis will improve the quality of life of cancer patients and possibly allow dose escalation and hence improvement in cure rates.
In order to design effectively clinically relevant experimental models to test the principles involved in such approaches, more detailed information is required concerning the basic cell kinetics of the oral mucosa. Here we present the first of a series of papers on oral cell replacement, mucositis development and prevention strategies using a mouse model. The cell kinetics of oral tissues has been sporadically studied for the last 40 years or more. These studies include basic cell kinetic information in hamster cheek pouch epithelium (Brown & Berry 1968), through to detailed histometric studies on the dorsal epithelium of the tongue (Hume & Potten 1976) and more recent studies on cell kinetics in the ventral epithelium of the tongue (Dörr & Kummermehr 1991; Wardley et al. 1998).
A fairly widely used but subjective oral mucositis model in hamster cheek pouch epithelium has been developed (Sonis et al. 1990). Similar mucositis models in the mouse ventral tongue using cellularity changes are also used (Dörr & Kummermehr 1991; Dörr et al. 1994a). A more detailed histometric method, measuring thickness and changes in cellularity in various oral mucosae including tongue and buccal mucosa of the mouse provides a very sensitive method of analysis (Wardley et al. 1998).
Cell kinetic studies in the oral mucosae must examine circadian rhythm. Cell production in rodent oral mucosa experience strong circadian rhythms that are reflected in the variation of the number of cells in the S phase of the cell cycle or in mitosis at different times of the day. (Brown & Berry 1968; Hume & Potten 1976; Wardley et al. 1998). For reasons that are not clear, oral mucosae demonstrate one of the strongest circadian rhythms in cell proliferation seen in any tissue, with the amplitude such that at certain times of day, essentially no cells express proliferation markers, while at other times of day almost 75% of the cells may be in S phase. Based on detailed cell positional studies (Hume & Potten 1976) it was suggested that the circadian rhythm amplitude is greatest in the positions in the dorsal tongue epithelium associated with stem cells and that these cells may be almost completely synchronous and drive the overall circadian rhythm (Potten et al. 1977; see also Appleton et al. 2002).
Measurement of the S phase fraction is commonly achieved using DNA synthesis precursors such as tritiated thymidine (3HTdR). After administration to an animal by an intraperitoneal (ip) or intravenous (iv) injection, the molecule is distributed around the body via the vascular system within a few minutes. There is then a competitive race between incorporation of the molecule into the cells in various tissue that are synthesizing DNA, and catabolism each time the material passes through the liver. The consequence of these processes is that the circulating available thymidine is reduced to background levels within about 20‐30 min of injection. As a result, in vivo injections effectively constitute a pulse‐labelling protocol and because of the catabolism there is no need for chasing the pulse with cold thymidine as is common with cell cultures.
One complication is that the 3HTdR enters an intracellular pool of thymidine present within each cell. This is normally replenished via an effective reutilization or salvage pathway that recycles the thymidine released by DNA degradation in terminally differentiated cells. However, some stratified keratinizing epithelia demonstrate a delayed incorporation of tritiated thymidine from these intracellular pools (Potten 1971, 1973; Potten & Schaer 1971). It appears that in the skin and particularly the hair follicles, tritiated thymidine enters the intracellular pool of non‐S phase cells and is held within the pool (does not diffuse back out into the circulation) until those cells enter DNA synthesis (Potten & Croxson 1971). This delayed incorporation can be observed for up to 24 h after thymidine injection in the epidermis, and up to a week in cells in the resting hair follicle. Such pool effects can therefore complicate experiments thought to be generated by a ‘pulse’ of thymidine and can lead to incorrect cell kinetic interpretations.
Here we demonstrate that the epithelial cells in the ventral tongue exhibit a similar delayed incorporation of tritiated thymidine, and we provide further more detailed information on the circadian rhythm in this epithelium.
Materials and methods
Animals
Adult male BDF1 mice aged between 10 and 12 weeks and housed under conventional conditions were used for these experiments. The animals received food and water ad libitum and were housed in rooms with carefully controlled light cycles. Most animals were housed in rooms with the light cycle switched on between 07.00 and 19.00 GMT. Experimental groups consisted of 4‐6 animals and many groups were subsequently repeated so that larger pooled groups of animals could be obtained. For the circadian rhythm experiments some animals were housed in a room with a reversed light cycle for an acclimatization period of 2 weeks prior to experimental use (lights on at 19.00 h and off at 07.00 h). Previous studies and the presence of overlapping time groups in the normal and reversed light cycle rooms confirmed that the 2 weeks’ acclimatization was sufficient to reverse the circadian rhythm. All animal experiments were performed under the regulations of the UK Home Office Animal Scientific Procedures Act 1986.
Labelling
Methyl tritiated thymidine of a specific activity 222GBq/mM (obtained from NEN Life Sciences, Hounslow, United Kingdom) was injected intraperitoneally at a dose of 25 µCi (0.925MBq) or 50 µCi (1.85MBq) dissolved in 0.1 or 0.2 mL saline, respectively. For ‘pulse labelling’ experiments (circadian rhythm studies), 3HTdR was administered to a group of animals every 3 h for 24 h, and groups of animals were culled 40 min after each 3HTdR administration. For the thymidine uptake study, 3HTdR was injected as above, and animals were culled and samples taken between 40 min and 24 h after the single 3HTdR injection in the initial experiment. The sampling times were subsequently extended up to 4 days in later experiments.
Histology and scoring
When the animals were culled, the tongue was excised, cut longitudinally dorso‐ventrally, and the two halves fixed in Carnoy's fixative for 30 min, followed by storage in 70% ethanol. The tissue was then processed for histology with 3‐5‐µm sections cut through the long axis of the tongue down the bisected cut face. Some sections were processed for routine haematoxylin and eosin staining and others de‐waxed, hydrated and dipped in autoradiographic emulsion (Ilford K5 emulsion Ilford, Mobberley, UK) for autoradiography. Autoradiographic exposure times were usually 14 days. Following exposure, development and fixation, the autoradiographs were stained with haematoxylin and eosin. The slides were then analysed using the computer assisted Zeiss AxiohomeTM microscope system. This system operates by superimposing the computer screen onto the microscope image, which then allows the user to mark (in real time) around an area of interest by small movements of the computer mouse. The area in question is then simultaneously displayed on both the computer screen and down the microscope eyepiece. This system allows the sample area to be recorded and various measurements of the tissue to be made. Points of interest, such as particular cell types, e.g. labelled/unlabelled cells, can also be marked. Each cell type is identified by its nucleus and is denoted by a particular icon, the location of these cells is then marked with the appropriate icon, and the x‐y co‐ordinates of these points can be recorded.
In the case of the ventral tongue measurements, an area 2 mm from the tip of the tongue working towards the posterior end of the sample was defined using the AxiohomeTM system. This region of mucosa contains an undulating basal layer and a relatively flat surface at the suprabasal/stratum corneum boundary. In addition to the location of each cell type the length of the basal layer within the defined field was also recorded.
Moving towards the posterior from this 2 mm point, five separate areas were analysed from each mouse. As each area contained approximately 60 basal cells, this represents a total basal cell scoring of 300 cells per mouse. From the data recorded from such an analysis, a complete histometric picture (or cellular map) of the tissue could be determined including all basal and suprabasal cell nuclei and a wide range of parameters calculated and extracted (see below). The mean and standard errors of the mean are shown on the graphs.
Mitotic index data
The number of mitotic events was routinely recorded as one of the parameters in the Axiohome data collection procedure. Due to the short time period of mitosis these cells are fairly infrequent. Hence, in one of the circadian rhythm experiments, animals were injected with vincristine sulphate at 0.06 mg/0.6 mL ip per mouse to arrest cells in metaphase. Vincristine injections were given at 3‐hourly intervals throughout the day, and groups of animals were culled 3 h after each vincristine injection. This enabled the accumulation of cells entering mitosis during the 3 h preceding sacrifice to be recorded at each point through the day. The total number of cells entering mitosis over a 24‐h period could also be calculated, providing the daily birth rate of cells for the ventral tongue.
Data acquisition and processing
We have refined the analysis of tissue organization based upon cell position. One further adaptation was to save this information into a data file for use in further statistical analysis, modelling, and processing at a later date outside the laboratory.
We developed special software to process these files and to extract a variety of cell counts, morphometric measurements and topological properties, as well as the usual cell counts, e.g. the number of labelled cells. To perform size measurements the outline of the area, which is not saved explicitly during the laboratory session, is reconstructed by the software. We assume here that a polyline connecting all neighbouring cell nuclei near the basal membrane will sufficiently approximate the shape of the basal membrane. The program displays a graphical view of all basal and top layer points and a user traces with a computer mouse roughly the shape of the area. The program uses this sketch to connect points/cells and this takes less than a minute per area. (See Fig. 1).
Figure 1.

A typical area of mouse ventral tongue as scored using the Axiohome microscope showing the data as it is recorded . (a) top layer (area) width; (b) length of basal membrane; (c) maximum thickness; (d) minimal thickness. Triangles, labelled suprabasal cells; squares, unlabelled suprabasal cells; circles, unlabelled basal cells; crosses, labelled basal cells; rhombus, top layer tagging points.
-
1
The resulting data are used to calculate the:
-
•
length of the basal membrane
-
•
length of the stratum corneum border (surface length)
-
•
width of the area
-
•
total area
-
•
the minimum, maximum and average distances of basal cells to the topline (local mucosal thickness).
-
•
All other measurements are derived from these values, e.g. the basal cell density is defined as cells per mm basal membrane, and the thickness is derived from the area divided by the width of the area.
Moreover, for each suprabasal cell, its nearest distance to the basal membrane is calculated. This allows analysis of the percentage of labelled cells at specific distances from the basal membrane (see Fig. 2), which is useful for measuring cell migration velocities.
Figure 2.
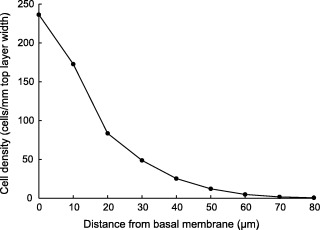
Positional cell density in mouse ventral tongue using data as in Table 1 . The cell density is expressed as cells per mm top layer width. Each distance value sums up the cells in distances of ±5 µm of the printed value, measured from the basal membrane. Thus the first region is only 5 µm thick; this region contains almost only basal cells.
Testing
We compared 36 manual measurements with those calculated by our software system. The length (area) measurements differed by less than 2%. We compared several basal layer shapes constructed from the program to those traced manually using the microscope and found no qualitative differences, although the reconstructed basal layers showed slightly more jitter than the manually drawn straight polylines. More than 3000 areas, equivalent to about half a million cells, were processed with this system. In addition to providing more detailed analyses, such digital measurement saves human acquisition time and gives reliable and reproducible data. The process can also detect a number of input errors, such as doubly scored cells or wrongly categorized cells.
Results
Histometric data
Table 1 shows some of the parameters that can be extracted from the dataset generated from the Axiohome scoring. These baseline data are for the control untreated BDF1 mouse ventral tongue mucosa. One obvious fact that emerges from such measurements is that there are about 1.47 times more cells in the suprabasal layers overlying the basal layer (ratio of basal to suprabasal cells is 65.05/102.77 or 0.63). However, analysis of the number of cells in successive layers (specific distances) from the basal layer indicates a progressive exponential fall in cell numbers (cell nuclei) with increasing distance ( Fig. 2 ). Nuclei are degraded in such stratified keratinizing epithelia as they reach the mucosal surface. If this degradation is complete, as it tends to be in murine oral mucosa, the process is referred to as orthokeratinization. In humans, the process is incomplete and nuclei persist in cells right up to the surface (parakeratinization). As the cellular entities are unlikely to disappear as they migrate to the surface, the data in Fig. 2 suggest that the nuclear destruction (the loss of the cellular marker used here) begins at lower levels and increases with increasing distance from the basal layer.
Table 1.
Basic histometric data for control BDF1 mice (256 areas of ventral tongue epithelium analysed)
| Mean | Std. deviation | Median | Minimum | Maximum | |
|---|---|---|---|---|---|
| Basal cells of all cells (%) | 39.64 | 6.92 | 40.00 | 22.22 | 57.14 |
| Basal cells/supra basal cells (ratio) | 0.68 | 0.20 | 0.67 | 0.29 | 1.33 |
| Basal length/top width b/a (ratio) | 1.40 | 0.23 | 1.36 | 0.99 | 2.53 |
| Amplitude d‐c (µm) | 49.41 | 18.10 | 46.91 | 8.48 | 106.74 |
| Thickness area/top width (µm) | 53.26 | 16.13 | 51.26 | 20.82 | 101.45 |
| Basal cell density (cells/mm basal length) | 162.37 | 11.93 | 163.59 | 128.00 | 189.13 |
| Basal cell density (cells/mm top width) | 228.16 | 44.57 | 223.41 | 140.95 | 435.47 |
| Cell density (cells/mm top width) | 587.70 | 133.02 | 573.15 | 348.10 | 1 226.32 |
| Cell density (cells/mm2 area) | 11 466.71 | 2083.51 | 11 325.46 | 6241.32 | 18 489.23 |
| Supra basal density (cells/mm2 area) | 6 898.93 | 1376.35 | 6 780.65 | 3900.82 | 10 743.22 |
Labelling index data
The changing pattern in labelling index with time after 3HTdR labelling in the basal layer, the suprabasal layers and the total cell population of the ventral tongue epithelium is shown in Fig. 3. The initial labelling index in the basal layer for mice injected at 15.00 h and culled 40 min later is 5.01 ± 0.50%. An additional 3.82 ± 0.22% of cells in the suprabasal layer were labelled, indicating that the total proliferative compartment, as identified by pulse labelling, includes a significant number of cells that histologically appear from the position of their nuclei to be in the first suprabasal layer. There are 10 501 ± 476 cells per mm2 in the ventral tongue epithelium at the beginning of this experiment. This parameter remains broadly constant over the 24‐h sampling period, with an average value for the eight sampled times of 10 490 ± 210 cells per unit area. The number of cells per unit length of the basal layer, however, shows a progressive fall over the 24 h from a value of 174.5 ± 3.2 cells per unit length to 143.8 ± 4.0 at 07.00 h with a return to the control value at the end of the 24 h. (2, 3)
Figure 3.

Shows the changing pattern in the labelling index in mouse ventral tongue over the first 24 h after a single injection of tritiated thymidine. The labelling index is presented for the basal cells, suprabasal cells and total cells in the epithelium in the upper panel. The lower panel shows the changing number of cells in a mm length of basal layer with time after tritiated thymidine injection. There is a progressive decrease in the basal cell density over the first 16 h, suggesting a circadian related emigration of cells from the basal layer. The lower panel shows the labelling index changes over the first 4 days after tritiated thymidine injection. After the initial rapid increase in labelling index in the first 24 h, there is a more gradual rise over the subsequent 2 days and a fall off on the fourth day. The mean and standard errors are shown.
The changes in the basal layer labelling index (LI) over the 24‐h time period after 3HTdR administration showed some surprising changes. The basal layer LI rose to a value at 19.00 h of almost double the 15.00 h value (5.01 ± 0.50% up to 9.94 ± 1.32%). The LI then remained roughly constant for the 21.00 and 23.00 h samples, before rising dramatically between 23.00 h and reaching a peak of 37.41 ± 2.8% at 07.00 h. This peak occurred at a time coincident with the minimum basal cell density and represents an eightfold increase in the percentage of labelled basal cells from 15.00 to 07.00 h, a 16‐h period. The rise in LI between 23.00 and 07.00 occurs at a time coincident with the circadian surge of cells in S phase (see below and Fig. 4). This rapid rise in LI clearly cannot be attributed to three successive cell cycles as this would imply a cell cycle time of approximately 5 h, which is clearly inconsistent with all other published cell kinetic data. The labelling index for the suprabasal compartment remained broadly constant between 15.00 and 23.00 at 3.82 ± 2.2% rising to about 11.36 ± 1.9% at 07.00 h.
Figure 4.

Shows the circadian related changes in mitotic index as determined using a 3‐h vincristine accumulation at each 3 h increment throughout the day (upper left panel). The straight mitotic index showing a sharp peak at 13.00 h (upper right panel) and the mitotic data shown in relation to labelling index circadian variation data (lower panel).
There is clearly evidence of migration of cells from the basal layer into the suprabasal layers with a minimum in the basal cell density 16 h into the experiment, at 07.00 h. This is consistent with the evidence of increased labelling in the suprabasal layers, which also increases to a maximum at 07.00 h. There is thus evidence of a synchronized circadian movement of cells from the basal layer into the suprabasal layers in the early hours of the morning.
The surprising feature of the labelling data is that there is a rapid and dramatic increase in the number of labelled cells that is consistent with a synchronized surge of G1 cells into S phase between 23.00 and 07.00 h. These cells appear to be incorporating tritiated thymidine from a prestored pool when they enter S. This surge occurs at a time that is consistent with the circadian rhythm data in the literature and the data generated within the framework of the current studies. Because of the unusual nature of these results, the experiments have been repeated independently three times and sampling times have been extended up to 4 days. As shown in Fig. 3 (panel 3), the pooled results are clearly reproducible (compare with upper panel) with the labelling index in the basal layer rising from an initial value of 5.01 ± 0.50 to 30.76 ± 4.87% at 24 h and rising slightly further on day 2 and even further on day 3 (47.88 ± 1.62%) before falling back slightly on day 4. This suggests that the material in the intracellular pool is essentially depleted by the first synchronized surge of cells into S phase in the first 24 h. Following the 24‐h period, cell divisions increase the apparent labelling index as previously labelled cells divide and this division activity now roughly balances the migration of labelled cells from the basal layer to the suprabasal layers.
The nuclear density of the basal layer (the number of basal cells beneath 1 mm length of the upper cornified surface) shows some slight variations with minimum values 1 day after labelling (data not presented). This suggests that the handling of the animals (stress and hence adrenalin levels) or the 3HTdR effects may disturb the system slightly.
In the pooled data from the three independent experiments the initial suprabasal labelling index was 3.82 ± 0.22% and this rises to 8.15 ± 1.62% at 24 h. It continues to rise successively over the next 2 days to 29.93 ± 2.62% as a consequence of the continued migration of cells from the prelabelled basal compartment.
Circadian rhythms and mitotic indices
Circadian rhythms in the fraction of S phase cells and cells in mitosis have been well documented for the ventral tongue (Dörr et al. 1994a; Wardley et al. 1998) and the dorsal tongue epithelium (Hume & Potten 1976). These published reports clearly show peak values occurring at around 03.00‐06.00 h for the S phase fraction and minima occurring at around 15.00 h. The amplitude of the circadian waves in our study was large, suggesting a high degree of synchrony amongst proliferative cells. In the present experiments samples have been taken at 3‐hourly intervals throughout the day and the labelling data confirm and extend the published observations (see Fig. 4, lower panel). We have performed a new experiment analysing the circadian rhythm using vincristine accumulation for each 3‐h time interval over the 24‐h period. Figure 4 shows the result of the mitotic accumulation data and these clearly indicate that virtually no cells enter mitosis between 21.00 and 03.00 h. The vincristine‐induced mitotic arrest over this time period is about 2% of the basal cells. In contrast, nearly 20% of the cells enter mitosis between 12.00 and 15.00 h. The data as a whole, over the entire 24 h, indicate that 54% of the basal cells enter mitosis, i.e. approximately half the cells in the basal layer divide each day, with a high degree of synchronization between 12.00 and 15.00. If the vincristine acts quickly, then what is seen in a 3‐h accumulation experiment underestimates the rate of entry into mitosis because some cells are already in metaphase when the drug is given. This could lower the estimates that 20% of cells enter mitosis between 12.00 and 15.00 hours and that 54% enter over 24 h (to something like 14% and 40%). However, vincristine probably does not act immediately, and with a 3‐h collection period there may even be a few cells escaping from the block, resulting in actual values more like 16% and 45%. In order to analyse the circadian peak in greater detail a simple mitotic index experiment was performed at hourly intervals over a range of times that spanned the peak in the vincristine accumulation data. Figure 4 (upper right panel) shows a highly synchronized peak of mitotic activity at 13.00. Figure 4 (lower panel) shows the mitotic circadian data together with the S phase labelling index. The mitotic circadian curve is displaced to the right of the S phase curve by 9‐12 h.
From the circadian vincristine‐induced stathmokinetic experiment, a 24‐h average value for the cell production rate of about 2.25 cells/h can be deduced. This gives an average turnover time for the ventral tongue epithelium of 44 h. However, because of the strong synchronization and various assumptions and approximations, these figures should be viewed with some caution.
Additional information obtained from this analysis (but not presented here) includes the fact that there is a statistically significant clustering of labelled cells along the basal layer but no clear pattern related to basal layer undulations. Overall, the data indicate that there is an increase in basal layer density in the mid‐afternoon consistent with the following sequence: an increase in mitotic activity before noon leading to an increase in basal cell density that causes an increase in basal layer length (more undulations), which is followed by cell emigration and an increase in thickness of the epithelium.
Data such as those shown in Fig. 3 (lower right) and also presented as control data for the postirradiation studies on cell migration in Potten et al. (2002) can be analysed to provide information on the movement of labelled cells through the suprabasal strata (Fig. 5). Here a selection of time points has been analysed to provide cell positional labelling indices. Such curves should be viewed with caution because labelled cells and total cells (see Fig. 2) fall dramatically as cells progress through the strata. Indeed labelling may even decline earlier than loss of recognizable nuclei. However, the process of cell migration can be clearly demonstrated by the data covering the first 10‐20 µm.
Figure 5.

Positional labelling index in mouse ventral tongue at different time points. The distances are defined as in Figure 2 . The bracketed numbers show the total labelling index.
Discussion
These data illustrate the dramatic and unusual influence of the delayed release of tritiated thymidine from intracellular pools, and provides evidence that the phenomenon reported for skin and hair follicles in the 1970s (Potten 1971, 1973; Potten & Croxson 1971; Potten & Schaer 1971) also applies to the stratified epithelium on the ventral surface of the tongue. The extent to which this delayed incorporation complicates cell kinetic studies in the ventral tongue remains to be elucidated, but it would indicate that it is not possible to make deductions about cell cycle time from ‘dilution’ of the incorporated thymidine estimated by autoradiographic grain density or labelling index‐doubling in such tissues. The injection of tritiated thymidine into a mouse does not constitute a pulse for this tissue but rather reflects a period of continuous availability for perhaps 24 h. However, the results cannot be viewed as a continuous labelling experiment in the classic sense because of the high degree of synchronization of the cells within the circadian rhythm. It is likely that this phenomenon will complicate studies such as percentage labelled mitosis (PLM) curves, although it remains to be proven that the thymidine that is incorporated from the delayed pool permanently marks the cells. This effective continuous labelling would appear in a PLM curve as a rapid increase from 0 to 100% as the labelled S phase cohort enters mitosis. Furthermore, it would be expected that the PLM would remain at 100% due to the continued availability of thymidine for new cells entering S phase and then moving through to mitosis. However, this was not apparently observed in the only PLM curve for the ventral tongue generated by Dörr & Kummermehr (1991), which suggested that in one particular strain the delayed uptake phenomenon was not apparent. This PLM experiment was itself somewhat unconventional however, as it involved a short‐term series of 3HTdR injections spanning the circadian peak in S phase. This would label the cohort that is probably involved in the delayed uptake phenomenon. Finally, the C3H mice used had a very different cell kinetic behaviour to those used in the present experiments. (See Dörr et al. 2002). It is surprising that different mouse strains apparently exhibit such dramatic differences in cell cycle parameters even when the ages were similar (although the sexes did differ).
These workers undertook a complex and difficult approach to a PLM experiment. A basic assumption of a PLM experiment is an asynchronous progression of cells through the cell cycle. This clearly does not occur in oral epithelia as a consequence of the circadian synchrony. The technique used by Dörr & Kummermehr was to label all cells passing through a cycle in one 24‐h period by three injections of tritiated thymidine and to use vinblastine to accumulate a 4‐h catchment of mitoses. The results suggested cohorts of cells with different cycle times of 2 or 3 days.
However, the delayed incorporation phenomenon does not detract from the ability of using 3HTdR to mark cells to study their passage through the suprabasal layers to the surface of the epithelium and hence deduce information relating to the velocity of cells through the layers and the transit time.
The data presented here indicate that there is a delay of at least 12 h between 3HTdR uptake into S phase cells and the emigration of labelled cells from the basal layer to the first suprabasal layer. This delay must include the time taken to pass through G2 and M and a postmitotic G1 basal layer maturation phase. As the migration from the basal layer is dependent on the time of day, i.e. has its own circadian variation, the postmitotic maturation phase may vary also with the time of day. The comparison of circadian mitotic data with the circadian labelling data suggests that G2 may be a significant proportion of this delay in emigration, assuming similar cell‐cycle duration in all cells.
The circadian rhythm in the number of S phase or mitotic cells is in agreement with previously published data (Hume & Potten 1976; Wardley et al. 1998). The vincristine‐induced stathmokinesis data indicate that about half the cells in the basal layer divide within a 24‐h period and that there is a dramatic surge in mitotic activity between 24.00 and 02.00 h. Interestingly the value of the peak in this vincristine experiment is about twice that seen in a similar experiment performed by Dörr & Kummermehr (1991).
Mathematical modelling studies (Appleton et al. 2002), confirm the high degree of cell‐cycle synchronization and the fact that there is a population of cells that enter mitosis synchronously within a very narrow window of time. The population of cells that divide in a given 24 h may contain some cells that have a cycle time of 24 h. This should account for some of the increase in labelling index seen in Fig. 3. Other studies reported by Potten et al. (2002) suggest a second population of cells, also with a circadian rhythm, which may be cycling with a 48‐h cycle. Thus, the basal layer contains at least three distinct cellular compartments: postmitotic maturing cells; some cells with a cycle time of 24 h; and some cells with a cycle time of 48 h. This is suggestive of the sort of hierarchical organization reported for the dorsal tongue (Hume & Potten 1976) although in the ventral surface this hierarchical organization cannot be related to any structural organization or specific positions along the basement membrane. It may, however, account for the incidental observation of apparent clustering of labelled cells on the basal layer (data not shown). Similar conclusions have been obtained by others (Dörr & Kummermehr 1991) on the basis of PLM curves, suggesting cohorts of basal cells with different cycle times.
Of the numerous prior studies in the mouse (Brown & Berry 1968; Izquierdo & Gibbs 1972; Moller & Larsen 1978), and the hamster (Burns et al. 1975; Hume & Potten 1976; Dörr & Kummermehr 1991; Dörr et al. 1994a), there is general consensus amongst the studies that the peak values in S phase cells (labelling index) occur at around 03.00‐06.00 h with the minimum at 15.00 h. There is some variation in the amplitude from report to report, partly dependent on the techniques used. For example, flow cytometric approaches tend to give a lower amplitude (Dörr et al. 1994b). One difficulty in making direct comparisons between these studies in different rodent species is a tendency to express labelled cells or mitotic figures as different indices where the denominator varies from being only basal cells, to basal plus suprabasal or even total cells in the epithelium. These proliferative parameters can also be expressed as the number of labelled cells or mitotic cells per unit length of the basal layer or per unit length of the upper surface.
One of the most comprehensive recent studies is the work of Dörr & Kummermehr (1991). They also showed that the peak in mitotic activity followed the S phase peak by up to about 8‐10 h. Metaphase arrest data indicated a mitotic flux of about 12 cells/hour, when metaphase arrest agents where used between 06.00 and 08.00 h. Using metaphase arrest studies over a 24‐h period, they found that 3.25 metaphases were arrested/mm epithelial surface around midnight, reaching peak values of about 37 metaphases/mm between 08.00 and noon. These studies suggested that about 20% of the cells in the ventral tongue divided each day, considerably lower than the figure observed in our current experiments. On the basis of 20% per day dividing, a turnover time of about 5 days can be calculated. A 20% metaphase accumulation percentage is equivalent to about 85 metaphases per mm surface length.
Other studies involving PLM analyses have been performed in rat tongues by Hamilton & Blackwood (1974) who noticed multiple small secondary peaks at 33, 47 and 54 h suggesting heterogeneity in cell proliferations. Burns et al. (1975) conducted a limited PLM in mouse ventral tongues (over a 24‐h period) and estimated the duration of the S phase to be between 5.1 and 5.5 h.
Based on the movement of prelabelled cells through the suprabasal layers to the superficial layer, Dörr et al. (1996), calculated a minimum residence time following mitoses for cells in the germinal layer of 2‐3 days, and a transit time through the functional layers of a further 2‐3 days. This study involved following the fate of a prelabelled cohort of cells for 8 days. Animals received three injections of 3HTdr at 21.00, 02.00 and 07.00 h, thus labelling essentially all the S phase cells in 1 day's cycle and following the movement of this cohort. The fact that the delayed uptake phenomenon observed in our experiments was not seen in these studies is almost certainly a consequence of the multiple‐labelling protocol. Those cells that would have incorporated label from the long‐lived pool received a second pulse of tritiated thymidine when they entered S.
Dörr & Kummermehr (1991) estimated turnover times of 3.7 and 5.2 days for two separate cohorts of cells in the ventral tongue epithelium of C3H mice. The data presented here would suggest more rapid turnover in the various subcompartments of the epithelium suggesting significant differences between mouse strains. Similar differences between Syrian and Chinese hamsters in turnover times were observed by Izquierdo & Gibbs (1972 ) (8.4 days in Syrian and 3.8 days in Chinese hamsters). The interesting feature of the ventral tongue data, both from the work of Dörr and the present studies, is the fact that distinct cohorts of cells with different proliferative characteristics are implied, similar to the observations presented by Potten et al. in 1982 for mouse back skin. One interpretation is that this heterogeneity is a reflection of cell lineage heterogeneity with stem and transit cells having different cell cycle times.
One question that can be reasonably asked is how these parameters compare with those for humans. One significant difference between mouse and man in terms of the ventral tongue, is the pattern of keratinization. The hamster and mouse tongue is orthokeratinized with a significant stratum corneum while the human ventral tongue is parakeratinized. In the ventral tongue of C3H mice, Dörr & Kummermehr (1991) measured 305.7 germinal cells per mm length or 430 total nucleated cells in the epithelium per mm. Corresponding figures have been calculated for humans in different sites in the mouth; for the maxilliary vestibule, mandibilliary vestibule, floor of mouth and hard palate; the number of nucleated cells per mm was 1200, 1120, 600 and 1470, respectively. The corresponding labelling indices were 4.9, 4.3, 5.5 and 3.5, giving an average labelling index for the epithelium as a whole of 4.75 ± 0.32% or 8.15 ± 0.168% for the germinal layer only. The corresponding values for the labelled cells per mm length were 58, 43, 36 and 48, respectively. Although a circadian rhythm in some proliferative parameters is likely in humans, this has not been convincingly demonstrated. However, studies using a sufficient quantity of samples and volunteers throughout the full 24‐h period are difficult to obtain. Furthermore, a human study group does not adhere to the uniform sleep patterns and hence the amplitude of any rhythm may be damped. Pulse labelling data for humans suggest values obtained over 10.00‐15.00 h that are lower than those observed the mouse (see Table 2) (taken from Thomson et al. 1999) who also undertook an extensive analysis of the labelling indices, cell fluxes in and out of S phase and S phase durations in eight regions of human oral mucosa using in vitro short‐term incubations in 3HTdR and BrdUrd (see Table 2).
Table 2.
Proliferative parameters of human oral mucosa. Taken between 10.00 and 15.00 hours (from Thomson et al. 1999 )
| LI% | Influx (%/h) | Efflux (%/h) | S phase duration (h) | n | |
|---|---|---|---|---|---|
| Labial mucosa | 11.8 | 2.4 | 1.6 | 5.4 | 7 |
| Buccal mucosa | 10.3 | 2.1 | 1.6 | 7.2 | 24 |
| Maxillary gingiva | 9.1 | 1.6 | 1.2 | 6.4 | 10 |
| Mandibular gingiva | 9.1 | 1.5 | 1.9 | 5.7 | 34 |
| Hard palate | 7.2 | 1.4 | 1.5 | 4.8 | 8 |
| Dorsal tongue | 4.3 | 1.0 | 0.7 | 5.2 | 7 |
| Ventral tongue | 10.1 | 1.7 | 1.1 | 7.1 | 9 |
| Floor of mouth | 12.3 | 1.7 | 1.6 | 7.4 | 6 |
| Mouse ventral tongue (from current experiments) | |||||
| Average MI over: | % | Average LI over: | % | ||
| 24 h | 6.7 | 24 h | 15.1 | ||
| Maximum MI | 18.7 | Maximum LI | 37.4 | ||
| Minimum MI | 1.0 | Minimum LI | 4.6 | ||
Conclusions
It is clear that the ventral tongue mucosa in the mouse, as for the dorsal surface, is a rapidly proliferating stratified keratinizing epithelium with a very pronounced circadian rhythm. It exhibits some unusual characteristics in relation to thymidine intracellular pool kinetics. The system is beginning to be well characterized and detailed histrometric analysis techniques have been developed. The turnover time is slower than that deduced for human oral tissues but similar histological characteristics apply. With its more rapid turnover, the mouse model presented here has advantages since in vivo experiments can be performed over a shorter time scale than with other model system.
Acknowledgements
This work was carried out with the support of the Cancer Research Campaign (UK) and some support from Amgen Inc, California, and the Deutsche Forschungs Germeinschaft. (LO342/4‐2, LO 342/6‐2)
References
- Appleton DR, Thomson PJ, Donaghey CE, Potten CS, McGurk M (2002) Simulation of cell proliferation in mouse oral epithelium, and the action of epidermal growth factor: evidence for a high degree of synchronisation of the stem cells. Cell Prolif. 35 (Suppl. 1) 68. [DOI] [PMC free article] [PubMed] [Google Scholar]
- Brown JM, Berry RJ (1968) The relationship between diurnal variation of the number of cells in mitosis and the number of cells synthesising DNA in the epithelium of the hamster cheek pouch. Cell Tissue Kinetics 1, 23. [Google Scholar]
- Burns ER, Scheving LE, Fawcett DF, Gibbs WM, Galatzan RE (1975) Circadian influence on the frequency of labelled mitoses method in the stratified squamous epithelium of the mouse oesophagus and tongue. Anat. Rec. 184, 265. [DOI] [PubMed] [Google Scholar]
- Dörr W, Emmendorfer H, Haide E, Kummermehr J (1994a) Proliferation equivalent of ‘accelerated repopulation’ in mouse oral mucosa. Int. J. Radiat Biol. 66, 157. [DOI] [PubMed] [Google Scholar]
- Dörr W, Arui J, Beisker W, Schultz‐Hector S (1994b) Cell kinetic studies in mouse tongue mucosa by autoradiographic, immunohistochemical and flow cytometric techniques. Cell Prolif. 27, 321. [DOI] [PubMed] [Google Scholar]
- Dörr W, Emmendorfer H, Weber‐Frisch M (1996) Tissue kinetics in mouse tongue mucosa during daily fractionated radiotherapy. Cell Prolif 29, 495. [DOI] [PubMed] [Google Scholar]
- Dörr W, Kummermehr J (1991) Proliferation kinetics of mouse tongue epithelium under normal conditions and following single dose irradiation. Virchows Arch. B Cell Pathol. Incl. Mol. Pathol. 60, 287. [DOI] [PubMed] [Google Scholar]
- Dörr W, Spekl K, Martin M (2002) Radiation‐induced oral mucositis in mice: Strain differences. Cell Prolif. 35 (Suppl. 1) 86. [DOI] [PMC free article] [PubMed] [Google Scholar]
- Hamilton AI, Blackwood HJJ (1974) Cell renewal of oral mucosal epithelium of the rat. J. Anat 117, 313. [PMC free article] [PubMed] [Google Scholar]
- Hume WJ, Potten CS (1976) The ordered columnar structure of mouse filiform papillae. J. Cell Sci. 22, 149. [DOI] [PubMed] [Google Scholar]
- Izquierdo JN, Gibbs SJ (1972) Circadian Rhythms of DNA synthesis and mitotic activity in hamster cheek pouch epithelium. Exp. Cell Res. 71, 402. [DOI] [PubMed] [Google Scholar]
- Moller U, Larsen JK (1978) The circadian variations in the epithelial growth of the hamster cheek pouch: Quantitative analysis of DNA distributions. Cell Tissue Kinetics. 11, 405. [DOI] [PubMed] [Google Scholar]
- Potten CS (1971) Early and late incorporation of tritiated thymidine into skin cells and the presence of a long‐lived G0‐specific precursor pool. J. Cell Biol. 51, 855. [DOI] [PMC free article] [PubMed] [Google Scholar]
- Potten CS (1973) Further observations on the late labelling associated with stimulus‐responsive cells in skin. Cell Tissue Kinetics 6, 533. [DOI] [PubMed] [Google Scholar]
- Potten CS, Al‐Bawari SE, Hume WJ, Searle J (1977) Circadian rhythms of presumptive stem cells in three different epithelia of the mouse. Cell Tissue Kinetics 10, 557. [DOI] [PubMed] [Google Scholar]
- Potten CS, Booth D, Cragg NJ, O'Shea JA, Tudor GL, Booth C (2002) Cell kinetic studies in murine ventral tongue epithelium: cell cycle progression studies using double labelling techniques. Cell Prolif. 35 (Suppl. 1) 16. [DOI] [PMC free article] [PubMed] [Google Scholar]
- Potten CS, Croxson MB (1971) Fixative soluble tritium pool size after tritiated thymidine injection into mice with skin stimulated by plucking. Br. J. Dermat 85, 566. [DOI] [PubMed] [Google Scholar]
- Potten CS, Schaer JC (1971) Labelling of murine mastocytoma cells in vitro with plasma from tritiated thymidine labelled animals. J. Cell Biol. 51, 862. [DOI] [PMC free article] [PubMed] [Google Scholar]
- Potten CS, Wichmann HE, Loeffler M, Dobek K, Major D (1982) Evidence for discrete cell kinetic sub‐populations in mouse epidermis based on mathematical analysis. Cell Tissue Kinet. 15, 305. [DOI] [PubMed] [Google Scholar]
- Sonis ST, Tracey C, Shklar G, Jenson J, Florine D (1990) An animal model for mucositis induced by cancer chemotherapy. Oral Surg. Oral Med. Oral Pathol 69, 437. [DOI] [PubMed] [Google Scholar]
- Thomson PJ, Potten CS, Appleton DR (1999) Mapping dynamic epithelial cell proliferative activity within the oral cavity of man: a new insight into carcinogenesis? Br. J. Oral Maxillofacial Surg. 37, 377. [DOI] [PubMed] [Google Scholar]
- Wardley AM, Booth D, Roberts SA, Scarffe JH, Potten CS (1998) A quantitative histometric murine in vivo model of radiation‐induced oral mucositis. Arch. Oral Biol. 43, 567. [DOI] [PubMed] [Google Scholar]