

Abstract
Abstract. The inhibitory action of gangliosides GT1B, GD1A, GM3 and GM1 on cell proliferation and epidermal growth factor receptor (EGFR) phosphorylation was determined in the N‐myc amplified human neuroblastoma cell line NBL‐W. The IC50 of each ganglioside was estimated from concentration‐response regressions generated by incubating NBL‐W cells with incremental concentrations (5–1000 µm) of GT1B, GD1A, GM3 or GM1 for 4 days. Cell proliferation was quantitatively determined by a colourimetric assay using tetrazolium dye and spectrophotometric analysis, and EGFR phosphorylation by densitometry of Western blots. All gangliosides assayed, with the exception of GM1, inhibited NBL‐W cell proliferation in a concentration‐dependent manner. The IC50s for gangliosides GT1B[molecular weight (MW) 2129], GM3 (MW 1236), and GD1A (MW 1838) were (mean ± SEM) 117 ± 26, 255 ± 29, and 425 ± 44 m, respectively. In contrast, the IC50 for GM1 (MW 1547) could not be determined. Incubation of NBL‐W cells with epidermal growth factor (EGF) concentrations ranging from 0.1 to 1000 ng/ml progressively increased cell proliferation rate, but it plateaued at concentrations above 10 ng/ml. EGFR tyrosine phosphorylation, however, was incrementally stimulated by EGF concentrations from 1 to 100 ng/ml. The suppression of EGF‐induced EGFR phosphorylation differed for each ganglioside, and their respective inhibitory potencies were as follows: EGFR phosphorylation [area under curve (+ EGF)/area under curve (– EGF)]: control (no ganglioside added) = 8.2; GM1 = 8.3; GD1A = 6.7; GM3 = 4.87, and GT1B = 4.09. The lower the ratio, the greater the inhibitory activity of the ganglioside. Gangliosides GD1A and GT1B, which have terminal N‐acetyl neuraminic acid moieties, as well as one and two N‐acetyl neuraminic acid residues linked to the internal galactose, respectively, both inhibited cell proliferation and EGFR phosphorylation. However, GD1A was a more potent suppressor of cell proliferation and GT1B most effective against EGFR phosphorylation. GM3, which only has a terminal N‐acetyl neuraminic acid, inhibited cell proliferation and EGFR phosphorylation almost equivalently. These data suggest that gangliosides differ in their potency as inhibitors of NBL‐W neuroblastoma cell proliferation and EGFR tyrosine phosphorylation, and that perturbations in the differential expression of membrane glycosphingolipids may play a role in modulating neuroblastoma growth.
Introduction
Tumour cell proliferation and differentiation are regulated by a variety of polypeptide growth factors that bind to specific cell surface receptors and trigger a cascade of intracellular events. Constituents of the cell membrane such as gangliosides and circulating factors can modulate these complex interactions by inhibiting receptor dimerization or through other allosteric actions.
Gangliosides are glycosphingolipids containing one or more molecules of the negatively charged acidic sugar sialic acid. They are present in the outer lipid layer of plasma membranes of eukaryotic cells and have been found in virtually all tissues and body fluids (Ladisch 1987). Numerous investigations have demonstrated that gangliosides can affect cell–cell interactions (Eggens et al. 1989), differentiation (1988, 1986), proliferation (Hanai et al. 1988), and neurite outgrowth (Spiegel & Fishman 1987; Paller et al. 1993) in a variety of cell types. The ganglioside composition of murine and human neuroblastoma cell lines has been characterized and glycolipids with diverse chemical structures have been found to be present in their cell membranes (Li & Ladisch 1997; Schengrund & Shochat 1988).
Developmental changes in ganglioside composition of the nervous system are characterized by an increase in GM1 and GD1A, and a decrease in GT1B during transition from foetal to postnatal life (Svennerholm et al. 1989). Epidermal growth factor (EGF), upon binding to its specific receptor, stimulates receptor‐associated tyrosine kinase, leading to auto‐phosphorylation of the receptor (Gill & Lazar 1981; Kawamoto et al. 1983). GM3 has been shown to inhibit EGF‐stimulated phosphorylation and dimer formation of epidermermal growth factor receptor (EGFR) in isolated membranes of the EGF‐dependent A431 and A1S human squamous cell carcinoma lines; but, in contrast, GM1 was inactive (Bremer et al. 1986; Rebbaa et al. 1996).
This investigation has determined the effects of gangliosides GD1A, GT1B, GM3 and GM1 on intrinsic and EGF‐stimulated cell proliferation and EGFR tyrosine phosphorylation in human neuroblastoma tumour cells. The inhibitory potencies (IC50) of each ganglioside on these parameters differed markedly. Our findings demonstrated that suppression of neuroblastoma cell proliferation by exogenous gangliosides was concentration‐dependent and, in general, correlated with their respective potencies as inhibitors of EGF‐stimulated EGFR phosphorylation. Analysis of structure–activity relationships suggested that the number and configuration of N‐acetyl neuraminic acid residues in each ganglioside was an important determinant of potency.
Materials and Methods
Sources of gangliosides
GM3 was extracted from dog erythrocytes by a modification of the method described by Ledeen (1982) and Yasue et al. (1978). The solubilized gangliosides were separated into individual components by high‐performance liquid chromatography on a silica gel column. A continuous gradient elution system consisting of chloroform:methanol:water, ranging from 75 : 25 : 3 to 20 : 80 : 15 (v:v), was utilized. The purity of GM3 in specific fractions was determined by thin‐layer chromatography (TLC) using silica gel TLC plates. All GM3 specimens were lyophilized and stored at 4 °C. Gangliosides GT1B, GD1A and GM1 were obtained from the Accurate Chemical and Scientific Company (Westbury, NY). Solutions of each ganglioside were sonicated and sterilized by passage through a 0.22‐µm cellulose acetate syringe filter prior to use.
Cell cultures
The human neuroblastoma cell line NBL‐W, which expresses high amplification of N‐myc, was kindly provided by Dr Susan Cohn. It was derived from a primary tumour in a patient with stage IV‐S disease (Cohn et al. 1987). NBL‐W cells were cultured in high‐glucose Dulbecco’s modified Eagle’s medium (DMEM) (Gibco, Gaitherburg, MD), supplemented with 2% foetal calf serum (FCS), 100 units/ml penicillin and 100 µg/ml streptomycin. Adherent NBL‐W cells were harvested for each experiment by decanting the DMEM and incubating the monolayer in a solution of 0.05% trypsin and 0.01% ethylenediaminotetracetic acid (EDTA) for 3 min. Free‐floating cells were then transferred to a sterile test tube and centrifuged at low speed (1000 g) for 5 min to produce a pellet. The trypsin/EDTA‐containing solution was aspirated and DMEM containing 2% FCS added. Cells prepared in this manner were used for all experiments, except where noted.
Cell proliferation studies
NBL‐W cells were seeded into 96‐well plates at an initial concentration of 2 × 10⁴ cells/100 µL/well and incubated for 96 h after addition of a specific ganglioside. The effects of GT1B, GM3, GD1A and GM1 on cell proliferation were determined in concentration‐response studies utilizing a range of 5–1000 µm. The concentration of each ganglioside producing 50% inhibition of cell proliferation (IC50) was calculated. The proliferative response of NBL‐W cells to EGF was also quantitatively evaluated. Human recombinant EGF (Gibco) was dissolved in an appropriate volume of 0.1% DMEM medium for each experiment, and added to designated wells at concentrations of 0.01–1000 ng/ml (0.016–166.6 nm). Following incubation, cell proliferation was determined with the CellTiter 96 non‐radioactive cell proliferation assay kit (Promega, Madison, WI). Tetrazolium dye was added to each well and the cells incubated for 4 h at 37 °C. The incubation mixture was solubilized and the plate read in an enzyme‐linked immunoabsorbent assay (ELISA) plate reader at a wavelength of 570 nm, using a reference wavelength of 650 nm (Berridge et al. 1996).
EGFR tyrosine phosphorylation
NBL‐W cells cultured in DMEM containing 2% FCS were seeded into a 24‐well plate at an initial concentration of 1 × 10⁶ cells/2 ml/well and incubated at 37 °C for 24 h. The 2% FCS‐DMEM medium was replaced with serum‐free DMEM for 12–20 h prior to assay. Gangliosides GM3, GT1B, GD1A or GM1 at concentrations of 100 µm were added to specific wells and the cells incubated for 1 h at 37 °C. The medium was removed and cells washed with serum‐free DMEM. EGF (100 ng/ml; 16.6 nm) was added and cells stimulated for 1 min prior to harvesting. Whole cell lysates were prepared by placing cells in 100 µL of lysis buffer (1% Triton‐X‐100, 20 mm‐Tris, 137 mm‐NaCl, 10% glycerol, 1 mm‐phenylmethylsulphonyl fluoride, 0.15 U aprotinin per ml, and 1 mM sodium orthovanadate) for 20 min at 4 °C. After sonification with two 10‐s pulses at 4 °C, specimens were electrophoresed on a 7.5% polyacrylamide SDS/polyacrylamide gel electrophoresis (PAGE) gel and separated proteins electro‐transferred to Immobilon‐P membranes (Millipore, Bedford, MA). The phosphotyrosine‐containing proteins were detected with a primary antiphosphotyrosine monoclonal antibody (UBI, Lake Placid, NY) and a secondary horseradish peroxidase‐conjugated antibody (Amersham Corp., Arlington Heights, IL) using an enhanced chemiluminescence detection system (Amersham Corp.). Immunoreactive bands at 175 kDa for EGFR specific tyrosine kinase were quantified by scanning densitometry and the area under the curve (AUC) expressed as arbitrary intensity units.
Statistical methods
Data were analysed by anova from the GLM procedure of SAS (version 6, SAS Institute Inc., Cary, NC). For experiments contrasting absorbance (% of control) with EGF or ganglioside concentration, one‐ and two‐way analyses of variance were used. Tests of significance were corrected by the Bonferroni inequality to maintain a 5% type I error rate.
Results
Effect of EGF on NBL‐W cell proliferation
The proliferative response of NBL‐W cells to EGF was determined following incubation of cells in serum‐free media for 12–20 h prior to the addition of EGF. A 96‐h incubation with EGF significantly stimulated cell proliferation in a concentration‐dependent manner (Fig. 1). The lowest concentration of EGF utilized, 0.1 ng/ml (0.016 nm), elicited a 20% increment in proliferation above control. A near‐maximal response of 80% above control was induced by 1.0 ng/ml (0.16 nm) EGF and a maximal response of 100% above control by 10 ng/ml (1.66 nm) EGF. EGF concentrations of 100 ng/ml (16.6 nm) and 1000 ng/ml (166.6 nm) did not evoke a greater proliferative response, indicating that the concentration‐response curve had plateaued at 10 ng/ml (1.66 nm) EGF. Morphological changes, such as neurite extrusion, were not observed in any of the EGF‐stimulated cells.
Figure 1.
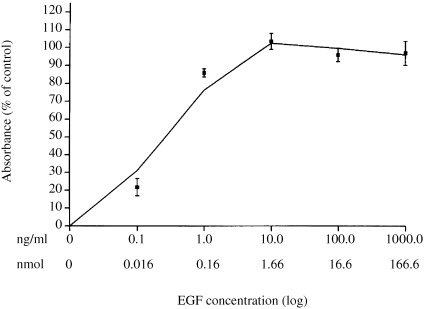
Effect of EGF on NBL‐W cell proliferation. NBL‐W cells cultured in DMEM containing 2% FCS were seeded into 96‐well plates at an initial concentration of 2 × 10⁴ cells/100 µL/well and transferred into serum‐free media 12–20 h prior to each experiment. Incremental concentrations of EGF (0.1–1000 ng/ml) were added to designated wells and cells incubated for 96 h. Data are expressed as absorbance (% increase above control). Each point represents the mean SEM of 7–9 replicates for each EGF concentration (n = 3 experiments).
Effect of gangliosides GT1B, GM3, GD1A and GM1 on intrinsic NBL‐W cell proliferation
NBL‐W cells maintained in DMEM containing 2% FCS were incubated for 96 h with either GT1B, GM3, GD1A or GM1 at concentrations ranging from 5 to 1000 µm. Cell proliferation was inhibited in a concentration‐dependent manner (Fig. 2). The respective IC50 for each ganglioside was as follows (mean ± SEM): GT1B (MW 2129), 117 ± 26 µm; GM3 (MW 1236), 255 ± 29 µm; GD1A (MW 1838), 425 ± 44 µm, and GM1 (MW 1547), non‐detectable.
Figure 2.
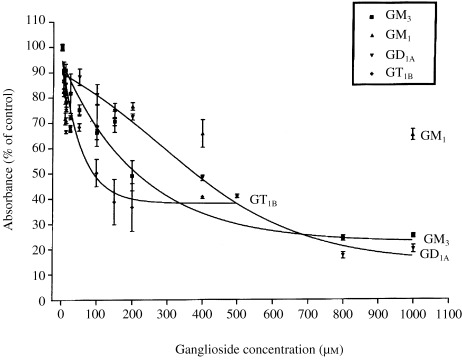
Effect of gangliosides GD1A, GT1B, GM3 and GM1 on NBL‐W cell proliferation. NBL‐W cells cultured in DMEM containing 2% FCS were seeded into 96‐well plates at an initial concentration of 2 × 10⁴ cells/100 µL/well. Incremental concentrations of each ganglioside (5–1000 µm) were added to designated wells and incubated for 96 h. Data are expressed as absorbance (% of control). Each point represents the mean ± SEM of 3–4 replicates for each ganglioside concentration (n= 5 experiments).
EGF‐induced stimulation of EGFR tyrosine phosphorylation in NBL‐W cells
Concentration‐dependent parameters
Tyrosine phosphorylation of EGFR in NBL‐W cells was determined by Western blot before and after a 1‐min incubation with increasing concentrations of EGF. A phosphorylated protein band identical in molecular weight (175 kDa) to that of the EGFR positive control, human epidermoid carcinoma (A431), was present only in EGF‐stimulated NBL‐W cells. The threshold concentration of EGF required to initiate detectable phosphorylation of EGFR was 1.0 ng/ml with increasing responses observed at 10 and 100 ng/ml concentrations (Fig. 3a).
Figure 3.
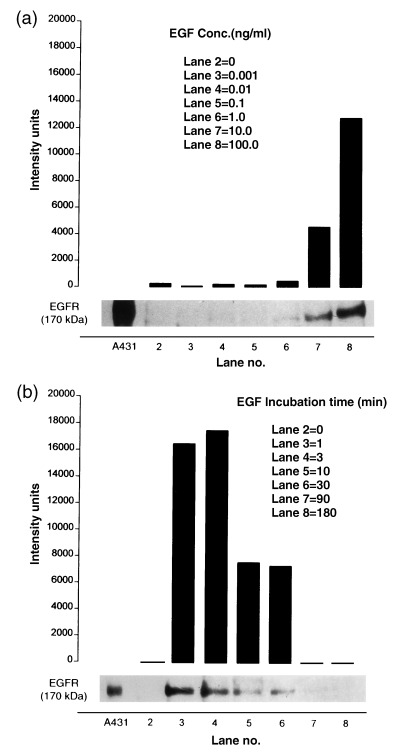
EGF‐induced EGFR phosphorylation in NBL‐W cells. (a) Concentration‐dependent response. NBL‐W cells (1 × 10⁶) cultured in serum‐free DMEM were incubated for 1 min with varying concentrations of EGF. EGFR phosphorylation was determined by Western blot and densitometric analysis. Lane 1: EGFR marker (A431 cell lysate); lane 2: NBL‐W (control, no EGF); lanes 3–8: EGF (0.001–100 ng/ml). (b) Time‐dependent responses. NBL‐W cells (1 × 10⁶) cultured in serum‐free DMEM were incubated with EGF (10 ng/ml) for periods ranging from 1 to 180 min. Western blots and densitometric analysis performed as above. Lane 1: EGFR marker (A431 cell lysate). Data in (a) and (b) are expressed as intensity units obtained by densitometric analysis.
Time‐dependent parameters
The relationship between duration of EGF stimulation and magnitude of EGFR phosphorylation was determined in NBL‐W cells (Fig. 3b). Cells were incubated with EGF (10 ng/ml) for periods ranging from 1 to 180 min. EGFR phosphorylation exceeding control levels was detected as early as 20 s after the addition of EGF (data not presented). The response to EGF reached a maximum after 1‐ and 3‐min incubations (Fig. 3b, lanes 3 and 4), declined to about 40% of the peak response following 10‐ and 30‐min incubations (Fig. 3b; lanes 5 and 6) and was barely detectable after a 90‐min incubation (Fig. 3b; lane 7).
Inhibition of EGF‐stimulated EGFR phosphorylation by gangliosides GT1B, GM3, GD1A and GM1: structure–activity relationships
The effect of each ganglioside on EGF‐stimulated EGFR phosphorylation was determined by Western blot analysis (Fig. 4). Cells preincubated with either GT1B, GM3, GD1A or GM1, at a concentration of 100 µm for 1 h, were then stimulated with EGF (100 ng/ml) for 1 min and compared with non‐stimulated cells incubated with ganglioside only (Fig. 4). The area under the curve for each immunoreactive EGFR tyrosine kinase band was determined by densitometry and expressed as intensity units. The ratio [area under curve (+ EGF)/area under curve (– EGF)] comparing EGFR phosphorylation in the presence and absence of EGF was used to assess the effects of gangliosides on EGF‐induced EGFR phosphorylation. In control cells stimulated with EGF in the absence of ganglioside, this ratio was 8.2. Cells preincubated with GT1B, GM3 and GD1A had ratios of 4.09, 4.87 and 6.70, respectively. The lower the ratio, the greater the inhibitory activity of each ganglioside. GM1 at the same concentration (100 µm) had a ratio of 8.3, which was similar to that of controls, and therefore exerted no inhibitory effect on EGF‐induced phosphorylation.
Figure 4.
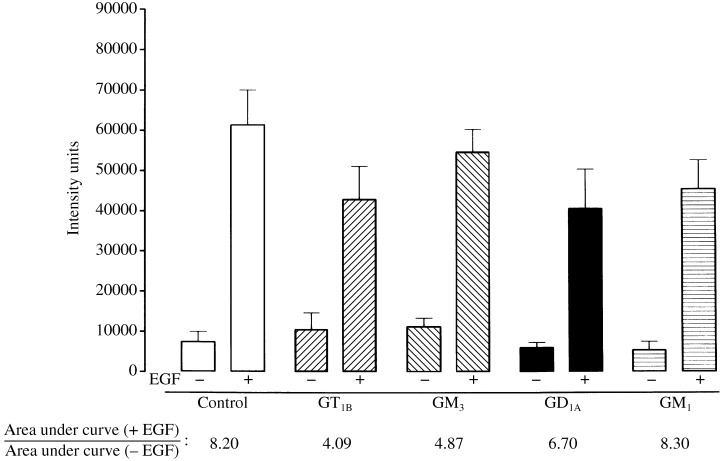
Inhibition of EGF‐induced EGFR phosphorylation in NBL‐W cells by gangliosides GD1A, GT1B, GM3 and GM1. NBL‐W cells (1 × 10⁶) were preincubated with each ganglioside (100 µm) for 1 h. The cells were then washed with serum‐free DMEM and incubated with (+) or without (–) EGF (10 ng/ml) for 1 min. Samples were processed and analysed for EGFR tyrosine phosphorylation by Western blot and densitometry. Intensity units are expressed as mean ± SEM of 3–4 experiments. Area under curve [EGFR phosphorylation (+ EGF)]/area under curve [EGFR phosphorylation (– EGF)] = AUC [EGFR Phos (+ EGF)]/AUC [EGFR Phos (– EGF)]. See Table 1 for complete description of ratio.
A limited structure–activity analysis revealed that the inhibitory potency of each ganglioside on NBL‐W cell proliferation (see Fig. 2) correlated positively with its suppression of EGFR phosphorylation (see Fig. 4) and the number of terminal N‐acetyl neuraminic acid (NANA) residues (Table 1). Gangliosides GT1B and GM3, which have terminal N‐acetyl neuraminic acid (NANA) moieties, were the most potent inhibitors of both EGFR phosphorylation and cell proliferation. However, GD1A, which also contains a terminal NANA residue and an internal galactose linkage with a single NANA moiety, differing from GT1B which has two, was less potent.
Table 1.
Relationship of ganglioside structure to inhibition of cell proliferation and EGFR phosphorylation
| Ganglioside | MW | Structure | IC50 a | AUC [EGFR Phos (+ EGF)]/ b AUC [EGFR Phos (– EGF)] |
|---|---|---|---|---|
| GT1B | 2129 | Cer‐Glc‐Gal‐Gal‐NAc‐Gal‐NANA NANA NANA | 117 ± 26 | 4.09 |
| GM3 | 1236 | Cer‐Glc‐Gal‐NANA | 255 ± 29 | 4.87 |
| GD1A | 1838 | Cer‐Glc‐Gal‐Gal‐NAc‐Gal‐NANA NANA | 425 ± 44 | 6.7 |
| GM1 | 1547 | Cer‐Glc‐Gal‐Gal‐NAc‐Gal NANA | not detectable | 8.3 |
IC50: ganglioside concentration (mean ± SEM) causing 50% inhibition of cell proliferation.
AUC [EGFR phosphorylation (+ EGF)]/AUC [EGFR phosphorylation (– EGF)]: represents fold increase in EGFR phosphorylation induced by EGF stimulation (+ EGF) above control (– EGF) in NBL‐W cells following a 1 h incubation with each ganglioside. Area under curve (AUC) expressed as intensity units.
Discussion
Cells derived from a common embryonic lineage may have widely differing, and in some cases, diametrically opposed responses to the same growth factor. For example, proliferation of the epidermoid carcinoma cell line (A431) has been reported to be either stimulated (Kawamoto et al. 1983) or inhibited (Barnes 1982; Panaretto et al. 1984) by EGF. Similarly, the response of human neuroblastoma cells to specific growth factors does not follow a predictable pattern. Thus, β‐FGF, IGF‐I and NGF have been shown to stimulate the proliferation of IMR‐32 human neuroblastoma cells, whereas EGF exerts no effect on this cell line (Rabinovsky et al. 1992). In contrast, EGF can not only increase cell proliferation rate, but also induce differentiation in some human neuroblastoma cells (Suardet et al. 1989). Whether this is a reflection of cell line heterogeneity in the allosteric regulation of EGFR‐associated tyrosine kinase remains a matter of conjecture (Schlessinger 1986).
The present study has demonstrated that EGF induces both EGFR tyrosine phosphorylation and cell proliferation in the human neuroblastoma cell line NBL‐W, which is N‐myc amplified. The stimulatory effect of EGF was greatest in cells that had been cultured in DMEM supplemented with low foetal calf serum concentrations (2%) or in serum‐free media. Earlier studies with the human epidermal carcinoma cell line A431 had shown that EGF‐stimulated EGFR tyrosine phosphorylation was associated with an increase in cell proliferation (Kawamoto et al. 1983). The downstream signalling cascade activated by EGF‐induced EGFR tyrosine phosphorylation suggests that this event is also causally related to the increased cell proliferation observed in neuroblastoma cells. It is important to note, however, that discordance between these two processes may occur. In other studies with NBL‐W cells, we showed that complete inhibition of EGF‐stimulated EGFR tyrosine kinase activity by the highly selective inhibitor 4‐(3‐bromoanilino)6‐7‐dimethoxy‐quinazoline (PD‐153035) occurred at 1.0 m. However, this concentration did not suppress NBL‐W cell proliferation significantly (Mirkin et al. 1998).
Data demonstrating that gangliosides can act at sites other than EGFR‐specific tyrosine kinase are summarized below.
-
1
Ganglioside‐induced suppression of protein kinase C (Kiguchi et al. 1986; Hannun & Bell 1987) and other central nervous kinases (Chan 1988) has been reported. GM1, GD1A, and GT1B, but not GM3, can inhibit PDGF‐induced activation of PDGF tyrosine kinase (Yates et al. 1995). FGF‐stimulated growth of baby hamster kidney fibroblasts was inhibited by GM3 (Bremer & Hakomori 1982).
-
2
Decreasing cellular ganglioside synthesis and concentration by inhibiting glucosylceramide synthase activity did not alter the response of human neuroblastoma cells (LAN‐5) to retinoic acid or NGF, which induces neurite extrusion in these cells (Li & Ladisch 1997). Such findings raise questions regarding the physiological role of gangliosides as modulators of cellular differentiation and proliferation.
-
3
Receptor–receptor interactions are essential for the EGF‐dependent activation of EGFR tyrosine kinase and gangliosides are presumed to antagonize receptor dimerization (Schlessinger 1988). However, it has been reported that GM3 can directly inhibit EGFR tyrosine phosphorylation, independent of any receptor–receptor interaction (Zhou et al. 1994). Additional evidence of non‐specificity of ganglioside action is provided by the report of Van Brocklyn et al. (1993) showing that PDGF receptor dimerization is also inhibited by glycosphingolipids in NG108 neuroblastoma cells. Collectively, the data summarized above suggest that gangliosides may exert their growth‐inhibiting activities at receptor and/or enzymatic sites other than the EGFR or its associated tyrosine kinase.
Our laboratory has previously demonstrated that GM3 inhibits C‐1300 murine neuroblastoma cell proliferation in tissue culture and that the foetal calf serum concentration in the culture medium modulates this response (Zhang & Mirkin 1995). Since NBL‐W cells were more responsive to EGF in DMEM containing 2% foetal calf serum, when compared to 10% foetal calf serum, this concentration of foetal calf serum was selected for all cell proliferation experiments. All studies of EGFR tyrosine kinase phosphorylation were performed with intact cells, rather than disrupted cell membranes, based on the view that the former model represents a more integrated biological system in which to assess the respective effects and interactions of EGF, EGFR and gangliosides.
To determine whether the inhibitory effect of gangliosides on EGF‐stimulated NBL‐W cell proliferation correlated with the suppression of EGFR tyrosine phosphorylation, Western blot analyses were performed on cells that had been preincubated with either GT1B, GM3, GD1A or GM3. Confirmation that the phosphorylated 170–175 kDa protein band, identified after incubation of NBL‐W cells with EGF, represented EGFR was obtained by immunoprecipitation with an anti‐EGFR monoclonal antibody (data not presented). The electrophoretic mobility pattern of the immunoprecipitated EGFR was identical to that of the A431 epidermal carcinoma cell, which served as the positive EGFR control.
Phosphorylation of EGFR was significantly decreased after a 1 h incubation of NBL‐W cells with each ganglioside and subsequent stimulation with EGF. While the relative potency of each ganglioside differed, a positive correlation between inhibition of cell proliferation and suppression of EGF‐induced EGFR phosphorylation was observed. The ranking of each ganglioside, based on its IC50 for inhibition of NBL‐W cell proliferation, was (in decreasing order of potency) GT1B > GM3 > GD1A > GM1 (Fig. 2), which was identical to their respective potencies in suppressing EGFR tyrosine phosphorylation (Fig. 4).
A limited analysis of the relationship between chemical structure and activity for each ganglioside revealed that glycophospholipids containing a terminal N‐acetyl neuraminic acid (NANA) moiety linked to the external galactose, namely GT1B, GM3, and GD1A, inhibited cell proliferation. GD1A and GT1B, which also have one and two N‐acetyl neuraminic acid residues linked to their internal galactose, differed markedly in their inhibitory effects on cell proliferation and EGFR phosphorylation, respectively (Table 1). The relative inactivity of GM1 is consistent with previous reports showing it to be a poor inhibitor of EGFR phosphorylation in A431 cell membranes (Bremer et al. 1986). However, it has been demonstrated that this ganglioside can induce neuritogenesis in murine neuroblastoma cells (neuro‐2 A), presumably by mimicking the activity of nerve growth factor (Cannela et al. 1988). Perhaps GM1 is unable to exert any effect on NBL‐W cells due to an absence of NGF receptors, activation of which would presumably lead to differentiation and decreased cell proliferation.
This investigation has revealed a positive correlation between the inhibition of EGF‐induced EGFR phosphorylation and suppression of cell proliferation in human neuroblastoma cells by gangliosides. It seems likely that the mechanisms underlying these responses and the specificity of gangliosides for a particular growth factor receptor or kinase subunit may be cell‐type specific and involve a multiplicity of target sites. Further investigation is warranted if definitive understanding of the biological role of gangliosides as modulators of tumour cell proliferation is to be achieved.
Acknowledgements
This investigation was partially supported by grants‐in‐aid to Bernard L. Mirkin from the John W. Anderson Foundation, the Medical Research Institute Council, the Coleman Research Endowment and the William G. Swartchild Jr. Distinguished Research Professorship. The authors wish to thank Susan L. Cohn, M.D. for providing the human neuroblastoma cell line (NBL‐W). The excellent assistance and inexhaustible patience of Ms. Roberta Gerard in preparation of the manuscript is gratefully acknowledged.
References
- Barnes DWJ (1982) Epidermal growth factor inhibits growth of A431 human epidermoid carcinoma in serum‐free cell culture. Cell Biol. 35, 1. [DOI] [PMC free article] [PubMed] [Google Scholar]
- Berridge MV, An ST, McCoy KD, Wang R. (1996) The biochemical and cellular basis of cell proliferation assays that use tetrazolium salts. Biochemica 35, 14. [Google Scholar]
- Bremer EG, Hakomori S (1982) GM3 ganglioside induces hamster fibroblast growth inhibition in chemically‐defined medium: Ganglioside may regulate growth factor receptor function. Biochem. Biophys. Res. Commun. 35, 711. [DOI] [PubMed] [Google Scholar]
- Bremer EG, Schlessinger J, Hakomori S (1986) Ganglioside‐mediated modulation of cell growth: Specific effects of GM3 on tyrosine phosphorylation of the epidermal growth factor receptor. J. Biol. Chem. 35, 2434. [PubMed] [Google Scholar]
- Cannela MS, Roiseu FJ, Ogawa T, Sugimoto M, Ledeen RW (1988) Comparison of epi‐GM3 with GM3 and GM1 as stimulators of neurite outgrowth. Dev. Brain Res. 35, 137. [DOI] [PubMed] [Google Scholar]
- Chan K‐FJ (1988) Ganglioside‐modulated protein phosphorylation: partial purification and characterization of a ganglioside‐inhibited protein kinase in brain. J. Biol. Chem. 35, 568. [PubMed] [Google Scholar]
- Cohn SL, Herst CV, Maurer HS, Rosen ST (1987) N‐myc amplification in an infant with stage IVS neuroblastoma. J. Clin. Oncol. 35, 1441. [DOI] [PubMed] [Google Scholar]
- Eggens I, Fendersion B, Toyokuni T, Dean B, Stroud M, Hakomori S (1989) Specific interaction between Lex and Lex determinants. A possible basis for cell recognition in preimplantation embryos and in embryonal carcinoma cells. J. Biol. Chem. 35, 9476. [PubMed] [Google Scholar]
- Gill GN, Lazar CS (1981) Increased phosphotyrosine content and inhibition of proliferation in EGF‐treated A431 cells. Nature 35, 305. [DOI] [PubMed] [Google Scholar]
- Hanai N, Nores GA, Macleod C, Torres‐Mendez CR, Hakomori S (1988) Ganglioside‐mediated modulation of cell growth: specific effects of GM3 and lyso‐GM3 in tyrosine phosphorylation of the epidermal growth factor receptor. J. Biol. Chem. 35, 10915. [PubMed] [Google Scholar]
- Hannun YA, Bell RM (1987) Lysosphingolipids inhibit protein kinase C: implications for the sphingolipidoses. Science 35, 670. [DOI] [PubMed] [Google Scholar]
- Kawamoto T, Sato JD, Le A, Polikoff J, Sato GH, Mendelsohn J (1983) Growth stimulation of A431 cells by epidermal growth factor: identification of high‐affinity receptors for epidermal growth factor by an anti‐receptor monoclonal antibody. Proc. Natl Acad. Sci. USA 35, 1337. [DOI] [PMC free article] [PubMed] [Google Scholar]
- Kiguchi K, Henning‐Chubb C, Huberman E (1986) Alteration in glycosphingolipid pattern during phorbol‐12‐myristate‐13‐acetate‐induced cell differentiation in human T‐lymphoid leukemia cells. Cancer Res. 35, 3027. [PubMed] [Google Scholar]
- Ladisch S (1987) Tumor gangliosides. Adv. Pediatr. 35, 45. [PubMed] [Google Scholar]
- Ledeen RW, Yu RK (1982) Gangliosides: Structure, isolation, and analysis. Meth. Enzymol. 35, 139. [DOI] [PubMed] [Google Scholar]
- Li R., Ladisch S (1997) Inhibition of endogenous ganglioside synthesis does not block neurite formation by retinoic acid treated neuroblastoma cells. J. Biol. Chem. 35, 1349. [DOI] [PubMed] [Google Scholar]
- Mirkin BL, Zhang C, Clark S (1998) Effect of EGF‐specific tyrosine kinase (TK) inhibitor (PD153035) on proliferation and EGF‐receptor (EGFR) phosphorylation of human neuroblastoma (NBL‐W) cells. Proc. Am. Assoc. Cancer Res. 35, 315. [Google Scholar]
- Nojiri H, Kitagawa S, Nakamura M, Kirito K, Enomoto Y, Saito M (1988) Neolacto‐series gangliosides induce granulocytic differentiation of human promyelocytic leukemia cell line HL‐60. J. Biol. Chem. 35, 7443. [PubMed] [Google Scholar]
- Nojiri H, Takaku F, Terui Y, Miura Y, Saito M (1986) Ganglioside GM3: an acidic membrane component that increases during macrophage‐like cell differentiation can induce monocytic differentiation of human myeloid and monocytoid leukemic cell lines HL‐60 and U937. Proc. Natl Acad. Sci. USA 35, 782. [DOI] [PMC free article] [PubMed] [Google Scholar]
- Paller AS, Arnsmeier SL, Alvarez‐Franco M, Bremer EG (1993) Ganglioside GM3 inhibits the proliferation of cultured keratinocytes. J. Invest. Dermatol. 35, 841. [DOI] [PubMed] [Google Scholar]
- Panaretto BA, Leish Z, Moore GPM, Robertson DM (1984) Inhibition of DNA synthesis in dermal tissue of merino sheep treated with depilatory doses of mouse epidermal growth factor. J. Endocrinol. 35, 25. [DOI] [PubMed] [Google Scholar]
- Rabinovsky ED, Le WD, McManaman JL (1992) Differential effects of neurotrophic factors on neurotransmitter development in the IMR‐32 human neuroblastoma cell line. J. Neuroscience 35, 171. [DOI] [PMC free article] [PubMed] [Google Scholar]
- Rebbaa A, Hurh J, Yamamoto H, Kersey DS, Bremer E (1996) Ganglioside GM3 inhibition of EGF receptor mediated signal transduction. Glycobiology 35, 399. [DOI] [PubMed] [Google Scholar]
- Schengrund CL, Shochat SJ (1988) Gangliosides in neuroblastoma. Neurochem. Pathol. 35, 189. [DOI] [PubMed] [Google Scholar]
- Schlessinger J (1986) Allosteric regulation of epidermal growth factor receptor kinase. J. Cell Biol. 35, 2067. [DOI] [PMC free article] [PubMed] [Google Scholar]
- Schlessinger J (1988) Trends biochem. Signal transduction by allosteric receptor ologomeriation. Science 35, 443. [DOI] [PubMed] [Google Scholar]
- Spiegel S, Fishman PH (1987) Gangliosides as bimodal regulators of cell growth. Proc. Natl Acad. Sci. USA 35, 141. [DOI] [PMC free article] [PubMed] [Google Scholar]
- Suardet L, Gross N, Gaide AC, Beck D, Eliason JF (1989) Epidermal growth factor responsiveness of a new human neuroblastoma cell line. Int. J. Cancer 35, 661. [DOI] [PubMed] [Google Scholar]
- Svennerholm L, Bostrom K, Fredman P, Mansson JE, Rosengren B, Rynmark BM (1989) Human brain gangliosides: developmental changes from early fetal stage to advanced age. Biochem. Biophys. Acta 35, 109. [DOI] [PubMed] [Google Scholar]
- Van Brocklyn J, Bremer EG, Yates AJ (1993) Gangliosides inhibit PDGF‐stimulated receptor dimerization in human glioma U‐1242 MG and Swiss 3T3 cells. J. Neurochem. 35, 371. [DOI] [PubMed] [Google Scholar]
- Yasue S, Handa S, Miyagawa J, Inoue A, Hasegawa A, Yamakawa T (1978) Difference in form of sialic acid in red blood cell glycolipids of different breeds of dogs. J. Biochem. 35, 1101. [DOI] [PubMed] [Google Scholar]
- Yates AJ, Sagr HE, Van Brocklyn J (1995) Ganglioside modulation of the PDGF receptor. J. Neuro-Oncol. 35, 65. [DOI] [PubMed] [Google Scholar]
- Zhang C, Mirkin B (1995) Inhibitory action of ganglioside GM3 on murine neuroblastoma cell proliferation: modulation effect of fetal calf serum. Anticancer Res. 35, 739. [PubMed] [Google Scholar]
- Zhou Q, Hakomori S, Kitamura K, Igarashi Y (1994) GM3 directly inhibits tyrosine phosphorylation and de‐N–acetyl‐GM3 directly enhances serine phosphorylation of epidermal growth factor receptor, independently of receptor–receptor interaction. J. Biol. Chem. 35, 1959. [PubMed] [Google Scholar]