

Abstract
Abstract. Objective: While it is common practice to culture cells in the presence of ambient oxygen (~21% O2), O2 level observed in the physiological environment is often much lower. Previous efforts to culture a variety of different stem cells, including muscle precursor cells (MPC), under O2 conditions that better mimic in vivo conditions have resulted in enhanced proliferation. In the present study, we hypothesized that 20% O2 in culture represents a sufficient stimulus to cause increased expression of two key negative regulators of the cell‐cycle Cip/Kip family of cyclin‐dependent kinase inhibitors, p21Cip1 and p27Kip1, in MPCs. Materials and methods: MPCs were isolated from Fischer 344 × Brown Norway F1 hybrid male rats and O2 was adjusted in culture using a tri‐gas incubator. Results: 5‐Bromo‐2′‐deoxyuridine incorporation, cell number and nuclear proliferating cell nuclear antigen expression were all decreased after 48 h culture in 20% O2, compared to 5% O2. Twenty per cent O2 had no effect on either p27Kip1 promoter activity or protein expression. Although p21Cip1 promoter activity remained unchanged between 5% and 20% O2, there were significant increases in both p21Cip1 mRNA and protein expression. Furthermore, 20% O2 caused an increase in p21Cip1 mRNA stability and p53 transcription factor activity. Conclusion: These findings are considered important because they reveal p21Cip1 as a critical regulatory protein that needs to be considered when interpreting proliferation data from MPCs studied in culture. In addition, O2‐dependent regulation of MPC proliferation is relevant to conditions, including sarcopenia, heart failure, cancer and muscular dystrophy, where increased oxidative stress exists.
INTRODUCTION
While the in vivo milieux of most stem cells have subatmospheric oxygen (O2) concentrations (Chow et al. 2001; Csete 2005), the majority of stem cell culture research is performed under ambient, or supraphysiological, O2 levels. In skeletal muscle, the resident stem cells, or muscle precursor cells (MPC), are a heterogeneous population of cells that exist predominantly as satellite cells, which are wedged between the plasmalemma and the basal lamina (Mauro 1961), and other progenitors with myogenic potential, located in the interstitial spaces (Tamaki et al. 2002). MPCs are required for skeletal muscle regeneration, hypertrophy and regrowth throughout life (Schultz & McCormick 1994; Seale et al. 2000; Adams et al. 2002). Estimates of physiological O2 levels observed in the interstitial space of skeletal muscle range from 10.0 to 28.8 mmHg (Shibata et al. 2006). However, traditional cell culture incubators are buffered with 5–10% CO2 and the remaining gas is supplied with ambient air. Therefore, 95% ambient air and 5% CO2 cell‐culture incubators at sea level contain ~142 mmHg O2, which is > 100 mmHg more than experienced by MPCs in vivo.
Recently, Csete (2005) commented that virtually all stem cells cultured in lower, physiological O2 levels proliferate more than in traditional 20% O2 environments; however, mechanisms regulating this effect on proliferation are insufficiently understood. Such information is vital for interpretations of treatments that alter proliferation in MPCs cultured in ambient air and lower, physiological level O2. For example, such medical conditions might include sarcopenia, heart failure, cancer and muscular dystrophy, where increased oxidative stress exists in skeletal muscle (Rando 2002; Reid et al. 2005). In skeletal muscle, potential outcomes of increased oxidative stress include decreased contractile force, altered signalling pathways involved in atrophy/hypertrophy and MPC dysfunction (Renault et al. 2002; Reid et al. 2005; Westerkamp & Gordon 2005).
Cell‐cycle progression and cell proliferation are regulated by a restriction point, which is the determining step for the cell to progress from the first gap phase (G1) to DNA synthesis, or S phase. The restriction point is regulated in large part by a balance of positive and negative regulators. Positive regulators include a variety of cyclins (D‐type, E, A and B) and cyclin‐dependent kinases (cdk). Negative regulators include two members of the Cip/Kip (cyclin‐dependent kinase interacting protein/kinase inhibitory protein) family of cdk inhibitors, p21Cip1 and p27Kip1. p21Cip1 and p27Kip1 share significant homology and have been shown to bind and inhibit cyclin–cdk complexes (Sherr & Roberts 1995), preventing progression to the S phase.
The purpose of the present experiment was to investigate the effects of two different levels of O2 on the expression of two key negative regulators of cell‐cycle progression. Specifically, we hypothesize that 20% O2 in MPC culture, which is a sufficient stimulus to induce a decrease in proliferation, will increase the expression of the cyclin‐dependent kinase (cdk) inhibitors p21Cip1 and p27Kip1 in MPCs isolated from skeletal muscle.
MATERIALS AND METHODS
Animals
All procedures were approved by the Institutional ‘Animal Care and Use’ Committee at the University of Missouri‐Columbia. Three‐ to 5‐month‐old, Fischer 344 × Brown Norway F1 hybrid, male rats were obtained from the National Institute on Ageing. Animals were housed at 21 °C on a 12‐h light:dark cycle and were allowed free access to food and water. At the time of sacrifice, animals were given an intraperitoneal injection of ketamine (80 mg/kg), xylazine (10 mg/kg) and acepromazine (4 mg/kg).
Muscle precursor cell isolation and culture
Muscle precursor cell isolation was modified from Allen et al. (1997) as described (Lees et al. 2006). Briefly, cells isolated from the gastrocnemius, plantaris and soleus muscles by pronase digestion were preplated first for 2 h, and then for 24 h on tissue culture‐treated 150‐mm plates. After the 24‐h preplate, cells were seeded on to Matrigel‐coated (BD Biosciences, San Jose, CA, USA) 150‐mm plates (0.1 mg/mL Matrigel, 60 min at 37 °C) and were cultured for 3 days in growth media (GM, 20% foetal bovine serum, 100 units/mL penicillin, 100 µg/mL streptomycin, 40 µg/mL gentamicin in Ham's F‐10). After 3 days, the cells reach ~80% confluence. Cells were then passaged once and were seeded on to appropriate Matrigel tissue culture plates. Greater than 95% desmin‐ and MyoD‐positive cells are obtained using this isolation protocol (data not shown). As media depth is an important concern for 5% O2 culture conditions (Tokuda et al. 2000), 1.5 mL of GM was used for experiments carried out in 6‐well culture plates (25 000 cells/well) and 10 mL of GM was used for experiments carried out in 100 mm culture plates (150 000 cells/well), so that media depth was similar for both. Cells were initially cultured in a humidified incubator with 5% O2, 5% CO2 and 90% N2 (5% O2) at 37 °C, which is defined as the control O2 level to best represent physiological levels. At the time of passage, cells from each animal were seeded and cultured in both 5% O2 (control) and a second humidified incubator with ambient O2 and 5% CO2 (20% O2) at 37 °C, which represented increased oxygen‐induced cell stress (Pfau et al. 2004; Hansen et al. 2007). For experiments that included four O2 levels (5%, 10%, 15% and 20%), MPCs from passages 1 and 2 were used.
DNA constructs, transfection and promoter activity
Rat p27Kip1 promoter (–4362 to +421 bp) was cloned from genomic DNA isolated from Fischer 344 × Brown Norway F1 hybrid rat skeletal muscle by polymerase chain reaction (PCR), using the primers, 5′‐CTTCACGCGTAGTTGGGGCTCATAATTGCCCTGTG‐3′ and 5′‐CACGTTAGATCTCTTCCTCCCCGGGCGGGTGTGGAC‐3′. The cloned promoter was then subcloned into the pGL3‐basic firefly luciferase reporter vector (Promega, Madison, WI, USA). Cloned p27Kip1 promoter sequence was verified by DNA sequencing using an Applied Biosystems 3730 DNA Analyser and Applied Biosystems Prism BigDye terminator cycle sequencing chemistry (Applied Biosystems, Foster City, CA, USA). The p21Cip1/Waf1 promoter/reporter construct (–2340 to +75 bp cloned from human genomic DNA and subcloned into the pGL2 vector) was a kind gift from Dr. Kimitoshi Kohno (University of Occupational and Environmental Health, Kitakyushu, Japan). The pp53 cis‐reporter consists of a p53‐responsive element (GAACATGTCTAAGCATGCTG) located upstream of the minimal TA promoter, the TATA box from the herpes simplex virus thymidine kinase promoter, which drives the firefly luciferase gene (pp53‐TA‐Luc, catalogue number 631914, Clontech, Mountain View, CA, USA). Using the pp53 construct provides a measurement of p53 transcription factor activity under the two different O2 levels. Renilla luciferase reporter vector, used as an internal control promoter, containing the herpes simplex virus thymidine linase promoter (pRL‐TK; Promega) was cotransfected in each experiment in order to normalize for transfection efficiency. Transfections were carried out immediately after the cells were seeded in antibiotic‐free GM using Fugene® 6 (Roche Applied Science, Indianapolis, IN, USA), following the manufacturer's instructions. A total of 0.7 µg of DNA were used for each transfection, on 6‐well cell culture plates at a firefly:Renilla ratio of 20 : 1. At 24 and 48 h time points after seeding, cells were lysed using passive lysis buffer (Promega) and were stored at –80 °C. Firefly and Renilla luminescence were measured using the Dual‐Luciferase® Reporter Assay System (Promega) on a Veritas™ microplate luminometer (Turner BioSystems, Sunnyvale, CA, USA).
RNA isolation and real‐time PCR
Samples were lysed at 24 and 48 h post‐seeding in RLT lysis buffer with 1%β‐mercaptoethanol and were passed through a QIAshredder (Qiagen, Valencia, CA, USA). RNA purification was performed with on‐column DNase I digestion using the RNeasy® micro kit (Qiagen) according to the manufacturer's instructions. RNA was quantified spectrophotometrically by measuring absorbance at 260 nm and purity was assessed by measuring the ratio of absorbance at 260 nm and 280 nm. RNA integrity was verified by denaturing agarose electrophoresis and ethidium bromide staining. RNA was reverse transcribed using SuperScript™ III first‐strand cDNA synthesis system (Invitrogen, Carlsbad, CA, USA) with random hexamer primers.
p21Cip1 mRNA levels were determined via real‐time quantitative PCR using TaqMan Universal PCR Master Mix and an ABI Prism 7000 (Applied Biosystems). Sequences for the p21Cip1 primers and 6‐FAM/MGB probe were as follows: 5′‐CAAGCGCCGATTGGTCTT‐3′ (forward primer), 5′‐CCTCCCGTGGGCACTTC‐3′ (reverse primer) and 5′‐TGCAAGAGAAAGCC‐3′ (probe). Specificity of the primer pair was evaluated using agarose gel electrophoresis; only a single product of appropriate size was observed. 18S rRNA was also determined in each sample as the endogenous control (product number 4319413E, Applied Biosystems). Twenty‐five nanograms of cDNA for each sample was used. Standard curves of both p21Cip1 and 18S rRNA were run to determine amplification efficiency. For p21Cip1 mRNA decay measurements, 5 µg/mL actinomycin D (ActD) was added to inhibit transcription (Chen et al. 1995). Plates were returned to the incubator with lids ajar to allow for rapid equilibration of O2 for 3 and 6 h; time‐zero samples were harvested at the time ActD was added. p21Cip1 mRNA half‐lives were estimated using exponential decay calculations with SigmaPlot (10.0). Data analysis was performed using the comparative method (ΔCT) and results are reported as fold change. Variability was determined using the fold increase of individual samples and then calculating the standard error.
Cell proliferation
To evaluate cell proliferation, 5‐bromo‐2′‐deoxyuridine (BrdUrd) incorporation was examined. Briefly, 10 000 cells were seeded on Matrigel‐coated, 2‐well Permanox Lab‐Tek chamber slides (Nalg Nunc International, Rochester, NY, USA). Cells were incubated for 60 min with 10 µm BrdUrd, beginning 47 h after they were seeded. Cells were fixed with 2% paraformaldehyde in phosphate‐buffered saline (PBS) (pH 7.4) for 10 min at room temperature, then were washed and stored in PBS (4 °C) until needed. For immunodetection of BrdUrd, cells were incubated with 1 N HCl for 30 min at 45 °C then neutralized with 3 washes of 0.1 M sodium borate (pH 8.5) for 10 min. After a 20‐min incubation in blocking buffer (5% normal goat serum in 0.25% Triton X‐100 PBS) to suppress non‐specific binding, cells were incubated with monoclonal antibody raised against BrdUrd (5 µg/mL, Roche Applied Sciences) in 0.1% Triton X‐100 PBS with 1.5% normal goat serum. After 3 washes with PBS, cells were incubated for 60 min with goat antimouse Alexa Fluor 594 (1 : 200, Invitrogen‐Molecular Probes, Carlsbad, CA, USA) in PBS with 1.5% normal goat serum. Nuclei were counterstained using 4′,6‐diamidino‐2‐phenylindole (DAPI) (Invitrogen‐Molecular Probes). Greater than 500 cells per chamber, over several fields of view, were counted and percentages of BrdUrd‐positive cells were assessed. For comparisons between 5%, 10%, 15% and 20% O2, BrdUrd incorporation was determined using flow cytometry. Briefly, after the 60 min pulse, cells were washed twice with PBS, removed from the plates, centrifuged at 500 g for 5 min, and were fixed with ice‐cold 70% ethanol. DNA was acid‐denatured (2 N HCl, 30 min) and incorporated BrdUrd was detected using a fluorescein‐conjugated monoclonal antibody raised against BrdUrd (5 µg/mL, Roche Applied Sciences) in PBS with 0.1% bovine serum albumin. Twenty thousand cells were analysed using a BD FACScan and CellQuest Pro software (BD, Franklin Lakes, NJ, USA).
Sample preparation
After 2 days in GM, cells were lysed with CelLytic lysis buffer (Sigma‐Aldrich, St. Louis, MO, USA) containing 1.04 mm AEBSF, 800 nm aprotinin, 20 µm leupeptin, 40 µm bestatin, 15 µm pepstatin A, 14 µm E‐64 and the phosphatase inhibitor cocktail 1 (P2850, Sigma‐Aldrich; a proprietary mix of cantharidin, bromotetramisole and microcystin LR used at 1 : 100 dilution). Cell lysates were then frozen and stored at –80 °C. Prior to protein quantification and subsequent Western blotting, cell lysates were thawed, and a small aliquot was removed for DNA quantification using the CyQUANT® Cell Proliferation Assay Kit (Invitrogen‐Molecular Probes). The remaining sample was then centrifuged at 12 000 g (4 °C) for 15 min, the supernatant was collected, protein concentration was determined using the Bradford assay, and samples were diluted in sodium dodecyl sulfate‐reducing buffer. Nuclear protein was isolated as described previously by Machida & Booth (2004) with protease inhibitors (1.04 mm AEBSF, 800 nm aprotinin, 20 µm leupeptin, 40 µm bestatin, 15 µm pepstatin A, and 14 µm E‐64) and the phosphatase inhibitor cocktail 1.
Western blots
Equal amounts of protein were loaded and separated on sodium dodecyl sulfate‐polyacrylamide gel electrophoresis and transferred to nitrocellulose membranes (Osmonics Inc., Minnetonka, MN, USA); these were stained with Ponceau S (Sigma‐Aldrich) to ensure equal loading. Proliferating cell nuclear antigen (PCNA) antibody was purchased from Cell Signalling Technology (Beverly, MA, USA), p21Cip1 antibody was obtained from Upstate (Lake Placid, NY, USA), and p27Kip1 (F‐8) antibody was acquired from Santa Cruz Biotechnology (Santa Cruz, CA, USA). HRP‐conjugated antirabbit immunoglobulin G and antimouse immunoglobulin G antibodies were purchased from Amersham Biosciences (Buckinghamshire, UK). Immunocomplexes were visualized with the Western Lightning® Chemiluminescence Reagent Plus (PerkinElmer, Boston, MA, USA) and were exposed to CL‐Xposure film (Pierce Biotechnology, Rockford, IL, USA) with exposure time adjusted to retain integrated optical densities within a linear and non‐saturated range. Signal bands were scanned utilizing a Personal Densitometer SI and quantified using ImageQuant software (Molecular Dynamics, Sunnyvale, CA, USA).
Statistics
Data are presented as mean ± SE. Sample sizes are indicated for each measurement in the figure legends, where n represents independent isolations from separate animals. Comparisons between 5% and 20% O2 samples were performed using one‐way anova repeated measurements. For promoter activities, comparisons between 5% and 20% O2 samples at 24 and 48 h were performed using two‐way anova repeated measurements. For mRNA samples, comparisons between 5% and 20% O2 were only completed within each time point (24 and 48 h) using one‐way anova repeated measurements. For comparisons between 5%, 10%, 15% and 20% O2, one‐way anova was used (SigmaStat version 3.1, SPSS Inc., Chicago, IL, USA). Significance was accepted at P ≤ 0.05.
RESULTS
As previously reported, primary MPCs cultured at lower, physiological O2 levels in cell culture, in this case 5% O2, exhibit increased cell proliferation. Cells were pulsed for 60 min with BrdUrd beginning 47 h after being seeded. Five per cent O2 increased the percentage of BrdUrd+ cells 2‐fold, compared to 20% O2 culture (45.5 ± 1.23% versus 22.7 ± 0.65%) (Fig. 1a,b; P ≤ 0.05). In addition, 5% O2 cell culture conditions were associated with 130% increased nuclear PCNA protein (Fig. 1c) (P ≤ 0.05). Furthermore, 5% O2 also resulted in 64% increase in DNA content after 48 h in culture, compared to cells isolated from the same animal at 20% O2 (Fig. 1d) (P ≤ 0.05). DNA content is an indicator of cell number and nuclear PCNA protein content is positively correlated with proliferating cells (Kurki et al. 1988). Taken together, these data indicate that 5% O2 culture causes an increase in MPC proliferation.
Figure 1.
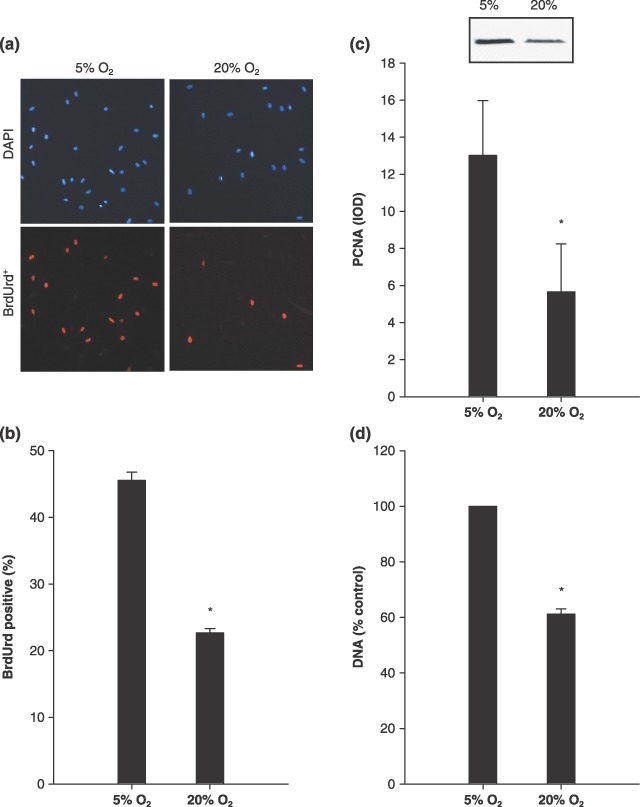
Muscle precursor cells (MPC) cultured at 5% O2 increased markers of proliferation. (a) BrdUrd, representative images of those MPCs cultured at 5% and 20% O2 that were labelled with 5‐bromo‐2′‐deoxyuridine (BrdUrd), positive cells (lower panels), and counterstained using 4′,6‐diamidino‐2‐phenylindole (DAPI) (upper panels). (b) BrdUrd, group mean data for the percentage of BrdUrd positive cells (n = 4). (c) Proliferating cell nuclear antigen (PCNA), Western blot analysis of nuclear protein, as well as group mean data (n = 4), which are presented as integrated optical density (IOD). (d) DNA, group mean data for the cellular DNA assay represented as relative to 5% O2 (n = 4). Increases in the percentage of BrdUrd‐positive cells, DNA and nuclear PCNA all indicate that MPC culture at 5% O2 increased proliferation, compared to culture at 20% O2. Data are presented as mean ± SE. * denotes P ≤ 0.05 compared to 5% O2.
Rat p27Kip1–4362 to +421 bp promoter region was cloned from genomic DNA and subcloned into a reporter construct expressing firefly luciferase. In order to test the rat p27Kip1 promoter construct, two different treatments were used to induce p27Kip1 expression. Both differentiation of MPCs and overexpression of Foxo3a in proliferating MPCs increased p27Kip1 expression as expected (data not shown) suggesting it is an active promoter. Then, in order to study the effects of O2‐induced reductions in MPC proliferation, we measured p27Kip1 expression in 5% and 20% O2 at 24 and 48 h. There were no significant differences for p27Kip1 promoter activity between 5% and 20% O2 at either 24 h or 48 h (Fig. 2a). Promoter activity data were normalized to Renilla luciferase expression. Furthermore, there was no significant difference in p27Kip1 protein expression, as measured by Western blot analysis (Fig. 2b). The p27Kip1 monoclonal antibody revealed a doublet at about 27 kDa; both bands were analysed together. It is possible that the upper band represents phosphorylated p27Kip1 (Sheng et al. 2005). There was no difference in either band when analysed separately (data not shown).
Figure 2.
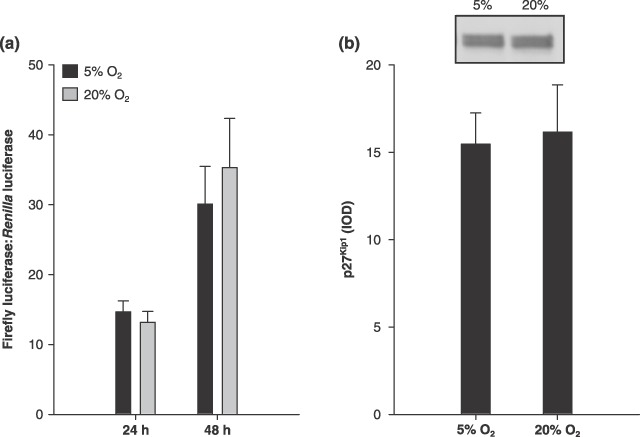
p27Kip1. Muscle precursor cells (MPC), cultured at 5% O2 did not affect p27Kip1 expression. (a) p27Kip1 promoter activity at 24 (n = 5) and 48 h after seeding (n = 6). Data are presented as the ratio of firefly:Renilla luminescence. (b) Representative lanes from the p27Kip1 Western blot, as well as group mean data (n = 4), which are presented as integrated optical density (IOD). Data are presented as mean ± SE.
Effects of O2 level in culture on p21Cip1 promoter activity and protein expression were also measured. Using the human (–2340 to +75 bp) p21Cip1 construct, no significant differences for p21Cip1 promoter activities were found between 5% and 20% O2 at either 24 h or 48 h (Fig. 3a). Changing the cells to low serum media in order to induce differentiation increased p21Cip1 expression as expected (data not shown), suggesting it is an active promoter. In contrast, there was a significant difference in p21Cip1 protein expression (Fig. 3b; P ≤ 0.05). p21Cip1 protein was 95% more in MPC culture at 20% O2, as compared to 5% O2.
Figure 3.
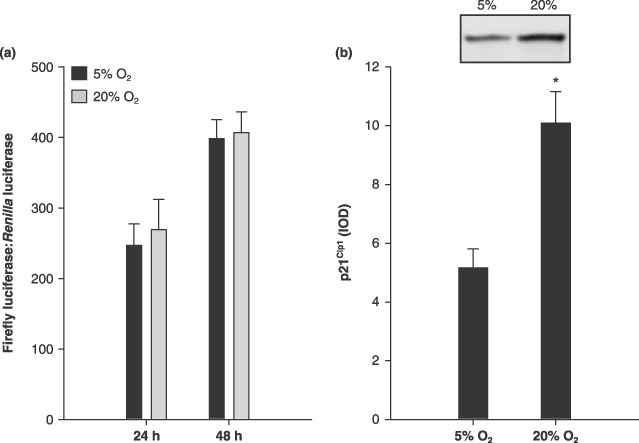
p21Cip1. Muscle precursor cells (MPC) cultured at 5% O2 increased p21Cip1 protein. (a) p21Cip1 promoter activity at 24 and 48 h after seeding (n = 6). Data are presented as the ratio of firefly:Renilla luminescence. (b) Representative lanes from the p21Cip1 Western blot, as well as group mean data (n = 4), which are presented as integrated optical density (IOD). Data are presented as mean ± SE. * denotes P ≤ 0.05 compared to 5% O2.
Since p21Cip1 protein was ~2‐fold more in 20% O2, while p21Cip1 promoter activity remained unchanged in 20% O2, we then hypothesized that p21Cip1 mRNA would be increased. Real‐time quantitative PCR revealed 1.8‐ and 2.7‐fold increases in p21Cip1 mRNA in 20% O2 at 24 and 48 h, respectively (Fig. 4; P ≤ 0.05). We next hypothesized that increased p21Cip1 expression may be regulated through increasing mRNA stability, so p21Cip1 mRNA decay was measured. MPCs were seeded and cultured in either 5% or 20% O2 for 42 h. Then, ActD was added in order to inhibit transcription, and RNA was harvested at 0, 3 and 6 h time points. Decay was measured by plotting decrease in p21Cip1 mRNA as measured by real‐time quantitative PCR. By 6 h, 20% O2 levels resulted in a higher percentage of p21Cip1 mRNA remaining compared to 5% O2 (Fig. 5). Furthermore, estimated half‐lives of p21Cip1 mRNA were 6.1 and 10.6 h for 5% O2 and 20% O2, respectively. p21Cip1 mRNAs were normalized to 18S rRNA. 18S rRNA levels did not differ between O2 levels, nor did it decline during the mRNA decay assay. Together, these data indicate that 20% O2 increases p21Cip1 expression via increased p21Cip1 mRNA stability.
Figure 4.
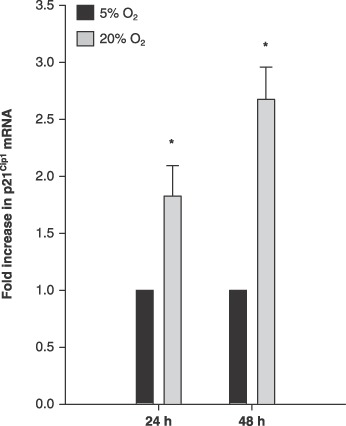
Muscle precursor cells (MPC) cultured at 5% O2 increased p21Cip1 mRNA. p21Cip1 mRNA levels were measured at 24 and 48 h after seeding (n = 6). p21Cip1 mRNA was measured using real‐time PCR and the data are presented as fold‐increases, as calculated using the comparative CT method. Data are normalized to 18S rRNA. Data are presented as mean ± SE. * denotes P ≤ 0.05 compared to 5% O2.
Figure 5.
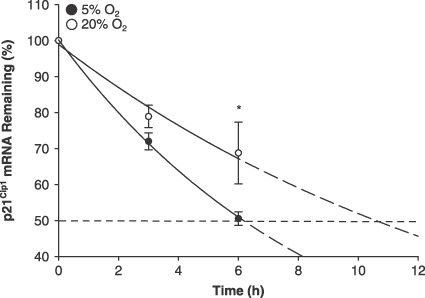
Muscle precursor cells (MPC) cultured at 5% O2 decreased p21Cip1 mRNA stability. MPCs were seeded and cultured in either 5% or 20% O2 for 42 h (n = 4). Actinomycin D was then added in order to inhibit transcription and RNA was harvested at 0, 3 and 6 h time points. Decay was measured by plotting decrease in p21Cip1 mRNA as measured by real‐time quantitative PCR. By 6 h, 20% O2 levels resulted in a higher percentage of p21Cip1 mRNA remaining compared to 5% O2. Solid lines represent the best fit exponential decay over the time points measured and dashed lines represent the extrapolated curve. Data are presented as mean ± SE. * denotes P ≤ 0.05 compared to 5% O2.
Because hyperoxia‐mediated p21Cip1 expression has been shown to be induced by both p53‐dependent (Helt et al. 2001) and independent mechanisms (Gorospe et al. 1998), we next hypothesized that 20% O2 would cause an increase in p53 transcription factor activity. To do this, we used the p53‐responsive element cis‐reporter (pp53), which contains a p53‐consensus binding site that allows detection of changes in p53 DNA binding through luciferase reporter gene expression. There were 40.6% and 56.8% increases in p53 responsive element cis‐reporter (pp53) activity at 24 and 48 h, respectively (Fig. 6; P ≤ 0.05). These data support a hypothesis that increased p21Cip1 expression could be mediated via a p53‐dependent mechanism in 20% O2, potentially acting post‐transcriptionally on p21Cip1 mRNA stability.
Figure 6.
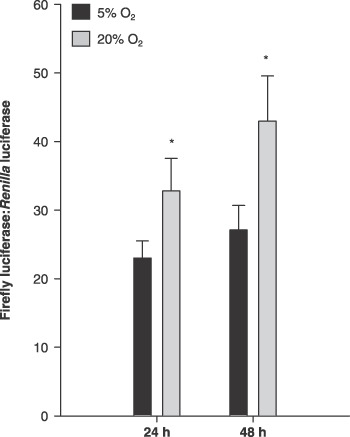
Muscle precursor cells (MPC) cultured at 5% O2 increased p53 transactivation. pp53 promoter activity at 24 and 48 h after seeding (n = 4). Data are presented as the ratio of firefly:Renilla luminescence. Data are presented as mean ± SE. * denotes P ≤ 0.05 compared to 5% O2.
As a follow‐up to approximate O2 percentage showing the initial change, we measured cell proliferation and p21Cip1 mRNA for two intermediate O2 levels, 10% and 15%, in addition to 5% and 20% O2. BrdUrd incorporation decreased with increasing O2 in culture and was significantly different at 15% and 20% O2, compared to 5% O2 (Fig. 7a; P ≤ 0.05). p21Cip1 mRNA increased as O2 in culture increased and was significantly different at 10%, 15% and 20% O2, compared to 5% O2 (Fig. 7b; P ≤ 0.05).
Figure 7.
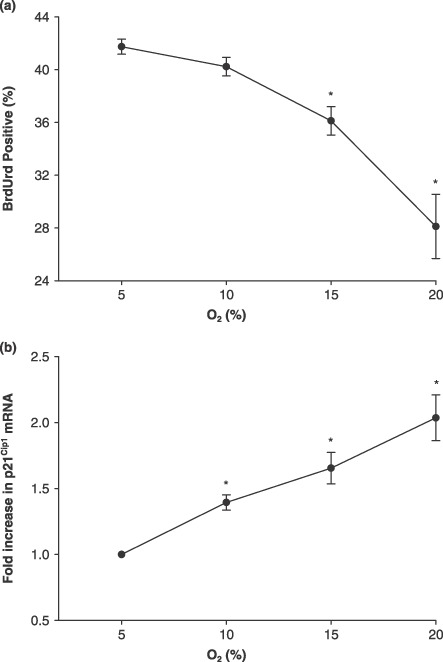
Muscle precursor cell (MPC) proliferation and p21Cip1 mRNA levels at 5%, 10%, 15% and 20% O2. (a) BrdUrd, group mean data for the percentage of BrdUrd‐positive cells measured using flow cytometry (n = 4). Cells were pulsed with BrdUrd for 60 min prior to being fixed. (b) p21Cip1 mRNA levels were measured using real‐time PCR and data are presented as fold‐increases, as calculated using the comparative CT method (n = 4). Data are normalized to 18S rRNA. Data are presented as mean ± SE. * denotes P ≤ 0.05 compared to 5% O2.
DISCUSSION
Previously, increased proliferation has been observed in stem cells isolated from brain, neural crest, bone marrow, trophoblast and skeletal muscle as a result of lower, physiological O2 levels in cell culture rather than atmospheric O2 (Csete 2005). In primary MPC cultures, 6% O2 levels increase proliferation (Csete et al. 2001). In the present study, decreased proliferation at 20% O2 in culture is not associated with any change in p27Kip1 expression compared to 5% O2. However, 20% O2 in culture caused increased p21Cip1 mRNA and protein levels. Increased p21Cip1 expression was unexpectedly not associated with an increase in p21Cip1 promoter activity; however, 20% O2 slowed p21Cip1 mRNA decay to an estimated half‐life of 10.6 h, compared to 6.1 h in 5% O2. All together, these data suggest that 20% O2 level in culture causes increased p21Cip1 mRNA stability as compared to 5% O2.
Traditionally, cell culture incubators are maintained with 5–10% CO2 and the remainder of the gas is comprised of room air (~21% O2, ~79% N2). However, these conditions often do not reflect O2 at the tissue level. As MPCs are anatomically located beneath the basal lamina of skeletal muscle fibres, consideration of the O2 gradient observed from the source of tissue O2 to the skeletal muscle fibre itself is briefly reviewed next. Partial pressure of O2 in rat arteries is ~100 mmHg (Gozal et al. 1998; Dunn et al. 1999; Lo et al. 2001; Shibata et al. 2006). Shibata et al. (2006) reported that pO2 dropped from 75 mmHg in first‐order arterioles to 46 mmHg in third‐order arterioles. Behnke et al. (2004) reported that mean microvascular O2 level in skeletal muscle of young rats is 33.8 mmHg. Measurements of skeletal muscle interstitial oxygen tensions are reported to be 28.8 mmHg within 20 µm and 10.0 mmHg when greater than 100 µm from third‐order arterioles (Shibata et al. 2001). In the current experiment, we used 5% O2 in one cell culture incubator, which corresponds to 35.7 mmHg, while we used ambient O2 in another incubator, which is estimated to be 142 mmHg.
In the present study, a 2‐fold increase in p21Cip1 protein and a 2.7‐fold increase in its mRNA were observed after 48 h in 20% O2 compared to 5% O2, while there was surprisingly no difference in p21Cip1 promoter activity. In hypoxia, HIF‐1α escapes O2‐dependent degradation and activates p21Cip1 transcription (Koshiji et al. 2004; Lim et al. 2006). Because we did not observe changes in p21Cip1 promoter activity and p21Cip1 protein was higher in 20% O2, compared to 5% O2, our data indicate that it is unlikely that 5% O2 causes hypoxia in our cells. p21Cip1 expression is known to be regulated not only transcriptionally (O’Reilly 2005), but also via protein degradation in both proteasome‐dependent (Bloom & Pagano 2004) and proteasome‐independent mechanisms (Li et al. 2007), as well as through mRNA stability (Gorospe et al. 1998; Shu et al. 2006). In the present study, we did not rule out the potential contribution of protein degradation in the regulation of p21Cip1 protein levels between 5% and 20% O2 levels in culture. However, our finding of no difference in p21Cip1 promoter/reporter activity, whereas p21Cip1 mRNA was increased by 2.7‐fold led us to hypothesize that O2‐mediated p21Cip1 expression was regulated via increased mRNA stability. When mRNA stability was tested, we found the estimated half‐life of p21Cip1 mRNA to be 74% longer in 20% O2 than in 5% O2. These findings are considered important, because they reveal p21Cip1 mRNA stability as a critical regulatory mechanism that needs to be considered when interpreting proliferation data from MPCs studied in culture. However, the mechanisms for stabilization of p21Cip1 mRNA by 20% O2 are poorly understood and various possibilities are considered next. Oxidative stress‐induced p21Cip1 expression generally acts via a p53‐dependent mechanism; however, p53‐independent pathways do exist (O’Reilly 2005). Interestingly, although it is widely accepted that p21Cip1 is regulated transcriptionally by p53, p21Cip1 mRNA stability has also been shown to be increased in a p53‐dependent manner in response to ultraviolet C irradiation (Gorospe et al. 1998). Moreover, it has been previously shown that cell culture at 20% O2 results in increased reactive oxygen species (ROS), compared to estimated physiological levels. Pfau et al. (2004) reported an approximate 2‐fold increase in ROS (using a redox‐sensitive dye) in macrophages in 20% O2 culture and Hansen et al. (2007) reported an approximate 1/3 increase in ROS in C2C12 myoblast cell line cultures in 20% O2, compared to 5% and 6% O2, respectively. Therefore, the hypothesis was tested that O2‐mediated p21Cip1 expression was associated with enhanced p53 activity. When the hypothesis was examined, 20% O2 levels in culture produced 50% greater pp53 activity, a plasmid that measures p53‐transcription factor‐mediated reporter activity. A similar report in immortalized pancreatic cells exists; increased p21Cip1 mRNA combined with no change in p21 promoter activity has been shown to be associated with increased p53 phosphorylation, which is an indicator of increased p53 activity (Donadelli et al. 2006). Recently, two RNA‐binding protein isoforms, RNPC1a and RNPC1b, which are targets of the p53 family, were reported to be required for maintaining stability of the basal and stress‐induced p21Cip1 transcript (Shu et al. 2006); thus, increased pp53 activity may be associated with post‐transcriptional, p53‐dependent regulation of p21Cip1 mRNA stability. p21Cip1 mRNA also has been reported to be directly stabilized in a p53‐independent manner by the RNA‐binding protein HuR (Wang et al. 2000; Giles et al. 2003) and poly(C)‐binding protein (Giles et al. 2003), while p21Cip1 mRNA decay is enhanced by AUF1 (Lal et al. 2004).
p27Kip1 expression is also sensitive to oxidative stress, including angiotensin II‐mediated ROS production (Hannken et al. 2000; Wolf et al. 2001) and a forkhead box O transcription factor‐dependent mechanism in response to H2O2 (Essers et al. 2005). However, in the present study, there was no difference in either p27Kip1 promoter activity nor protein in primary MPCs in response to 20% O2 levels in culture, compared to lower, physiological O2 levels. Independent regulation of p21Cip1 and p27Kip1 proteins allows for precise and specific control of cell cycle arrest, proliferation and differentiation and despite their significant homology, as they have been previously shown to be differentially regulated depending on the cell type and environmental regulator (Ilyin et al. 2003; Chkhotua et al. 2006). Our data support the notion that p21Cip1 expression is sensitive to the differential O2 levels used in the current study, whereas p27Kip1 promoter activity and protein expression remained unchanged.
In summary, it is important to understand the mechanisms that regulate MPC proliferation, as these cells are required for skeletal muscle repair/regeneration/regrowth. MPCs are sensitive to the level of O2 in cell culture (5% O2 versus 20% O2). In the present study, we found that 20% O2 caused a differential response of two key cell‐cycle inhibitory proteins: while 20% O2 both increased p21Cip1 expression and decreased cell proliferation, there was no affect on p27Kip1 expression. The reported increase in p21Cip1 mRNA and protein both suggest that the O2‐induced effect could involve a pre‐translational regulatory mechanism. However, p21Cip1 promoter activity was not affected by the different O2 levels, suggesting a post‐transcriptional mechanism (e.g. increased mRNA stability). Indeed, we found that mRNA stability was higher in response to 20% O2 in culture. The p21Cip1 mRNA decay assay revealed that by 6‐h post‐ActD treatment (inhibition of transcription), there was a greater decay of p21Cip1 mRNA in 5% than in 20% O2. As a follow‐up, an association between greater p21Cip1 mRNA stability and p53 transcriptional activity was observed. Future studies could ascertain whether the increased sensitivity of MPC p21Cip1 mRNA stability to higher O2 has implications for mechanisms that regulate MPC dysfunction in response to a variety of conditions including sarcopenia, heart failure, cancer and muscular dystrophy that are associated with cells’ increased oxidative stress (Rando 2002; Reid et al. 2005).
ACKNOWLEDGEMENTS
This study was supported by grant AG18780 from the National Institutes of Health.
REFERENCES
- Adams GR, Caiozzo VJ, Haddad F, Baldwin KM (2002) Cellular and molecular responses to increased skeletal muscle loading after irradiation. Am. J. Physiol. Cell Physiol. 283, C1182–C1195. [DOI] [PubMed] [Google Scholar]
- Allen RE, Temm‐Grove CJ, Sheehan SM, Rice G (1997) Skeletal muscle satellite cell cultures. Methods Cell Biol. 52, 155–176. [DOI] [PubMed] [Google Scholar]
- Behnke BJ, Delp MD, McDonough P, Spier SA, Poole DC, Musch TI (2004) Effects of chronic heart failure on microvascular oxygen exchange dynamics in muscles of contrasting fiber type. Cardiovasc. Res. 61, 325–332. [DOI] [PubMed] [Google Scholar]
- Bloom J, Pagano M (2004) To be or not to be ubiquitinated? Cell Cycle 3, 138–140. [PubMed] [Google Scholar]
- Chen CY, Xu N, Shyu AB (1995) mRNA decay mediated by two distinct AU‐rich elements from c‐fos and granulocyte‐macrophage colony‐stimulating factor transcripts: different deadenylation kinetics and uncoupling from translation. Mol. Cell. Biol. 15, 5777–5788. [DOI] [PMC free article] [PubMed] [Google Scholar]
- Chkhotua AB, Abendroth D, Froeba G, Schelzig H (2006) Up‐regulation of cell cycle regulatory genes after renal ischemia/reperfusion: differential expression of p16(INK4a), p21(WAF1/CIP1) and p27(Kip1) cyclin‐dependent kinase inhibitor genes depending on reperfusion time. Transpl. Int. 19, 72–77. [DOI] [PubMed] [Google Scholar]
- Chow DC, Wenning LA, Miller WM, Papoutsakis ET (2001) Modeling pO(2) distributions in the bone marrow hematopoietic compartment. I. Krogh's model. Biophys. J. 81, 675–684. [DOI] [PMC free article] [PubMed] [Google Scholar]
- Csete M (2005) Oxygen in the cultivation of stem cells. Ann. N. Y. Acad. Sci. 1049, 1–8. [DOI] [PubMed] [Google Scholar]
- Csete M, Walikonis J, Slawny N, Wei Y, Korsnes S, Doyle JC, Wold B (2001) Oxygen‐mediated regulation of skeletal muscle satellite cell proliferation and adipogenesis in culture. J. Cell Physiol. 189, 189–196. [DOI] [PubMed] [Google Scholar]
- Donadelli M, Dalla PE, Costanzo C, Scupoli MT, Piacentini P, Scarpa A, Palmieri M (2006) Increased stability of P21 (WAF1/CIP1) mRNA is required for ROS/ERK‐dependent pancreatic adenocarcinoma cell growth inhibition by pyrrolidine dithiocarbamate. Biochim. Biophys. Acta 1763, 917–926. [DOI] [PubMed] [Google Scholar]
- Dunn JF, Nwaigwe CI, Roche M (1999) Measurement of arterial, venous, and interstitial pO2 during acute hypoxia in rat brain using a time‐resolved luminescence‐based oxygen sensor. Adv. Exp. Med. Biol. 471, 43–48. [DOI] [PubMed] [Google Scholar]
- Essers MA, De Vries‐Smits LM, Barker N, Polderman PE, Burgering BM, Korswagen HC (2005) Functional interaction between beta‐catenin and FOXO in oxidative stress signaling. Science 308, 1181–1184. [DOI] [PubMed] [Google Scholar]
- Giles KM, Daly JM, Beveridge DJ, Thomson AM, Voon DC, Furneaux HM, Jazayeri JA, Leedman PJ (2003) The 3′‐untranslated region of p21WAF1 mRNA is a composite cis‐acting sequence bound by RNA‐binding proteins from breast cancer cells, including HuR and poly(C)‐binding protein. J. Biol. Chem. 278, 2937–2946. [DOI] [PubMed] [Google Scholar]
- Gorospe M, Wang X, Holbrook NJ (1998) p53‐dependent elevation of p21Waf1 expression by UV light is mediated through mRNA stabilization and involves a vanadate‐sensitive regulatory system. Mol. Cell. Biol. 18, 1400–1407. [DOI] [PMC free article] [PubMed] [Google Scholar]
- Gozal D, Holt GA, Graff GR, Torres JE (1998) Platelet‐activating factor modulates cardiorespiratory responses in the conscious rat. Am. J. Physiol. 275, R604–R611. [DOI] [PubMed] [Google Scholar]
- Hannken T, Schroeder R, Zahner G, Stahl RA, Wolf G (2000) Reactive oxygen species stimulate p44/42 mitogen‐activated protein kinase and induce p27(Kip1): role in angiotensin II‐mediated hypertrophy of proximal tubular cells. J. Am. Soc. Nephrol. 11, 1387–1397. [DOI] [PubMed] [Google Scholar]
- Hansen JM, Klass M, Harris C, Csete M (2007) A reducing redox environment promotes C2C12 myogenesis: implications for regeneration in aged muscle. Cell Biol. Int. 31, 546–553. [DOI] [PMC free article] [PubMed] [Google Scholar]
- Helt CE, Rancourt RC, Staversky RJ, O’Reilly MA (2001) p53‐dependent induction of p21(Cip1/WAF1/Sdi1) protects against oxygen‐induced toxicity. Toxicol. Sci. 63, 214–222. [DOI] [PubMed] [Google Scholar]
- Ilyin GP, Glaise D, Gilot D, Baffet G, Guguen‐Guillouzo C (2003) Regulation and role of p21 and p27 cyclin‐dependent kinase inhibitors during hepatocyte differentiation and growth. Am. J. Physiol. Gastrointest. Liver Physiol. 285, G115–G127. [DOI] [PubMed] [Google Scholar]
- Koshiji M, Kageyama Y, Pete EA, Horikawa I, Barrett JC, Huang LE (2004) HIF‐1alpha induces cell cycle arrest by functionally counteracting Myc. EMBO J. 23, 1949–1956. [DOI] [PMC free article] [PubMed] [Google Scholar]
- Kurki P, Ogata K, Tan EM (1988) Monoclonal antibodies to proliferating cell nuclear antigen (PCNA)/cyclin as probes for proliferating cells by immunofluorescence microscopy and flow cytometry. J. Immunol. Methods 109, 49–59. [DOI] [PubMed] [Google Scholar]
- Lal A, Mazan‐Mamczarz K, Kawai T, Yang X, Martindale JL, Gorospe M (2004) Concurrent versus individual binding of HuR and AUF1 to common labile target mRNAs. EMBO J. 23, 3092–3102. [DOI] [PMC free article] [PubMed] [Google Scholar]
- Lees SJ, Rathbone CR, Booth FW (2006) Age‐associated decrease in muscle precursor cell differentiation. Am. J. Physiol. Cell Physiol. 290, C609–C615. [DOI] [PubMed] [Google Scholar]
- Li X, Amazit L, Long W, Lonard DM, Monaco JJ, O'malley BW (2007) Ubiquitin‐ and ATP‐independent proteolytic turnover of p21 by the REGgamma‐proteasome pathway. Mol. Cell 26, 831–842. [DOI] [PubMed] [Google Scholar]
- Lim JH, Park JW, Kim MS, Park SK, Johnson RS, Chun YS (2006) Bafilomycin induces the p21‐mediated growth inhibition of cancer cells under hypoxic conditions by expressing hypoxia‐inducible factor‐1alpha. Mol. Pharmacol. 70, 1856–1865. [DOI] [PubMed] [Google Scholar]
- Lo SM, Mo FM, Ballard HJ (2001) Interstitial adenosine concentration in rat red or white skeletal muscle during systemic hypoxia or contractions. Exp. Physiol. 86, 593–598. [DOI] [PubMed] [Google Scholar]
- Machida S, Booth FW (2004) Increased nuclear proteins in muscle satellite cells in aged animals as compared to young growing animals. Exp. Gerontol. 39, 1521–1525. [DOI] [PubMed] [Google Scholar]
- Mauro A (1961) Satellite cell of skeletal muscle fibers. J. Biophys. Biochem. Cytol. 9, 493–495. [DOI] [PMC free article] [PubMed] [Google Scholar]
- O’Reilly MA (2005) Redox activation of p21Cip1/WAF1/Sdi1: a multifunctional regulator of cell survival and death. Antioxid. Redox Signal. 7, 108–118. [DOI] [PubMed] [Google Scholar]
- Pfau JC, Schneider JC, Archer AJ, Sentissi J, Leyva FJ, Cramton J (2004) Environmental oxygen tension affects phenotype in cultured bone marrow‐derived macrophages. Am. J. Physiol. Lung Cell. Mol. Physiol. 286, L354–L362. [DOI] [PubMed] [Google Scholar]
- Rando TA (2002) Oxidative stress and the pathogenesis of muscular dystrophies. Am. J. Phys. Med. Rehabil. 81, S175–S186. [DOI] [PubMed] [Google Scholar]
- Reid MB, Andrade FH, Balke CW, Esser KA (2005) Redox mechanisms of muscle dysfunction in inflammatory disease. Phys. Med. Rehabil. Clin. N. Am. 16, 925–949, ix. [DOI] [PubMed] [Google Scholar]
- Renault V, Thornell LE, Butler‐Browne G, Mouly V (2002) Human skeletal muscle satellite cells: aging, oxidative stress and the mitotic clock. Exp. Gerontol. 37, 1229–1236. [DOI] [PubMed] [Google Scholar]
- Schultz E, McCormick KM (1994) Skeletal muscle satellite cells. Rev. Physiol. Biochem. Pharmacol. 123, 213–257. [DOI] [PubMed] [Google Scholar]
- Seale P, Sabourin LA, Girgis‐Gabardo A, Mansouri A, Gruss P, Rudnicki MA (2000) Pax7 is required for the specification of myogenic satellite cells. Cell 102, 777–786. [DOI] [PubMed] [Google Scholar]
- Sheng W, Wang G, Wang Y, Liang J, Wen J, Zheng PS, Wu Y, Lee V, Slingerland J, Dumont D, Yang BB (2005) The roles of versican V1 and V2 isoforms in cell proliferation and apoptosis. Mol. Biol. Cell 16, 1330–1340. [DOI] [PMC free article] [PubMed] [Google Scholar]
- Sherr CJ, Roberts JM (1995) Inhibitors of mammalian G1 cyclin‐dependent kinases. Genes Dev. 9, 1149–1163. [DOI] [PubMed] [Google Scholar]
- Shibata M, Ichioka S, Ando J, Kamiya A (2001) Microvascular and interstitial PO(2) measurements in rat skeletal muscle by phosphorescence quenching. J. Appl. Physiol. 91, 321–327. [DOI] [PubMed] [Google Scholar]
- Shibata M, Ichioka S, Togawa T, Kamiya A (2006) Arterioles’ contribution to oxygen supply to the skeletal muscles at rest. Eur. J. Appl. Physiol. 97, 327–331. [DOI] [PubMed] [Google Scholar]
- Shu L, Yan W, Chen X (2006) RNPC1, an RNA‐binding protein and a target of the p53 family, is required for maintaining the stability of the basal and stress‐induced p21 transcript. Genes Dev. 20, 2961–2972. [DOI] [PMC free article] [PubMed] [Google Scholar]
- Tamaki T, Akatsuka A, Ando K, Nakamura Y, Matsuzawa H, Hotta T, Roy R, Edgerton VR (2002) Identification of myogenic‐endothelial progenitor cells in the interstitial spaces of skeletal muscle. J. Cell Biol. 157, 571–577. [DOI] [PMC free article] [PubMed] [Google Scholar]
- Tokuda Y, Crane S, Yamaguchi Y, Zhou L, Falanga V (2000) The levels and kinetics of oxygen tension detectable at the surface of human dermal fibroblast cultures. J. Cell. Physiol. 182, 414–420. [DOI] [PubMed] [Google Scholar]
- Wang W, Furneaux H, Cheng H, Caldwell MC, Hutter D, Liu Y, Holbrook N, Gorospe M (2000) HuR regulates p21 mRNA stabilization by UV light. Mol. Cell. Biol. 20, 760–769. [DOI] [PMC free article] [PubMed] [Google Scholar]
- Westerkamp CM, Gordon SE (2005) Angiotensin‐converting enzyme inhibition attenuates myonuclear addition in overloaded slow‐twitch skeletal muscle. Am. J. Physiol. Regul. Integr. Comp. Physiol. 289, R1223–R1231. [DOI] [PubMed] [Google Scholar]
- Wolf G, Wenzel U, Hannken T, Stahl RA (2001) Angiotensin II induces p27(Kip1) expression in renal tubules in vivo: role of reactive oxygen species. J. Mol. Med. 79, 382–389. [DOI] [PubMed] [Google Scholar]