Abstract
Objectives
Control of cell proliferation is critical for accurate cell differentiation and tissue formation, during development and regeneration. Here, we have analysed the role of microphthalmia‐associated transcription factor MITF and its direct target, T‐box factor TBX2, in regulating proliferation of mammalian neural crest‐derived melanocytes.
Materials and methods
Immunohistochemistry was used to examine spatial and temporal expression of TBX2 in melanocytes in vivo. RNAi and cell proliferation analysis were used to investigate functional roles of TBX2. Furthermore, quantitative RT‐PCR, western blot analysis and flow cytometry were used to further scrutinize molecular mechanisms underlying TBX2‐dependent cell proliferation.
Results
TBX2 was found to be co‐expressed with MITF in melanocytes of mouse hair follicles. Specific Tbx2 knockdown in primary neural crest cells led to inhibition MITF‐positive melanoblast proliferation. Tbx2 knockdown in melan‐a cells led to reduction in Cyclin D1 expression and G1‐phase cell cycle arrest. TBX2 directly activated Ccnd1 transcription by binding to a specific sequence in the Ccnd1 promoter, and the defect in cell proliferation could be rescued partially by overexpression of Cyclin D1 in Tbx2 knockdown melanocytes.
Conclusions
Results suggest that the Mitf‐Tbx2‐Cyclin D1 pathway played an important role in regulation of melanocyte proliferation, and provided novel insights into the complex physiology of melanocytes.
Introduction
Regulation of cell proliferation is critical, not only during embryonic development but also in the adult, during tissue regeneration and tumour formation. A prime example of cells under proliferation's tight control is provided by the vertebrate melanocyte lineage. Melanocyte precursors are derived from the embryonic neural crest from whence they migrate considerable distances during development 1, 2, 3, 4. Numbers of their differentiated progeny in the integument, resulting from balance of proliferation, migration and death, influences extent of pigmentation 5, 6, 7. In the adult, melanocytes proliferate during skin wound healing and during repigmentation, for instance in vitiligo lesions 8, 9. Furthermore, during malignant transformation in the adult, melanocytes can initiate abnormal proliferation and migration leading to local malignant melanomas as well as metastases 10, 11. These examples illustrate the profound importance of regulation of melanocyte proliferation throughout life. Knowledge gained from investigating mechanisms underlying melanocyte proliferation provide deeper understanding, not only of physiology, but also of pathophysiology, of melanocytes.
Previous studies have shown that melanocyte proliferation is regulated by numerous genes including those encoding proteins involved in signalling and transcription regulation, such as β‐catenin, endothelin receptor (EDNRB) and its ligand (EDN), the receptor KIT and its ligand (KITL), hepatocyte growth factor receptor (MET) and its ligand (HGF), and transcription factors MITF, BRN2, PAX3 and SOX10. Of the latter, MITF, a basic‐helix‐loop‐helix‐leucine zipper (bHLHZip) protein, is a crucial regulator of the melanocyte lineage, although it is also expressed in a variety of other cell types 12, 13. MITF usually acts as a transcriptional activator that regulates a variety of target genes 14, 15, which in turn are involved in regulation of cell proliferation 16, survival 17, 18, differentiation 19, 20, 21, 22 and migration (23, our as yet unpublished data).
Previous work has shown that Tbx2 is one of many direct targets of MITF 24. It belongs to the family of genes encoding T‐box transcription factors, which play important roles in a variety of tissues during embryonic development 25, 26. Tbx2 also participates in cell cycle regulation and malignant transformation 27. Most studies of Tbx2 focus on its role in generation of malignant melanomas as it suppresses senescence by reducing expression of p21CIP1 28. Tbx2 and its relative Tbx3 both contribute to malignant melanoma invasiveness by reducing expression of E‐cadherin 29. Furthermore, Tbx2 is expressed in several malignant melanoma and melanocyte lines, in which it represses expression of pigmentation gene Tyrp1 30. However, it is unclear whether the Mitf‐Tbx2 pathway plays a role in normal melanocyte proliferation.
Here, we have approached the question of the role of Tbx2 in melanocyte proliferation by experimentally manipulating levels of TBX2 in primary neural crest cells as well as in a melanocyte cell line, melan‐a. Our results show that TBX2 is expressed in melanocytes of hair follicles of P3 mouse skin and that knockdown of Tbx2 in primary neural crest cells inhibits melanocyte proliferation. We further show that Tbx2 knockdown induces G1‐phase cell cycle arrest in melan‐a cells by down‐regulating cell cycle regulator Ccnd1. Furthermore, overexpresssion of Ccnd1 after Tbx2 knockdown partly rescues melan‐a cell proliferation. Hence, it appears that the Mitf‐Tbx2‐Ccnd1 pathway regulates cell cycle progression of both melanoblasts and melanocytes.
Materials and methods
Cell lines and reagents
Melan‐a cells, a mouse melanocyte cell line, were cultured in RPMI 1640 medium (Sigma, St. Louis, MO, USA) supplemented with 10% FBS (Gibco), 2 mm l‐glutamine (Gibco, Grand Island, NY, USA), 50 μg/ml gentamicin and 100 nm 12‐O‐tetradecanoylphorbol‐13‐acetate (TPA; Sigma) in a humidified atmosphere with 5% CO2 at 37 °C. HEK 293T cells were cultured in DMEM (Gibco) with 10% FBS and 50 μg/ml gentamicin (Gibco) in a humidified atmosphere with 5% CO2 at 37 °C.
Neural tube explant cultures
C57BL/6J (B6) mice were used for this study. It was defined as embryonic day 0.5 (E0.5) when vaginal plugs were found at noon of the day. E9.5 embryos were harvested from pregnant B6 females and neural tube (NT) explants containing neural crest cells were isolated and cultured as previously described 20. For most experiments, melanocyte induction medium consisted of 90% DMEM, 1 mm l‐glutamine, 50 μg/ml gentamicin, 10% FBS and 20 nM EDN3 (Sigma).
siRNA and transfection
siRNAs specific for mouse Tbx2 and a negative control were designed and produced by GenePharma (Shanghai, China). Their sequences are shown in Table S1. Melan‐a cells were grown to 70% confluence in culture dishes and transfected with 40 nm siRNAs/well using LipoJet™ In Vitro Transfection Kit (SignaGen Laboratories, Rockville, MD, USA) according to the manufacturer's instructions. Cells were harvested at 72 h post‐transfection for examination of transfection efficiency and function.
Plasmid constructs
FUW‐OSKM vector was purchased from Addgene (Cambridge, MA, USA) and mouse Tbx2 cDNA (GC‐Mm30892) was purchased from Genecopoeia Inc (Rockville, MD, USA). To generate FUW‐Gfp, the sequence comprising Oct4‐P2A‐Sox2‐T2A‐Klf4‐E2A‐cMyc was excised from the FUW‐OSKM vector and replaced with a GFP cDNA, using restriction enzymes XbaI and AscI. To generate FUW‐Gfp‐Tbx2, Oct 4 sequence was first replaced with GFP cDNA using restriction enzymes XbaI and NheI and Sox2‐T2A‐Klf4‐E2A‐cMyc sequence was then replaced with the Tbx2 cDNA using a blunt‐end ligation strategy. To generate FUW‐HA‐Ccnd1, a cDNA of Ccnd1 with a HA tag was placed in lieu of Oct4‐P2A‐Sox2‐T2A‐Klf4‐E2A‐cMyc using restriction enzymes XbaI and AscI. Sequences of primers used in the study are shown in Table S1.
Lentivirus preparation and infection
A lentiviral expression system was used to overexpress TBX2 and Cyclin D1 in melan‐a cells. Replication‐incompetent lentiviral particles were packaged as follows: 293T cells were grown to approximately 70% confluence in T‐25 flasks and were transfected with 0.75 μg pMD2G, 2.25 μg psPAX2, combined with 3 μg of either FUW‐Gfp or FUW‐HA‐Ccnd1 or FUW‐Gfp‐Tbx2 using PolyJet™ in vitro DNA transfection reagent (SignaGen Laboratories) according to the manufacturer's instructions. Forty‐eight hours after transfection, culture medium containing lentiviral particles was collected and filtered through a 0.45 μm filter. After concentration using Lenti‐X Concentrator (Clontech Laboratories, Inc., Mountain View, CA, USA), supernatants containing approximately 106 infectious units (IFU) per ml were used to infect melan‐a cells seeded in 12‐well plates. Cells were infected with two to three rounds of viral supernatant (each round for 3 h).
RNA extraction and gene expression analysis
Total RNA was isolated 48 h after siRNA transfection using Trizol reagent (Life Technologies, Carlsbad, CA, USA) and reverse transcribed into cDNAs using a reverse transcriptase kit (Agilent, Santa Clara, CA, USA) and random primers (Promega, Madison, WI, USA) according to the manufacturer's instructions. For gene expression analysis, resulting cDNAs were used for real‐time PCR using SYBR Green technology (Applied Biosystems, Foster City, CA, USA). All reactions were run in triplicate on an ABI 7500 instrument (Applied Biosystems). Data were normalized to those obtained for GAPDH. All gene‐specific primers were designed by Primer 5 Software. Primer sequences are depicted in Table S1.
Antibodies and immunofluorescence
Skin tissue samples were fixed in 4% paraformaldehyde (PFA) in PBS and dehydrated in 30% sucrose, then cryoprotected with OCT. For immunofluorescence, 14 μm cryosections were processed in the following solutions: 5% BSA for 1 h at room temperature, rabbit anti‐MITF (1:200; a gift from Heinz Arnheiter) and mouse anti‐TBX2 (1:200; a gift from Colin R. Goding) at 4 °C overnight. Sections were then incubated with fluorophore‐conjugated secondary antibodies (Invitrogen, Carlsbad, CA, USA) for 1 h at room temperature.
Primary neural crest cells and melan‐a cells were fixed in 4% PFA in PBS for 25 min at room temperature then blocked in 5% BSA in PBS before addition of primary antibodies. Double indirect immunostaining was performed using appropriate rabbit anti‐MITF (1:200), mouse anti‐MITF (1:200; Abcam, Cambridge, UK), mouse anti‐TBX2 (1:200), goat anti‐TBX2 (1:50; Santa Cruz Biotechnology, Dallas, TX, USA), rabbit anti‐Ki67 (1:200; Millipore, Billerica, MA, USA), rabbit anti‐ Cyclin D1 (1:50; Cell Signalling Technology, Danvers, MA, USA) or mouse anti‐HA (1:200; Covance, Princeton, NJ, USA), each incubated overnight at 4 °C. Cultures were then washed and primary antibodies revealed by corresponding secondary antibodies added for 1 h at room temperature. Specimens were examined and photographed using a Zeiss fluorescence microscope.
Western blotting
Total proteins were extracted using SDS Lysis Buffer (Beyotime, Shanghai, China), separated by 10% SDS–PAGE gels and transferred to PVDF membranes. After blocking in 5% non‐fat milk for 2 h at room temperature, membranes were probed with specific antibodies either to TBX2 (1:500; Santa Cruz Biotechnology), Cyclin D1 (1:1000; Cell Signalling Technology), CDK4 (1:1000; Cell Signalling Technology), pRB (1:1000; Cell Signalling Technology), E2F1 (1:1000; Cell Signalling Technology), CDK2 (1:1000; Cell Signalling Technology), p21 (1:200; Santa Cruz Biotechnology), HA (1:1000; Covance), or GAPDH (1:5000; Kangcheng Bio‐Tech, Shanghai, China), respectively, followed by incubation with appropriately labelled goat anti‐mouse (1:5000; LI‐COR), goat anti‐rabbit (1:5000; LI‐COR, Lincoln, NE, USA) or donkey anti‐goat (1:5000; LI‐COR) antibodies. Protein bands were visualized by chemiluminescence using an Odyssey Infrared Imaging System (LI‐COR). GAPDH was used as loading control and protein bands were analysed using ImageJ software (National Institutes of Health, Bethesda, MD, USA).
Cell proliferation analysis
Melan‐a cells were plated in 96‐well plates, 2000 cells per well, and transfected using LipoJet™ in vitro transfection kit (SignaGen Laboratories) with 40 nm siRNA, in each well. Cell number was recorded from day 1 to day 4, and a growth curve was composed.
For cell cycle analysis, cells were collected by trypsinization and fixed in 70% EtOH for 30 min. They were washed in PBS and stained with 50 μg/ml propidium iodide (PI) and 100 μg/ml RNase in PBS for 30 min. PI‐stained cells were filtered and analyzed on a FACS Calibur (BD Biosciences, San Jose, CA, USA).
Chromatin immunoprecipitation (ChIP) and luciferase reporter assays
For ChIP assay, anti‐TBX2 antibody (C‐17; Santa Cruz Biotechnology) and melan‐a cells were used. The following PCR primers for Ccnd1 promoter were used for ChIP‐PCR reaction: Ccnd1ChIP‐F (ACTCGGAAACGCACCCATT) and Ccnd1ChIP‐R (CACACGCAAGCCAAGGAAG). As control, Tbx2 target gene p21 was used. PCR primers for the p21 promoter were p21ChIP‐F (GGCTTAGATTCCCAGAGGG) and p21ChIP‐R (TTCTGGGGACACCCACTGG). ChIP experiments were performed using Magna ChIP™ G Chromatin Immunoprecipitation Kit (Millipore) according to the manufacturer's instructions.
For luciferase reporter assays, a 431 bp fragment of Ccnd1 promoter containing the putative T‐box binding element was inserted into the PGL3‐promoter luciferase reporter vector (Promega) using blunt‐end ligation strategy. Cloning primers were as follows: proCcnd1‐F: ACTCGGAAACGCACCCATT and proCcnd1‐R: AACTTCAACAAAACTCCCCT. 293T cells were grown to approximately 70% confluence in 96‐well plates and were transfected with increasing concentrations of either GFP or Tbx2 expression vector (80 and 160 ng), 80 ng of either PGL3‐Basic or PGL3‐Ccnd1, combined with 1 ng pRL‐TK (Promega) expressing renilla luciferase, using PolyJet™ in vitro DNA transfection reagent (SignaGen Laboratories) according to the manufacturer's instructions. Luciferase activity was examined 48 h post transfection using Dual‐Luciferase Reporter Assay System (Promega). Relative luciferase activity was normalized to that of PGL3‐basic plasmid.
Statistical analysis
Each experiment was repeated at least three times and all quantitative data are presented as mean ± SD. Statistical significance (P‐value) between experimental and control groups was assessed using Student's t‐test. P < 0.05 was considered significant and P < 0.01 was highly significant.
Results
Spatiotemporal expression of TBX2 in melanocytes
Previous in vitro studies have shown that Tbx2 is expressed in melanocytes but not in melanoblasts 30, but up to now, in vivo pattern of TBX2 expression in melanoblasts or melanocytes has been unknown. Hence, we examined temporal and spatial expression of MITF and TBX2 in hair follicle melanocytes in C57BL/6J mouse skin, using anti‐MITF and anti‐TBX2 antibodies. As shown in Fig. 1a, TBX2 was not detected in melanocytes of P0 hair follicles while melanocyte key regulator MITF was readily expressed at this time point. In P3 mouse skin, however, MITF and TBX2 were seen co‐expressed in melanocytes (Fig. 1b,c). These results suggest that MITF expression precedes that of TBX2 in postnatal hair follicle melanocytes.
Figure 1.
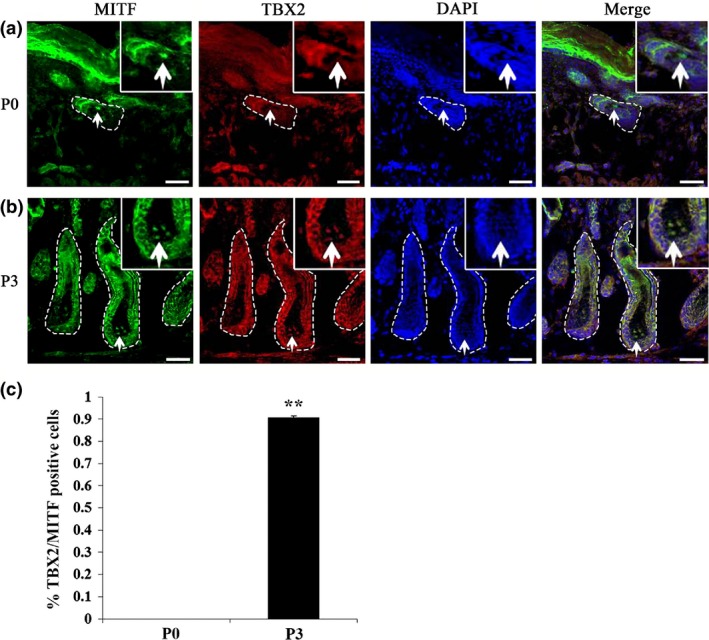
TBX2 expressed in hair follicle melanocytes in mouse skin. (a, b) Double immunolabelling for MITF and TBX2 in postnatal hair follicles of mouse skin at P0 (a) and P3 (b). MITF staining specifically labelled melanocytes. While MITF expression (green nuclear staining) was detected in follicular melanocytes at P0, TBX2 expression (red nuclear staining) was only detected at P3. (c) Percentage of TBX2 and MITF double‐positive cells in hair follicle melanocytes of P0 and P3 mouse skins. Experiments were performed in triplicate and are represented as mean ± SD. Significance was determined by Student's t‐test whereby **P < 0.01. White arrows indicate positive cells. Dotted lines label the boundaries of hair follicles. Bar = 50 μm.
Tbx2 was required for mouse melanoblast proliferation
It has already been shown that Tbx2 participates in embryonic development and is important in cell proliferation during heart development 27. As TBX2 is expressed in P3 follicular melanocytes, we examined what its functional role might be during melanocyte development. To this end, we established primary embryonic neural crest cell cultures, in which melanocytes developed with rates of cell division and timing of expression of key melanogenic genes similar to those observed in vivo 21. We first isolated primary embryonic neural tube explants from E9.5 embryos of C57BL/6J mice and cultured them in melanocyte induction medium. As expected, expression of MITF was detected after 2 days culture, but expression of TBX2 in the same cultures was not observed in less than 4 days (Fig. 2a). These results are consistent with in vitro observation that Tbx2 is a downstream target of MITF.
Figure 2.
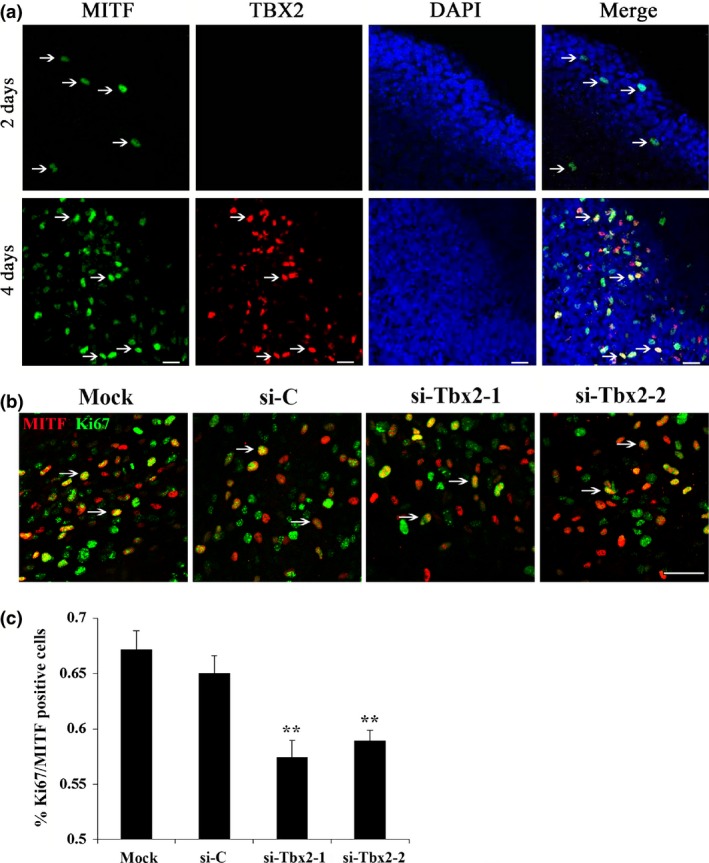
Knockdown of Tbx2 inhibited the proliferation of melanoblasts in primary neural crest cell cultures. Neural tube explants were isolated from E9.5 C57BL/6J embryos and cultured in melanocyte induction medium. MITF staining labels melanoblasts. (a) Double immunolabelling for MITF (green nuclear staining) and TBX2 (red nuclear staining) at different days culture. MITF expression began at day 2 while TBX2 and MITF were co‐expressed only at day 4. White arrows indicate positive cells. Bar = 20 μm. (b, c) siRNA‐mediated Tbx2 down‐regulation reduced percentage of MITF and Ki67 double‐positive cells. Primary neural crest cells were transfected with a negative control (si‐C) or Tbx2‐specific siRNAs (si‐Tbx2‐1 and si‐Tbx2‐2). MITF and Ki67 double‐positive cells were recorded and counted 4 days after transfection. Bar = 50 μm (b). Note that number of Ki67 and MITF double‐positive cells was dramatically reduced after knockdown of Tbx2 (c). Experiments were performed in triplicate and are represented as mean ± SD. Significance was determined by Student's t‐test whereby **P < 0.01.
To investigate functional roles of Tbx2 in melanoblasts, we used RNAi to reduce expression of Tbx2 in primary embryonic neural crest cell cultures. Neural crest cells were cultured for 3 days and then transfected with appropriate control si‐RNA or Tbx2‐specific siRNAs (for short, si‐Tbx2‐1 and si‐Tbx2‐2) whose efficacy to reduce TBX2 expression was tested in the cultures. Four days after transfection, percentages of MITF and Ki67 (marker of proliferating cells) double‐positive cells was significantly reduced in the Tbx2 knockdown groups compared to mock and control si‐C groups (Fig. 2b,c). These results indicate that Tbx2 played a role in melanocyte proliferation.
Knockdown of Tbx2 inhibited melanocyte proliferation
To further examine how Tbx2 affected melanocyte proliferation, we utilized a mouse melanocyte cell line, melan‐a, which afforded more detailed cell cycle analysis than is possible with the small numbers of melanocytes that can be obtained from primary neural crest cultures. To reduce TBX2 expression, we used two Tbx2‐specific siRNAs and the control si‐RNA mentioned above. As shown by western blots (Fig. 3a), both Tbx2‐si‐RNAs reduced TBX2 expression in contrast to mock or si‐C. As shown in Fig. 3b, this reduction in TBX2 expression was accompanied by decrease in cell numbers between days one and four of transfection. This relative reduction in cell numbers was also reflected in a significant reduction in Ki67 positivity (Fig. 3c,d). Hence, knockdown of Tbx2 was shown to inhibit melan‐a cell proliferation.
Figure 3.
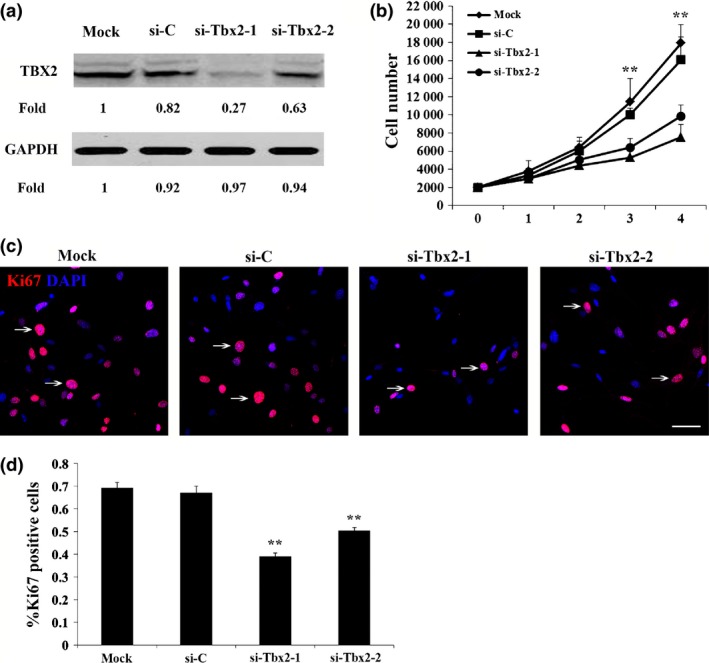
Knockdown of Tbx2 inhibited melan‐a cell proliferation. (a) Western blot analysis of TBX2 expression using anti‐TBX2 antibody. Note that expression of TBX2 was significantly reduced in melan‐a cells transfected with Tbx2‐specific siRNAs (si‐Tbx2‐1 and si‐Tbx2‐2). Intensity of bands was measured using ImageJ software and fold‐change was normalized to that of mock cells. (b) Proliferation analysis for melan‐a cells transfected with si‐C, si‐Tbx2‐1 or si‐Tbx2‐2. Cell numbers were recorded from day 1 to day 4 after transfection. Note that knockdown of Tbx2 led to reduced cell growth compared to mock cells. (c) Immunolabelling for Ki67 (red nuclear staining), a marker for proliferating cells, in melan‐a cells transfected with si‐C, si‐Tbx2‐1 or si‐Tbx2‐2. Number of Ki67‐positive cells was reduced in Tbx2 knockdown cells after 3 days transfection by si‐Tbx2. Bar = 50 μm. (d) Percentage of Ki67‐positive cells was determined based on data similar to those shown in Fig. 2c. Data are from triplicate experiments and are represented as mean ± SD. **P < 0.01.
Tbx2 up‐regulated endogenous expression of cell cycle regulator Ccnd1
To further analyse molecular mechanisms underlying Tbx2‐dependent cell proliferation, we used quantitative RT‐PCR to examine expression of a number of cell proliferation‐related candidate genes following knockdown of Tbx2. As shown in Fig. 4a, 3 days after transfection of either of the two si‐Tbx2 or si‐C, expression of Mitf was unchanged compared to untransfected (mock) melan‐a cells, consistent with the notion that Mitf lies upstream of Tbx2. Moreover, Pax3 and Sox10 expression was also not changed, indicating that their levels did not depend on Tbx2. Nevertheless, Tbx2 knockdown led to down‐regulation of some of cell proliferation‐related genes including Ccnd1 (encoding Cyclin D1), Bcl9l, Cdca7, Mphosph9 and Dna2. In contrast, Bmyc was up‐regulated. Western blot analysis confirmed reduction in expression of Cyclin D1 at the protein level (Fig. 4b). Cyclin D1 is of interest here as it has been shown to work as a G1‐phase cell cycle regulator by serving as a regulatory subunit of CDK4 or CDK6 31.
Figure 4.
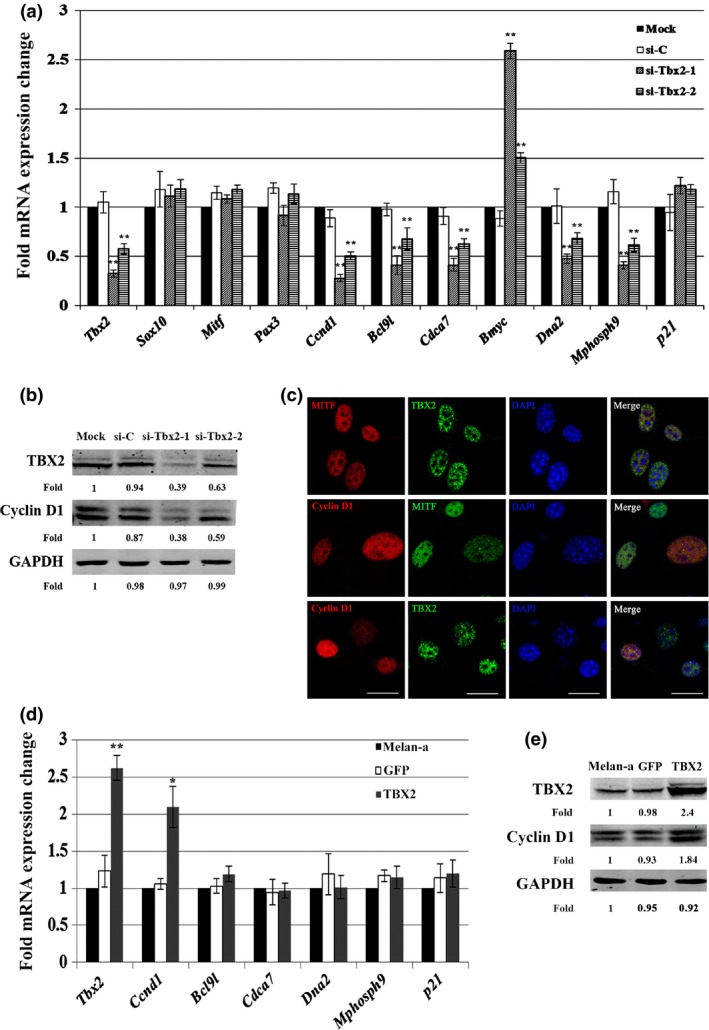
Tbx2 regulated expression of endogenous Ccnd1 . Knockdown of Tbx2 led to down‐regulation of Ccnd1 expression (a, b). (a) Relative fold change in mRNA levels of candidate proliferation‐related genes in melan‐a cell transfected with si‐Tbx2‐1 or si‐Tbx2‐2 compared to mock cells. Down‐regulation of Tbx2 caused reduction of several proliferation‐related genes, including Ccnd1, Bcl9l, Cdca7, Mphosph9, and Dna2. (b) Western blot analysis of TBX2 and Cyclin D1 expression in melan‐a cell transfected with si‐C, si‐Tbx2‐1 or si‐Tbx2‐2. Note that knockdown of Tbx2 lead to reduction in levels of Cyclin D1, consistent with reduction in Tbx2 mRNA seen in (a). Intensity of bands was measured using ImageJ software and fold‐change compared to level seen in mock cells is indicated. (c) Immunolabelling for TBX2, Cyclin D1, and MITF in melan‐a cells showed that TBX2 and Cyclin D1 colocalized in nuclei of melan‐a cells. Bar = 20 μm. (d, e) Overexpression of TBX2 up‐regulated expression of Ccnd1. Melan‐a cells were infected with the GFP or GFP‐TBX2 lentivirus, respectively, and cells were continually cultured for at least a week. (d) Relative fold‐change in mRNA levels of candidate proliferation‐related genes in melan‐a cells overexpressing TBX2. Results show that overexpression of TBX2 lead to up‐regulation of Ccnd1. (e) Western blot analysis of TBX2 and Cyclin D1 expression in TBX2‐overexpressing melan‐a cells. Note that expression of Cyclin D1 increased after overexpression of Tbx2. Intensity of bands was measured using ImageJ software and fold‐change was compared to expression in mock cells. Data for (a) and (d) are from triplicate experiments and are represented as mean ± SD. *P < 0.05 and **P < 0.01.
To act as a transcription factor on nuclear target genes, TBX2 needs to be in the nucleus; however, TBX2 is expressed in both the cytoplasm and nucleus of MCF‐7 cells 32, and subcellular localization of TBX2 and Cyclin D1 in melan‐a cells was unknown. As shown in Fig. 4c, double immunofluorescence showed that TBX2 and Cyclin D1 were indeed co‐localized in the nucleus of melan‐a cells. Moreover, overexpression of TBX2 in melan‐a cells, achieved by infection with an appropriate lentivirus, led to up‐regulation of Ccnd1, at both mRNA and protein levels (Fig. 4d,e). Taken together, these results suggest that Tbx2 regulates expression of endogenous Ccnd1 in melan‐a cells.
To test whether TBX2 activates Ccnd1 by directly binding Ccnd1 regulatory sequences, we employed standard chromatin‐IP and promoter analyses. The Ccnd1 gene contains a conserved TBX2 binding element (TTGCAC) at bp −307 to −312 upstream of the Ccnd1 transcriptional start site (Fig. S1a). Standard chromatin‐IP showed amplification of a corresponding amplicon after TBX2 immunoprecipitation but not after control IgG immunoprecipitation (Fig. S1b). Furthermore, luciferase reporter assays showed increased activity of corresponding 431 bp Ccnd1 promoter fragment after Tbx2 co‐transfection compared to GFP control co‐transfection (Fig. S1c). These results suggest that Ccnd1 is one of the functional targets of TBX2 in melan‐a cell proliferation.
Knockdown of Tbx2 induced G1‐phase cell cycle arrest in melanocytes
To examine in more detail how Tbx2, by regulating Ccnd1, influenced the cell cycle, we transfected melan‐a cells for 3 days with si‐C, si‐Tbx2‐1 or si‐Tbx2‐2, labelled the transfected as well as mock cells with propidium iodide, and subjected them to flow cytometry. As shown in Fig. 5a and 5b, percentages of cells in G1 was increased after Tbx2 knockdown, suggesting that reduction of TBX2 expression induced G1‐cell cycle arrest.
Figure 5.
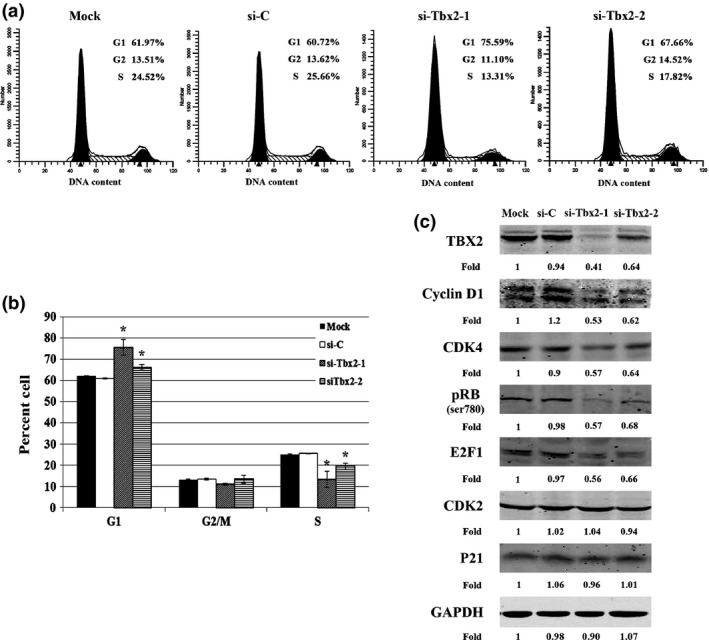
Knockdown of Tbx2 induced G1 cell cycle arrest and regulated expression of cell cycle‐related proteins. (a) Representative flow cytometric analysis of melan‐a cells either mock or transfected with si‐C, si‐Tbx2‐1 or si‐Tbx2‐2. Results show that percentages of cells in G1 phase increased after knockdown of Tbx2. (b) Quantification (mean ± SD) from triplicate flow cytometric analyses of percentages of G1, G2/M and S cell populations in melan‐a cell transfected with si‐C, si‐Tbx2‐1 or si‐Tbx2‐2. *P < 0.05. (c) Western blot analysis of cell cycle‐related proteins in melan‐a cells and melan‐a cells transfected with si‐C, si‐Tbx2‐1 or si‐Tbx2‐2. Note that besides Cyclin D1, several other G1‐phase related proteins, such as CDK4, pRB, and E2F1, were reduced after knockdown of Tbx2. Intensity of bands was measured using ImageJ software and fold‐change is given in comparison to intensities in mock cells.
To further investigate G1 arrest, we examined expression of G1‐phase cell cycle‐related proteins using western blot analysis. As shown in Fig. 5c, compared to respective controls, Tbx2 knockdown led to significant reduction in expression levels of Cyclin D1 and CDK4. We also examined expression of the RB‐E2F1 complex, whose activation is important for G1‐to‐S phase transition. As shown in Fig. 5c, Tbx2 knockdown also led to significant reduction in expression of E2F1 and Ser780‐phosphorylated RB. In contrast, there were no obvious changes in expression levels of CDK2 and p21 (Fig. 5c). These results suggest that Tbx2 promoted melanocyte cell cycle progression through Cyclin D1 and RB‐E2F1, but not p21 and CDK2.
Overexpression of Ccnd1 partially rescued cell proliferation defect in Tbx2 knockdown melanocytes
To examine whether Tbx2 knockdown indeed acted by inhibiting expression of Ccnd1 to regulate melanocyte proliferation, we further asked whether overexpression of Cyclin D1 might rescue impairment of melanocyte proliferation in Tbx2 knockdown cells. As shown in Fig. 6a, we used a lentiviral expression system to overexpress an HA‐tagged Cyclin D1 or, for control purposes, GFP in melan‐a cells and established GFP and Cyclin D1‐overexpressing stable cell lines. Such lines were then transfected with either si‐Tbx2 or si‐C. After 3 days transfection, we performed immunofluorescence to detect cells co‐expressing GFP/Ki67 or HA/Ki67. As shown in Figs. 6b and 6c, overexpression of Ccnd1 led to increase in Ki67‐positive cells in Tbx2 knockdown cells compared to GFP‐overexpressing/Tbx2 knockdown cells. That the siRNA against Tbx2 has indeed led to reduction in TBX2 in these Cyclin D1 overexpressing cells is shown by western blotting in Fig. 6d. Western blot analysis also showed that E2F1 and CDK4, both substantially reduced in si‐Tbx2 transfected GFP‐expressing control cells, were increased in cells overexpressing Cyclin D1 (Fig. 6d). These results clearly indicate that TBX2 can functionally act through Ccnd1 to regulate G1‐phase cell cycle progression in melanocytes.
Figure 6.
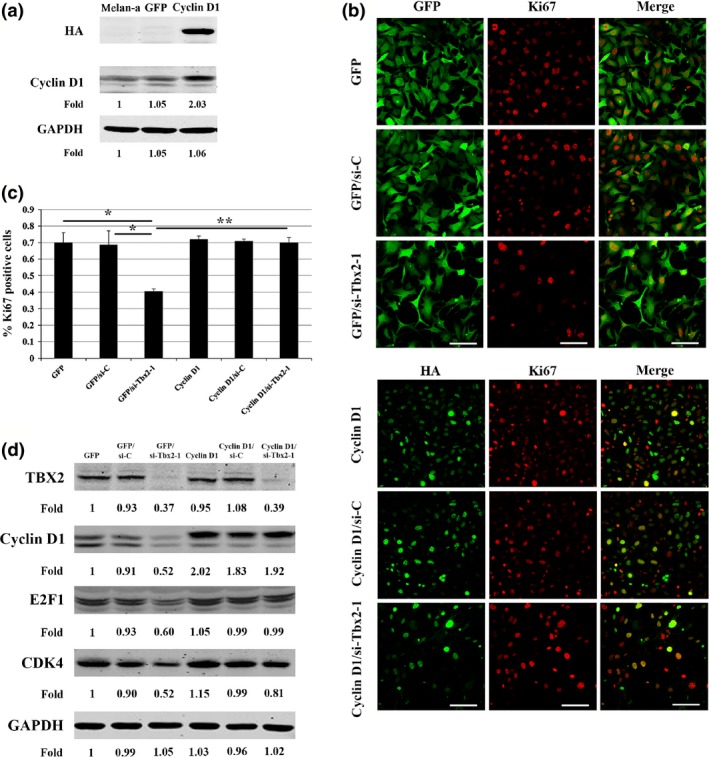
Overexpression of Cyclin D1 in Tbx2 knockdown melan‐a cells rescued cell proliferation. Melan‐a cells were infected with the GFP or Cyclin D1 lentivirus, respectively, and then continually cultured for 1 week. HA expression represented ectopic Cyclin D1 expression. (a) Western blot analysis of HA and Cyclin D1 expression in Ccnd1 overexpressing melan‐a cell. HA expression was detected in Ccnd1 overexpressing cells, but not in mock and GFP‐expressing melan‐a cells. Intensity of Cyclin D1 and GAPDH bands was measured using ImageJ software and fold‐change indicated in comparison to corresponding bands in mock cells. (b) Cells infected with GFP lentivirus and double‐immunolabled for GFP and Ki67. Cells were either transfected with si‐C or si‐Tbx2‐1. The lower set of panels shows cells infected with Cyclin D1 lentivirus and double‐immunolabelled for HA and Ki67. Cells were either transfected with si‐C or si‐Tbx2‐1. Results show that the numbers of Ki67‐positive cells increased after overexpression of Cyclin D1 in Tbx2 knockdown cells compared to GFP control group (compare GFP/si‐Tbx2 with Cyclin D1/si‐Tbx2). Bar = 50 μm. (c) Percentage of Ki67‐positive cells was determined based on data from Fig. 6b. Results are from triplicate experiments and are represented as mean ± SD. *P < 0.05 and **P < 0.01. (d) Western blot analysis of cell cycle‐related proteins from overexpression of Cyclin D1 in Tbx2 knockdown melan‐a cells. Note that reduction in expression of CDK4 and E2F1 after Tbx2 knockdown was reversed after Cyclin D1 overexpression. Intensity of bands was measured using ImageJ software and fold‐change was calculated in comparison to GFP data.
Discussion
Melanocyte proliferation is a complex process regulated by a variety of signalling and transcription factors. Of the latter, MITF occupies a key position. Here we show that Tbx2, which has various roles in many types of normal and transformed cells and which (based on in vitro studies) is a direct target of MITF, is expressed in melanocytes of mouse hair follicles. Furthermore, we show that Tbx2 played a role in regulating melanocyte numbers in primary neural crest cell cultures. When tested in a melanocyte line in vitro, it is required for cell proliferation by stimulating expression of Ccnd1, a cell cycle regulator that has previously been shown to be involved in cell cycle control in many cell types and in cancers 33, 34. Finally, that experimental overexpression of Ccnd1 rescues the proliferation defect associated with Tbx2 knockdown suggests the existence of a linear pathway that links Mitf with Tbx2 and Ccnd1.
The above interpretation of a linear pathway receives support from previous observations showing that Mitf and Tbx2 have overlapping functions, not only in cell cycle regulation, but also in regulating senescence and DNA repair 28, 35, 36, 37, 38. Hence, it is conceivable that Mitf acts through Tbx2 to affect a variety of biological processes. On the other hand, it has also been observed that distinct target genes may be regulated differentially by Mitf and Tbx2. For instance, Mitf positively regulates the cell cycle regulator p21 16 and pigmentation gene Tyrp1 39, but Tbx2 represses both p21 and Tyrp1 30, 35.
How can a linear Mitf‐Tbx2 pathway be reconciled with existence of other pathways that act in parallel but have opposing effects? It is likely that co‐existence of such parallel pathways affords cells with the possibility for an exquisitely fine‐tuned, context‐dependent regulation of cell physiology. If, as schematically depicted in Fig. 7, Mitf can inhibit cell proliferation, for example through the up‐regulation of p21, but stimulate cell proliferation by down‐regulating p21 following up‐regulation of Tbx2, with the further support of up‐regulation of Ccnd1, then cells could switch between the two effects, or even oscillate, by dynamically regulating relative strength of each pathway. This could be achieved, for instance, by post‐transcriptional or post‐translational modifications of respective gene products or by specific association with co‐factors, with the consequence that under distinct conditions, different sets of target genes might be stimulated or repressed. TBX2, for instance, contains two transcription repression domains and one activation domain and can indeed work either as an activator or a repressor 40. Under most conditions, TBX2 acts as a repressor of gene expression 35, 41, 42, but it can activate type 1 collagen expression in NIH 3T3 fibroblasts 43, induce Has2 and Tgf β2 during heart development 44, or, as shown here, Ccnd1. Nevertheless, we did not detect elevated p21 expression in Tbx2 knockdown melan‐a cells. This, however, may not be surprising given that Tbx2 does not consistently repress p21 expression in all cell types. For instance, expression of p21 shows no change in human lung fibroblasts overexpressing Tbx2 45 while overexpression of Tbx2 in Hek293 cells leads to increases in transcript levels of p21 46.
Figure 7.
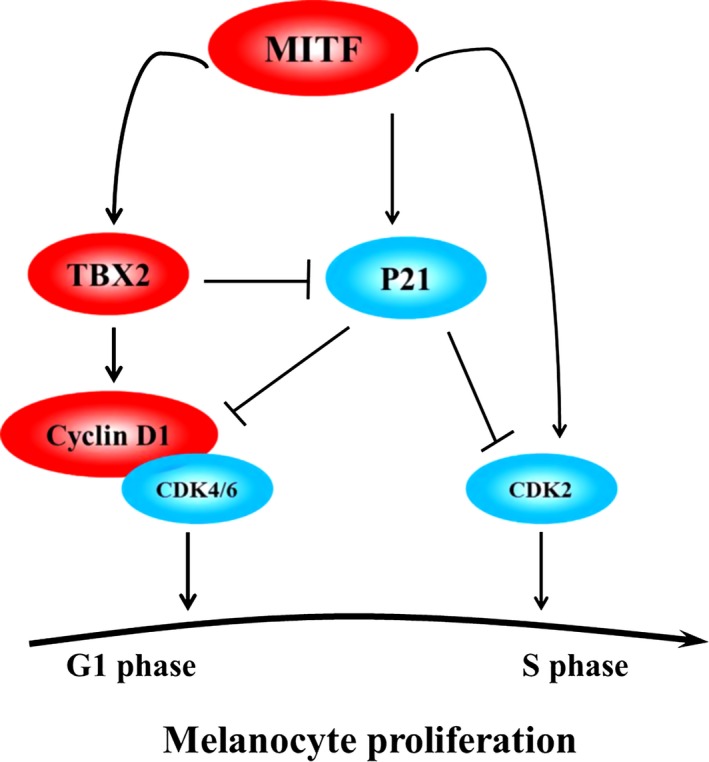
Diagram illustrating role(s) of MITF and TBX2 and other factors in pathways regulating melanocyte proliferation. MITF worked as a transcriptional activator to regulate target genes involved in melanocyte proliferation. During melanocyte proliferation, MITF activated Tbx2 and Tbx2 in turn stimulated Ccnd1 to promote cell proliferation. MITF also directly activated p21 and so inhibited cell proliferation. In addition, MITF can act through CDK2 to promote malignant melanoma proliferation. Hence, MITF‐TBX2‐Cyclin D1, MITF‐p21, and MITF‐CDK2 are regulatory pathways that act in parallel and may balance pro‐ and anti‐proliferative mechanisms in melanocytes and/or malignant melanoma cells. Data for this model are based on the findings from references 16, 24, 48, 49, 50 and this study.
It is also important to consider levels and activities of TBX2 as cells progress through the cell cycle. TBX2 levels are low in G1 and early S phase, rise in late S and G2 phase, and decrease at the onset of mitosis 47. As shown here, Tbx2 knockdown mainly induced G1 cell cycle arrest, likely because higher levels of TBX2 are needed to increase Cyclin D1 levels and promote S‐phase entry. This interpretation is in line with the facts that silencing of Ccnd1 causes G1/S arrest in vitro and inhibits malignant melanoma growth in vivo 33, 34. Our results strongly suggest that Tbx2 regulates cell proliferation through Ccnd1 both during melanocyte development and in malignant melanoma. Our findings may thus have implications not only for understanding the mechanisms of regulation of normal melanocyte proliferation but also for understanding and treatment of abnormal cell proliferation in malignant melanoma.
Conflict of interest
The authors state no conflict of interest.
Supporting information
Fig. S1 TBX2 directly activated Ccnd1.
Table S1. SiRNA and primer sequences.
Acknowledgements
We thank Drs Colin Goding, Dorothy Bennett, Ming Zhang, Boquan Jin, and Zhihai Qin for reagents, and Dr Heinz Arnheiter for reagents and thoughtful comments on the manuscript. This work was supported by the National Basic Research Program (973 Program, 2009CB526502), the National Natural Science Foundation of China (31171408, 31201031), the Zhejiang Provincial Natural Science Foundation (LZ12C12001, LQ13H120004, Y2101213) and the Research Grant of Wenzhou Medical University.
References
- 1. Hu N, Strobl‐Mazzulla PH, Bronner ME (2014) Epigenetic regulation in neural crest development. Dev. Biol. 396, 159–168. [DOI] [PMC free article] [PubMed] [Google Scholar]
- 2. Mort RL, Jackson IJ, Patton EE (2015) The melanocyte lineage in development and disease. Development 142, 620–632. [DOI] [PMC free article] [PubMed] [Google Scholar]
- 3. Cichorek M, Wachulska M, Stasiewicz A, Tymińska A (2013) Skin melanocytes: biology and development. Postepy Dermatol. Alergol. 30, 30–41. [DOI] [PMC free article] [PubMed] [Google Scholar]
- 4. Adameyko I, Lallemend F, Aquino JB, Pereira JA, Topilko P, Muller T et al (2009) Schwann cell precursors from nerve innervation are a cellular origin of melanocytes in skin. Cell 139, 366–379. [DOI] [PubMed] [Google Scholar]
- 5. Hou L, Pavan WJ (2008) Transcriptional and signaling regulation in neural crest stem cell‐derived melanocyte development: do all roads lead to Mitf? Cell Res. 18, 1163–1176. [DOI] [PubMed] [Google Scholar]
- 6. Yamaguchi Y, Hearing VJ (2009) Physiological factors that regulate skin pigmentation. Biofactors 35, 193–199. [DOI] [PMC free article] [PubMed] [Google Scholar]
- 7. Larue L, de Vuyst F, Delmas V (2013) Modeling melanoblast development. Cell. Mol. Life Sci. 70, 1067–1079. [DOI] [PMC free article] [PubMed] [Google Scholar]
- 8. Yu HS, Wu CS, Yu CL, Kao YH, Chiou MH (2003) Helium‐neon laser irradiation stimulates migration and proliferation in melanocytes and induces repigmentation in segmental‐type vitiligo. J. Invest. Dermatol. 120, 56–64. [DOI] [PubMed] [Google Scholar]
- 9. Nishimura EK (2011) Melanocyte stem cells: a melanocyte reservoir in hair follicles for hair and skin pigmentation. Pigment Cell Melanoma Res. 24, 401–410. [DOI] [PubMed] [Google Scholar]
- 10. Perlis C, Herlyn M (2004) Recent advances in melanoma biology. Oncologist 9, 182–187. [DOI] [PubMed] [Google Scholar]
- 11. Bonaventure J, Domingues MJ, Larue L (2013) Cellular and molecular mechanisms controlling the migration of melanocytes and melanoma cells. Pigment Cell Melanoma Res. 26, 316–325. [DOI] [PubMed] [Google Scholar]
- 12. Hodgkinson CA, Moore KJ, Nakayama A, Steingrimsson E, Copeland NG, Jenkins NA et al (1993) Mutations at the mouse microphthalmia locus are associated with defects in a gene encoding a novel basic‐helix‐loop‐helix‐zipper protein. Cell 74, 395–404. [DOI] [PubMed] [Google Scholar]
- 13. Arnheiter H (2010) The discovery of the microphthalmia locus and its gene, Mitf. Pigment Cell Melanoma Res. 23, 729–735. [DOI] [PMC free article] [PubMed] [Google Scholar]
- 14. Goding CR (2000) Mitf from neural crest to melanoma: signal transduction and transcription in the melanocyte lineage. Genes Dev. 14, 1712–1728. [PubMed] [Google Scholar]
- 15. Cheli Y, Ohanna M, Ballotti R, Bertolotto C (2010) Fifteen‐year quest for microphthalmia‐associated transcription factor target genes. Pigment Cell Melanoma Res. 23, 27–40. [DOI] [PubMed] [Google Scholar]
- 16. Carreira S, Goodall J, Aksan I, La Rocca SA, Galibert MD, Denat L et al (2005) Mitf cooperates with Rb1 and activates p21Cip1 expression to regulate cell cycle progression. Nature 433, 764–769. [DOI] [PubMed] [Google Scholar]
- 17. McGill GG, Horstmann M, Widlund HR, Du J, Motyckova G, Nishimura EK et al (2002) Bcl2 regulation by the melanocyte master regulator Mitf modulates lineage survival and melanoma cell viability. Cell 109, 707–718. [DOI] [PubMed] [Google Scholar]
- 18. Levy C, Khaled M, Robinson KC, Veguilla RA, Chen PH, Yokoyama S et al (2010) Lineage‐specific transcriptional regulation of DICER by MITF in melanocytes. Cell 141, 994–1005. [DOI] [PMC free article] [PubMed] [Google Scholar]
- 19. Levy C, Khaled M, Fisher DE (2006) MITF: master regulator of melanocyte development and melanoma oncogene. Trends Mol. Med. 12, 406–414. [DOI] [PubMed] [Google Scholar]
- 20. Hou L, Panthier JJ, Arnheiter H (2000) Signaling and transcriptional regulation in the neural crest‐derived melanocyte lineage: interactions between KIT and MITF. Development 127, 5379–5389. [DOI] [PubMed] [Google Scholar]
- 21. Hou L, Arnheiter H, Pavan WJ (2006) Interspecies difference in the regulation of melanocyte development by SOX10 and MITF. Proc. Natl. Acad. Sci. USA 103, 9081–9085. [DOI] [PMC free article] [PubMed] [Google Scholar]
- 22. Wen B, Chen Y, Li HR, Wang J, Shen J, Ma AB et al (2010) Allele‐specific genetic interactions between Mitf and Kit affect melanocyte development. Pigment Cell Melanoma Res. 23, 441–447. [DOI] [PMC free article] [PubMed] [Google Scholar]
- 23. Gallagher SJ, Rambow F, Kumasaka M, Champeval D, Bellacosa A, Delmas V et al (2013) Beta‐catenin inhibits melanocyte migration but induces melanoma metastasis. Oncogene 32, 2230–2238. [DOI] [PMC free article] [PubMed] [Google Scholar]
- 24. Carreira S, Liu B, Goding CR (2000) The gene encoding the T‐box factor Tbx2 is a target for the microphthalmia‐associated transcription factor in melanocytes. J. Biol. Chem. 275, 21920–21927. [DOI] [PubMed] [Google Scholar]
- 25. Papaioannou VE (2014) The T‐box gene family: emerging roles in development, stem cells and cancer. Development 141, 3819–3833. [DOI] [PMC free article] [PubMed] [Google Scholar]
- 26. Naiche LA, Harrelson Z, Kelly RG, Papaioannou VE (2005) T‐box genes in vertebrate development. Annu. Rev. Genet. 39, 219–239. [DOI] [PubMed] [Google Scholar]
- 27. Abrahams A, Parker MI, Prince S (2010) The T‐box transcription factor Tbx2: its role in development and possible implication in cancer. IUBMB Life 62, 92–102. [DOI] [PubMed] [Google Scholar]
- 28. Vance KW, Carreira S, Brosch G, Goding CR (2005) Tbx2 is overexpressed and plays an important role in maintaining proliferation and suppression of senescence in melanomas. Cancer Res. 65, 2260–2268. [DOI] [PubMed] [Google Scholar]
- 29. Rodriguez M, Aladowicz E, Lanfrancone L, Goding CR (2008) Tbx3 represses E‐cadherin expression and enhances melanoma invasiveness. Cancer Res. 68, 7872–7881. [DOI] [PubMed] [Google Scholar]
- 30. Carreira S, Dexter TJ, Yavuzer U, Easty DJ, Goding CR (1998) Brachyury‐related transcription factor Tbx2 and repression of the melanocyte‐specific TRP‐1 promoter. Mol. Cell. Biol. 18, 5099–5108. [DOI] [PMC free article] [PubMed] [Google Scholar]
- 31. Casimiro MC, Velasco‐Velázquez M, Aguirre‐Alvarado C, Pestell RG (2014) Overview of cyclins D1 function in cancer and the CDK inhibitor landscape: past and present. Expert Opin. Investig. Drugs 23, 295–304. [DOI] [PubMed] [Google Scholar]
- 32. Abrahams A, Mowla S, Parker MI, Goding CR, Prince S (2008) UV‐mediated regulation of the anti‐senescence factor Tbx2. J. Biol. Chem. 283, 2223–2230. [DOI] [PubMed] [Google Scholar]
- 33. Sauter ER, Yeo UC, von Stemm A, Zhu W, Litwin S, Tichansky DS et al (2002) Cyclin D1 is a candidate oncogene in cutaneous melanoma. Cancer Res. 62, 3200–3206. [PubMed] [Google Scholar]
- 34. Bhatt KV, Spofford LS, Aram G, McMullen M, Pumiglia K, Aplin AE (2005) Adhesion control of cyclin D1 and p27Kip1 levels is deregulated in melanoma cells through BRAF‐MEK‐ERK signaling. Oncogene 24, 3459–3471. [DOI] [PubMed] [Google Scholar]
- 35. Prince S, Carreira S, Vance KW, Abrahams A, Goding CR (2004) Tbx2 directly represses the expression of the p21(WAF1) cyclin‐dependent kinase inhibitor. Cancer Res. 64, 1669–1674. [DOI] [PubMed] [Google Scholar]
- 36. Giuliano S, Cheli Y, Ohanna M, Bonet C, Beuret L, Bille K et al (2010) Microphthalmia‐associated transcription factor controls the DNA damage response and a lineage‐specific senescence program in melanomas. Cancer Res. 70, 3813–3822. [DOI] [PubMed] [Google Scholar]
- 37. Strub T, Giuliano S, Ye T, Bonet C, Keime C, Kobi D et al (2011) Essential role of microphthalmia transcription factor for DNA replication, mitosis and genomic stability in melanoma. Oncogene 30, 2319–2332. [DOI] [PubMed] [Google Scholar]
- 38. Wansleben S, Davis E, Peres J, Prince S (2013) A novel role for the anti‐senescence factor TBX2 in DNA repair and cisplatin resistance. Cell Death Dis. 4, e846. [DOI] [PMC free article] [PubMed] [Google Scholar]
- 39. Yasumoto K, Mahalingam H, Suzuki H, Yoshizawa M, Yokoyama K (1995) Transcriptional activation of the melanocyte‐specific genes by the human homolog of the mouse Microphthalmia protein. J. Biochem. 118, 874–881. [DOI] [PubMed] [Google Scholar]
- 40. Paxton C, Zhao H, Chin Y, Langner K, Reecy J (2002) Murine Tbx2 contains domains that activate and repress gene transcription. Gene 283, 117–124. [DOI] [PubMed] [Google Scholar]
- 41. Sinha S, Abraham S, Gronostajski RM, Campbell CE (2000) Differential DNA binding and transcription modulation by three T‐box proteins, T, TBX1 and TBX2. Gene 258, 15–29. [DOI] [PubMed] [Google Scholar]
- 42. Lüdtke TH, Farin HF, Rudat C, Schuster‐Gossler K, Petry M, Barnett P et al (2013) Tbx2 controls lung growth by direct repression of the cell cycle inhibitor genes Cdkn1a and Cdkn1b. PLoS Genet. 9, e1003189. [DOI] [PMC free article] [PubMed] [Google Scholar]
- 43. Chen J, Zhong Q, Wang J, Cameron RS, Borke JL, Isales CM et al (2001) Microarray analysis of Tbx2‐directed gene expression: a possible role in osteogenesis. Mol. Cell. Endocrinol. 177, 43–54. [DOI] [PubMed] [Google Scholar]
- 44. Shirai M, Imanaka‐Yoshida K, Schneider MD, Schwartz RJ, Morisaki T (2009) T‐box 2, a mediator of Bmp‐Smad signaling, induced hyaluronan synthase 2 and Tgfbeta2 expression and endocardial cushion formation. Proc. Natl. Acad. Sci. USA 106, 18604–18609. [DOI] [PMC free article] [PubMed] [Google Scholar]
- 45. Davis E, Teng H, Bilican B, Parker MI, Liu B, Carriera S et al (2008) Ectopic Tbx2 expression results in polyploidy and cisplatin resistance. Oncogene 27, 976–984. [DOI] [PubMed] [Google Scholar]
- 46. Butz NV, Campbell CE, Gronostajski RM (2004) Differential target gene activation by TBX2 and TBX2VP16: evidence for activation domain‐dependent modulation of gene target specificity. Gene 342, 67–76. [DOI] [PubMed] [Google Scholar]
- 47. Bilican B, Goding CR (2006) Cell cycle regulation of the T‐box transcription factor tbx2. Exp. Cell Res. 312, 2358–2366. [DOI] [PubMed] [Google Scholar]
- 48. Lim S, Kaldis P (2013) Cdks, cyclins and CKIs: roles beyond cell cycle regulation. Development 140, 3079–3093. [DOI] [PubMed] [Google Scholar]
- 49. Ekholm SV, Reed SI (2000) Regulation of G(1) cyclin‐dependent kinases in the mammalian cell cycle. Curr. Opin. Cell Biol. 12, 676–684. [DOI] [PubMed] [Google Scholar]
- 50. Du J, Widlund HR, Horstmann MA, Ramaswamy S, Ross K, Huber WE et al (2004) Critical role of CDK2 for melanoma growth linked to its melanocyte‐specific transcriptional regulation by MITF. Cancer Cell 6, 565–576. [DOI] [PubMed] [Google Scholar]
Associated Data
This section collects any data citations, data availability statements, or supplementary materials included in this article.
Supplementary Materials
Fig. S1 TBX2 directly activated Ccnd1.
Table S1. SiRNA and primer sequences.


