

Abstract
Abstract. It is known that cell populations growing in different environmental conditions may exhibit different proliferation patterns. However, it is not clear if, despite the diversity of the so‐observed patterns, inherent cellular growth characteristics of the population can nevertheless be determined. This study quantifies the proliferative behaviour of the permanent endothelial human cell line, Eahy926, and establishes to which extent the estimation of the cell proliferation rate depends on variations of the experimental protocols. Cell proliferation curves were obtained for cells cultured over 16 days and the influences of cell seeding densities, foetal bovine serum content and frequency of culture medium changes were investigated. Quantitative dynamic modelling was conducted to evaluate the kinetic characteristics of this cell population. We proposed successive models and retained a nutrient‐depletion toxicity dependant model, which takes into account the progressive depletion of nutrients, as well as the increase of toxicity in the cell culture medium. This model is shown to provide a very good and robust prediction of the experimental proliferation curves, whatever are the considered frequency of culture medium changes and serum concentrations. Thus, the model enables an intrinsic quantification of the parameters driving in vitro EAhy926 proliferation, including proliferation, nutrient consumption and toxicity increase rates, rather independently of the experiments design. We therefore propose that such models could provide a basis for a standardized quantification of intrinsic cell proliferation kinetics.
INTRODUCTION
Proliferation rate is a key quantitative parameter to be estimated when studying the dynamic behaviour of a cell population. A precise quantification of this parameter is even more desirable when it is the landmark of the transformation of cells toward a malignant phenotype, as well as when the efficiency of proliferative or anti‐proliferative drugs has to be precisely assessed. A clear drawback for such precise quantification is that culture environmental conditions influence the proliferative characteristics of cells, while this environment is not fully controlled. In this case, variability of estimated proliferation rates would more likely reflect culture medium variability than real variations of inherent cell proliferation capabilities. For example, although serum‐free culture medium could provide a rather standard environment, serum is commonly used for sustaining cell proliferation over several days even if its effects are not completely known (Barakat et al. 1983; Gerharz et al. 1989). Indeed, serum is a complex mixture, including growth factors, extracellular matrix components, proteases, whose composition is largely variable and mainly unknown. Thus, even if 5% or 10% of foetal serum are commonly used as serum concentrations, such figures do not provide a reliable basis for standardization as the exact influence of the serum concentration on the cell growth pattern remain largely qualitative. In the same way, replacing the cell culture medium at given times by fresh solution is another means to sustain cell proliferation over several days or weeks. However, we do not know how such varying frequency of cell culture medium changes would bias the estimation of the cell proliferation rate from growth curves.
In this context, it appears especially interesting to investigate to which extent mathematical models provide a basis for a quantification of cell proliferation rate, which would be rather independent of the variability of the experimental conditions quoted previously.
This analysis is conducted for the characterization of the proliferative behaviour of the EAhy926 endothelial cells (Edgell et al. 1983), which is still lacking even if this human cell line is commonly used in in vitro studies of angiogenesis or cell apoptosis (Arai et al. 1998; Albini et al. 2000; Chau et al. 2003; Mosnier & Griffin 2003). We thus considered a set of cell proliferation curves obtained on a 16‐days time scale and we investigated the influence of different experimental conditions, including variations of cell seeding densities, foetal calf serum (FCS) content and frequency of culture medium changes. In order to establish to which extent the estimation of the cell proliferation rate was dependent of such experimental modifications, a quantitative dynamic modelling of all cell proliferation curves was conducted, starting from simple to more elaborate mathematical models.
In the literature, most of the studies devoted to the analysis of cell growth curves relies on a description of the rate of cell changes based either on linear growth‐rate model or on non‐linear growth models, including the well‐known Verhulst‐logistic (Verhulst 1838) and Gompertz models (Marusic et al. 1994; Chignola et al. 2000; Lopez et al. 2000; Castro et al. 2003). Such models may appropriately describe growth curves, as they take into account a limitation of the cell proliferation as a result of the carrying capacity of the environment or to cell contact inhibition. Thus, they remain mainly descriptive and do not quantify the relative influence of the underlying biological processes and microenvironmental factors (nutrients, serum content, toxicity) on cell proliferation and death. In order to analyse the global pattern of the experimental proliferation curves of EAhy926 cells, nutrient depletion‐toxicity dependant (NDTD) models are proposed in this work as an alternative to these usual models. Our aim is to identify intrinsic parameters of the cell proliferation patterns, with special attention to the possibility that cell proliferation rate could be estimated robustly, i.e. in a manner that can be independent of the proliferation assay design, including the frequency of cell culture medium changes. The model of minimal size we started with is presented in the first part of the paper. In pace with the fitting of our experimental growth curves, we then progress by increasing the model complexity, looking for an optimal structure, which accounts for the entire set of data obtained with the different experimental protocols we used. The estimation, from the global analysis of all these curves, of the parameters driving EAhy926 proliferation kinetics is presented. In the last section, we discuss how this modelling approach would help to define standardized cell culture protocols while reducing the dispersion of cell proliferation and death rates estimated under different experimental protocols or within different teams.
MATERIALS AND METHODS
Cell culture
Experiments were performed on human hybridized endothelial EAhy926 cell line. This cell line is derived from the fusion of HUVEC (human umbilical vein endothelial cells) with the A549 human lung epithelial carcinoma cell line (Edgell et al. 1983). Routinely, cells were cultured in 25‐cm2 culturing flasks in complete medium composed of Dulbecco's modified eagle medium (DMEM) supplemented with 2‐mm glutamine, 10% heat‐inactivated foetal calf serum (FCS) (V/V, Sigma‐Aldrich), penicillin (24 units/mL) and streptomycin (24 µg/mL) (Life Technologies, Rockville, MD, USA). Cell culture flasks were maintained in a humidified atmosphere under 5% CO2 in air at 37 °C. Cells were trypsinized each week in trypsine/EDTA (0.1%/0.02%) solution, suspended with complete medium and diluted to appropriate number, and then subcultured in the complete cell culture medium described previously. After cell confluence has been reached, cell number still increases if fresh medium is substituted to the current medium: this indicates that this cell line does not exhibit inhibition of proliferation by cell contacts.
Cell proliferation assays
Cells were seeded at the plating densities of 15.103 cells/cm2 or 30.103 cells/cm2 inside 24‐well culture dishes (2 cm2 well) with 2‐mL medium containing either 5% or 10% FCS and incubated at 37 °C in a humidified atmosphere with 5% CO2 in air. The evolution of cell density with time was followed over 16 days by cell counting realized at successive time intervals of 24 h. First, medium was removed and cells were gently rinsed in phosphate buffer saline (PBS) solution. Cell death was quantified by counting cells in suspension with a Malassez haemocytometer. Then, all adherent cells were incubated in 0.5 mL trypsin/EDTA solution at 37 °C for 2 min. These are live cells, as confirmed by trypan blue staining. After mechanical dispersion with a pipette tip, adherent alive cells were counted using a Malassez haemocytometer.
In order to analyse quantitatively the influence, on the cell proliferation curve, of substituting current culture medium by fresh medium, different experiments were conducted either without changing the cell culture medium (J0 assays), or with culture medium changes occurring at day 3 (J3 assays) or at days 3 and 6 (J3J6 assays) after plating. For each assay, cell counting was performed at least in three different wells at each sampling time.
pH measurements
The pH of cell culture medium was measured from the removed culture medium using a pH meter (Bioblock Scientific, Belgium) according to the manufacturer's protocol. Briefly, the electrode was rinsed with distilled water, before and between each measurement. A volume of 2 mL of cell culture medium was placed into a small glass tube at room temperature. The electrode was then quickly dipped into the tube and, after a time lag period of 30 s for reaching equilibrium, pH measurement was completed. All measurements were performed in triplicate.
Model development
We chose to start with a model of minimal size, before increasing its complexity in order to get an optimal structure that accounts for the overall sets of data obtained with the different experimental protocols defined above.
Derivation of a nutrient‐depletion model
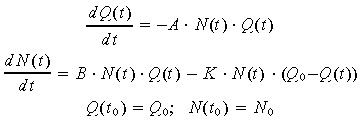
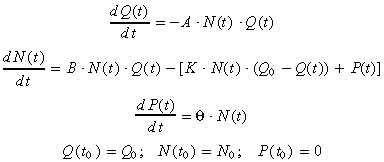
We are dealing with long‐term cell proliferation experiments, in which ultimately cell death predominates. Thus, none of the exponential, logistic or Gompertz models can fit our experimental data because these models cannot account for the decrease of cell number when time increases. In order to model both the increasing and decreasing parts of the experimental proliferation curves, we started by considering that cell proliferation is counter‐balanced by cell death and apoptosis, which are both controlled by the nutrient content Q(t) of the culture medium. We additionally assumed that this decrease in cell number N(t) can be simply modelled by a first order elimination process, controlled by a rate constant A, while cell death is monitored by the rate constant K (equation (1)). We expect the nutrient content to remain almost constant during the first days of cell culture, before being significantly consumed in pace with the increase of cell number in the culture wells. Alternatively, each substitution of the cell culture medium with fresh solution will restore the initial nutrient capacity Q 0 of the medium.
All these assumptions are gathered in the following nutrient‐depletion model (ND model) defined by the two‐variable non‐linear differential system:
 |
(1) |
where N 0 (cells/cm2) is the cell density at the beginning of the proliferation phase. There is a transitory phase after cell seeding, during which only a fraction of cells progressively adhere to the culture flask: thus the plating cell density Npl is not the initial cell density involved in the proliferation process. We thus consider as initial value N 0 the cell density at day 1 after plating. In addition, we evaluated the adhesion efficiency as the ratio N 0/Npl. Similarly, the initial value of the nutrient concentration corresponds to the value at day 1, since changes of nutrients concentration are surely non‐significant during this one day, mostly non‐proliferative, period.
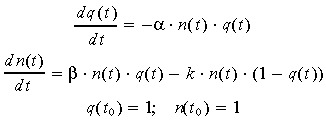
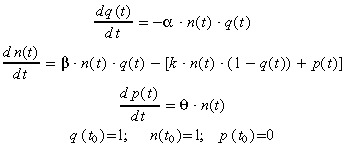
After normalization of these variables by the initial density N 0 and initial nutrient capacity Q 0, one gets the dimensionless variable system:
 |
(2) |
with q(t) = Q(t)/Q 0, n(t) = N(t)/N 0; k = K · Q 0; β = B · Q 0; γ = A · N 0
According to this model, the different experimental designs we used in our cell proliferation assays correspond to:
-
•
changes of the N 0 value when the initial number of seeded cells is changed;
-
•
changes of the Q 0 value when the percentage of FCS is changed;
-
•
reset of q(t) to 1 (Q(t) = Q 0) each time that fresh culture medium is substituted in the cell culture flasks.
Models simulations and data fitting
The dynamic behaviour of the non‐linear models proposed in this study are simulated by using a standard order‐2 Runge‐Kutta method as a numerical integration method. When analytical solutions of the associated differential systems can be obtained, they have been computed directly. In particular, we get for the differential system (2) n(t) as:
| (3) |
For each model, estimation of the unknown parameters was realized by fitting the predicted cell densities to the experimental proliferation curves. This fit to experimental data was implemented in an optimization procedure using a mean‐least‐squared criterion function as the error function to be minimized: estimated model parameters values thus correspond to a minimum of the residual sum of squares (RSS). A conjugated gradient method has been used as the minimization algorithm.
Model improvement and validation
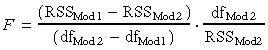
Starting from the initial nutrient‐depletion model defined by equation (1), different model extensions have been investigated in order to improve the fit to the experimental proliferation curves. Because adding more parameters generally decreases the residual sum of squares value RSS, comparison between models with different number of parameters was assessed by computing a F‐ratio from the RSS of each model, using the equation (Lopez et al. 2004):
 |
(4) |
where df denotes degrees of freedom of each model. Alternatively, we tested the improvement of the model by considering the corresponding values of both the Akaike's information criteria (AIC) (Akaike 1974) and the Schwarz's criteria (SC) (Schwarz 1978) given by:
| (5) |
where Np is the number of parameters of the model, and M is the number of data points used for the fitting procedure. These two criteria provide a balance between the data fitting precision reached by the considered model (first term of the criteria) and the search for the minimum number of parameters required to get this precision (second term). Accordingly, the best model according to these criteria is the one that minimizes the AIC and SC values. To evaluate the ability of each considered model to describe the experimental data without systematically over‐estimating or under‐estimating any section of the curve, the number of change of signs (or runs) of the residuals was checked.
RESULTS
The data given by the 12 sets of proliferation curves corresponding to the different variations of the standard experimental protocol (see Materials and methods section) have been analysed. The model fitted curves according to the nutrient‐depletion model (ND model) given by equation (2) were first analysed. In the second part of this section, two model extensions, which take into account cytotoxic effects induced by the metabolic activity of proliferating cells and by cellular death, were investigated. The situations in which these extended models provide a more satisfactory fit to the cell proliferation curves were analysed, in association with a more detailed and quantitative interpretation of the influence of cell culture medium changes on the balance between cell division and cell death.
Dependence of cell seeding density on EAhy926 proliferation patterns
To identify how plating cell density would affect cell proliferation estimation, plating density experiments were performed with cells seeded either at 15.103 cells/cm2 (standard conditions) or at 30.103 cells/cm2. Proliferation assays have been conducted without substitution of the cell culture medium. As expected, the maximum cell density is reached with the highest plating density (Fig. 1), with a steeper increase of the cell number during the growth phase. Corresponding adhesion efficiency, i.e. N 0/Npl values, are equal to 0.66 ± 0.09 and 0.62 ± 0.10 for plating densities of 15.103 cells/cm2 and 30.103 cells/cm2, respectively. The ND model fits quite remarkably the two sets of experimental data, as illustrated when superimposing the two fitted curves (Fig. 1c). Fitting the two sets of experimental data with the same set of parameter values provides a less accurate fit of the data with a RSS value of 102, to be compared to the sum of the RSS values of 12.4 and 32.8 obtained, respectively, when individual fit was performed on each data set (Table 1, assay 1). Nevertheless, the associated model parameter values (β = 0.567, k = 0.458, α = 7.65E–3) compared quite well to those given by individual curve fitting (see Table 1, assay 1). Considering the initial n 0 values of each curve as unknown parameters does not improve significantly this result, with a RSS of 98.8 and identified n 0 values of 0.58 and 1.03, respectively, while the experimental values are 0.66 ± 0.09 and 1.24 ± 0.20, respectively.
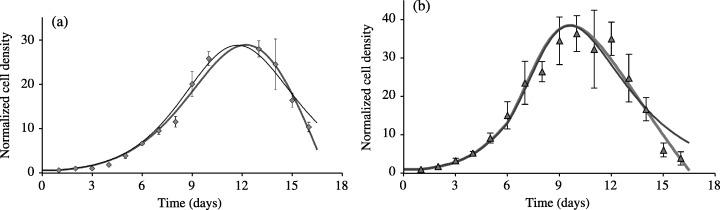
Figure 1.
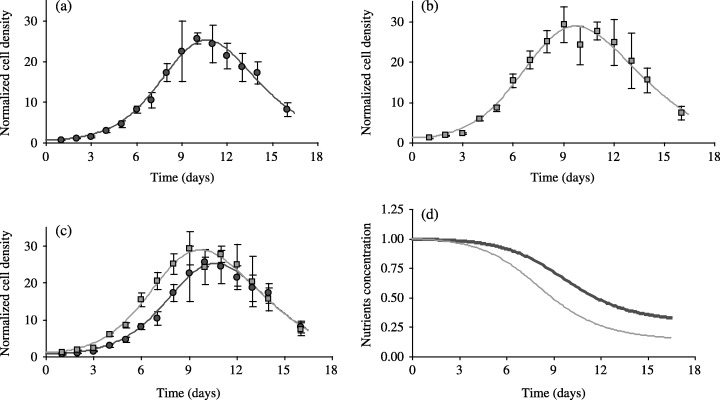
Dependence of the proliferative life span of EAhy926 cells on seeding density. Endothelial EAhy926 cells from the same subpopulation were plated at the seeding density of 15.103 cells/cm2 (Fig. 1a) and 30.103 cells/cm2 (Fig. 1b). Data are expressed as mean ± SD of cell densities counted in three different wells. Solid lines indicate the corresponding fit of the ND model to each set of data, considered separately. These curves were superimposed in Fig. 1c. The corresponding simulated evolution of the nutrient concentration of the cell culture medium is indicated in Fig. 1d, with the upper and thicker curve corresponding to the plating density of 15.103 cells/cm2. The culture medium remained the same in these experiments (J0 assay).
Table 1.
Estimated parameter values of the ND model using mean‐least squared fitting to the cell density data obtained with the different experimental cell culture protocols we considered. Figures correspond to normalized parameter values. Label J0 indicates no change of the cell culture medium, while labels J3 and J3J6 indicate changes of cell culture medium at day 3 and at days 3 and 6 after cell plating, respectively. Modifications of FCS content or cell plating density with regard to standard conditions are explicitly mentioned
| ND Model | Assay 1 J0 | Assay 1 J0 30 000 | Assay 1 J3J6 | Assay 2 J3 | Assay 2 J3J6 | Assay 3 J0 | Assay 3 J3 | Assay 4 J0 | Assay 4 J3 | Assay 4 J3J6 | Assay 3 J0 5% | Assay 3 J3 5% |
|---|---|---|---|---|---|---|---|---|---|---|---|---|
| β | 5.56E–01 | 5.69E–01 | 5.40E–01 | 6.43E–01 | 6.51E–01 | 4.96E–01 | 5.36E–01 | 6.19E–01 | 6.04E–01 | 5.49E–01 | 8.81E–01 | 9.35E–01 |
| k | 6.67E–01 | 4.38E–01 | 6.30E–01 | 2.99E–01 | 1.52E–01 | 2.01E+00 | 2.01E+00 | 3.50E–01 | 4.97E–01 | 8.62E–01 | 2.87E+00 | 3.28E+00 |
| α | 6.26E–03 | 7.36E–03 | 5.15E–03 | 1.08E–02 | 1.59E–02 | 2.49E–03 | 2.15E–03 | 1.17E–02 | 7.44E–03 | 4.72E–03 | 3.18E–03 | 2.12E–03 |
| RSS | 12.4 | 32.8 | 61.6 | 24.7 | 39.1 | 19.9 | 70.3 | 25.7 | 17.4 | 129 | 8.6 | 30.9 |
| AIC | 119.30 | 163.07 | 191.43 | 159.93 | 181.97 | 131.61 | 184.62 | 161.83 | 143.11 | 239.27 | 96.28 | 150.09 |
| SC | 124.72 | 168.49 | 196.85 | 165.54 | 187.59 | 136.82 | 189.83 | 167.45 | 148.72 | 244.88 | 101.49 | 155.30 |
In addition, the model predicts an associated decrease of the nutrient concentrations (Fig. 1d), which reach very low values after 2 weeks. The steeper slope variations are associated with the larger values of the cell number, the inflexion of the nutrient curve corresponding to the maximum cell density. The estimated values of the ND model parameters are given in Table 1 (assay 1). They are remarkably closed in both situations, which justifies that the same model accounts for the two situations, despite the variations of in the cell plating density.
Influence of culture medium changes on EAhy926 proliferation patterns
Cell culture assays often include changes of the cell culture medium in order to sustain cell proliferation. We quantified the influence of such changes on the cell proliferation kinetics by changing the cell culture medium one or two times during the growth phase, i.e. 3 days (J3) or 3 and 6 days (J3J6) after cell seeding. Figure 2 shows an example of the proliferation curves we obtained, other experimental conditions corresponding to the standard protocol. The increase in cell number is steeper with the J3J6 changes, but the ND model gives a quite satisfactory fit to both curves (Fig. 2a and b). Corresponding estimated values of the ND model parameters are given in Table 1 (assay 2). Remarkably, a still satisfactory fit to the experimental data is obtained when both curves are fitted simultaneously (Fig. 2c), i.e. when the same set of parameter values is used to describe the cell proliferation with these two different protocols. In this case, the fitting procedure gives an RSS of 107 for identified parameter values β = 0.650, k = 0.193, α = 0.0141, which are quite similar to those obtained from individual curve fitting (Table 1, assay 2). Considering the initial n 0 values of each curve as unknown parameters does not improve significantly this result, with an RSS of 97.0 and identified n 0‐values of 0.69 and 0.52, respectively, while the experimental values are 0.73 ± 0.06 and 0.65 ± 0.08, respectively. These results underline the model ability to provide intrinsic quantification of cell proliferation kinetics rather independently of protocol modifications.
Figure 2.
Influence of culture microenvironment on the proliferation of EAhy926 cells. Cells were plated at the seeding density of 15.103 cells/cm2 and cultured with 10% FCS (standard conditions). The cell culture medium was changed at day 3 (Fig. 2a) or at days 3 and 6 (Fig. 2b) after plating. Solid lines indicate the corresponding fit of the ND model to each data set, considered separately. Considering simultaneously both data sets, the description of the experimental data is still very satisfactory (Fig. 2c). The associated evolution of the nutrients content clearly shows the effect of the medium changes, either at day 3 (thin line) or at days 3 and 6 (thick line). Data are expressed as mean ± SD of cell densities counted in three different wells.
While the fit to the J3J6 curve (Fig. 2b) is quite good, a more careful examination reveals however, that the fit to the experimental data is not satisfactory in the last part of the curve (Fig. 2a): in this case, cell death is underestimated by the model. This behaviour is also observed when fitting other data sets (Fig. 3). This strongly suggests an extension of the ND model, which would explicitly include additional effects of the cell culture medium, with increasing medium toxicity as a first candidate. In order to test this hypothesis, we extended the model according to the modifications presented in succeeding discussions.
Figure 3.
Improved fit to the experimental data when considering the additional effect of medium toxicity on cell death. Data in Fig. 3a correspond to assay 3 and to cell densities measured when using 5% FCS medium with medium change occurring at day 3, while the experimental data of Fig. 3b correspond to the cell densities measured in assay 4 with medium changes occurring at days 3 and 6. Experimental data are expressed as mean ± SD of cell densities counted in three different wells. Thin solid lines are the results of the fit to the data using the ND model (Table 1), while thick solid lines show the results of the fitted data using the NDTD model (Table 2). The NDTD model gives an improved description of the sharp decrease in cell densities at the end of the experimental period.
Consideration of the increased toxicity of the cell culture medium
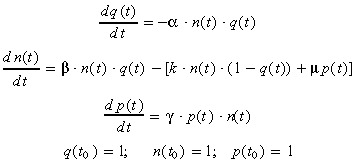
Different extensions of the ND model have been investigated in order to take into account cell culture medium toxicity as an additional parameter affecting cell death. We introduced the medium toxicity as an explicit new model‐variable P(t), and further assumed that the culture medium toxicity is proportional to the cell number. Thus, we retained the following three‐variable nutrient‐depletion toxicity‐dependant (NDTD) model:
 |
(6) |
After renormalization of the model variables by the initial values Q 0 and N 0, we get the following differential system defining the NDTD model:
 |
(7) |
with
| (8) |
Let us remark that both variables q(t) and p(t) have to be reset to their initial values 1 and 0 each time the cell culture medium is changed.
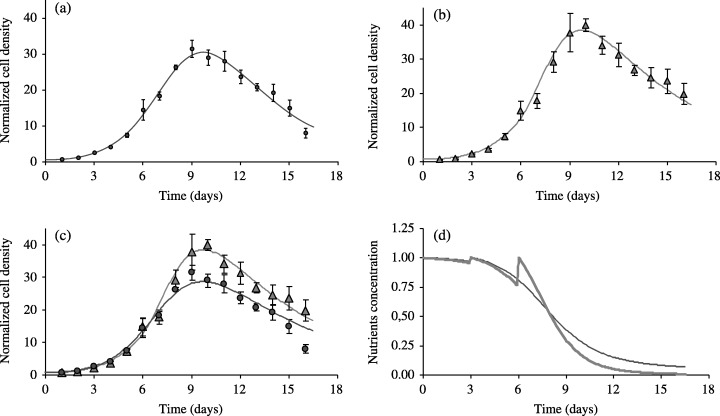
The mean experimental values obtained from the 12 proliferation assays are then re‐analysed to test the NDTD model. The parameter estimations are summarized in Table 2. Figure 4 exemplifies the results of the fitting procedure for assay 4, when the frequency of the cell culture medium changes were varied from no change (J0 assay) to changes occurring at day 3 (J3 assay) or at days 3 and 6 (J3J6 assay) after cell plating. The evolution with time of the nutrients concentration q(t) (Fig. 4d) and metabolites concentration p(t) (Fig. 4e) clearly incorporate such effects, with reset of the q(t) and p(t) values to their initial values corresponding to medium changes. The associated fitted curves to the cell densities data according to the NDTD model (Fig. 4a,b and c) are very satisfactory for all of the three sets of experiments, with a very good description of all phases of the cell proliferation patterns.
Table 2.
Estimated parameter values of the NDTD model using mean‐least squared fitting to the cell density data. Assays labelling is as in Table 1
| NDTD Model | Assay 1 J0 | Assay 1 J0 30 000 | Assay 1 J3J6 | Assay 2 J3 | Assay 2 J3J6 | Assay 3 J0 | Assay 3 J3 | Assay 4 J0 | Assay 4 J3 | Assay 4 J3J6 | Assay 3 J0 5% | Assay 3 J3 5% |
|---|---|---|---|---|---|---|---|---|---|---|---|---|
| θ | 0.00E+00 | 1.64E–02 | 1.41E–02 | 1.15E–02 | 0.00E+00 | 7.85E–03 | 0.00E +00 | 2.10E–02 | 0.00E+00 | 3.36E–02 | 3.58E–02 | 4.30E–02 |
| β | 5.56E–01 | 6.20E–01 | 5.58E–01 | 6.66E–01 | 6.51E–01 | 5.03E–01 | 5.36E–01 | 6.91E–01 | 6.04E–01 | 6.23E–01 | 9.96E–01 | 1.01E+00 |
| k | 6.67E–01 | 8.31E–02 | 2.99E–01 | 1.23E–01 | 1.52E–01 | 2.01E+00 | 2.01E+00 | 0.00E+00 | 4.97E–01 | 0.00E+00 | 3.19E–01 | 7.77E–01 |
| α | 6.26E–03 | 1.31E–02 | 7.47E–03 | 1.44E–02 | 1.59E–02 | 2.29E–03 | 2.15E–03 | 2.26E–02 | 7.44E–03 | 1.80E–02 | 7.77E–03 | 3.48E–03 |
| RSS | 12.4 | 25 | 55.1 | 21.4 | 39.1 | 18.2 | 70.3 | 12.5 | 17.4 | 71.8 | 7.4 | 17.6 |
| AIC | 121.30 | 152.85 | 188.41 | 155.04 | 183.97 | 129.86 | 186.62 | 129.23 | 145.11 | 213.15 | 92.06 | 128.45 |
| SC | 128.52 | 160.08 | 195.64 | 162.53 | 191.46 | 136.81 | 193.57 | 136.72 | 152.60 | 220.63 | 99.01 | 135.40 |
| AIC | −2.00 | 10.22 | 3.02 | 4.88 | −2.00 | 1.75 | −2.00 | 32.60 | −2.00 | 26.12 | 4.21 | 21.64 |
| Variation | ||||||||||||
| SC | −3.81 | 8.41 | 1.21 | 3.01 | −3.87 | 0.01 | −3.74 | 30.73 | −3.87 | 24.25 | 2.48 | 19.90 |
| Variation | ||||||||||||
Figure 4.
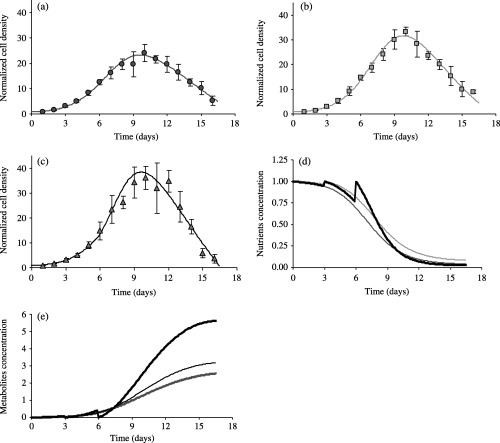
Robustness of the NDTD model predictions with regard to changes of the cell culture microenvironment. EAhy926 cells, initially from the same subpopulation, were cultured in standard conditions but then experienced different culture conditions: no change of the cell culture medium (a), medium change at day 3 after plating (b) or at days 3 and 6 after plating (c). Data are expressed as mean ± SD of cell densities counted in three different wells. The solid lines are the best‐fit curves of the NDTD model. Corresponding simulated evolution curves of the nutrient concentrations are plotted in (d). Resets of nutrient concentration to initial values correspond to the days where culture medium changes have been imposed. These resets are also visible on the curves showing the increase of the toxic metabolites concentrations p(t) with time (e). The successive curves corresponds to – medium changes at days 3 and 6 (top thick solid line) – medium change at day 3 (intermediate thin solid line), – no medium change (lower thick solid line).
Considering experimental protocols where both serum content and culture medium change defines a more constrained framework for the model validation. Figure 5 shows that the NDTD model successfully fits the different proliferation patterns obtained with (1) standard (10%) and low (5%) percentage of FCS and (2) with (J3 assay) or without (J0 assay) changes of the cell culture medium (assay 3 in 1, 2). The two different values of the serum content correspond to normalized values q(t 0) equal to 1 and 0.5, respectively. As expected, the simulated nutrients concentrations remain higher with 10% FCS (upper curves in Fig. 5d), with larger nutrient consumption when the cell culture medium remains the same during the overall experimental period. The corresponding simulated variations of cell density compare very satisfactorily to the experimental data in all situations, as shown in Fig. 5(a) (no medium change, with 10% or 5% FCS) and in Fig. 5(b) (medium change at day 3, with 10% or 5% FCS). Figure 5(c) shows that the validity of the NDTD model is furthermore reinforced by performing a simultaneous fit to two different sets of experimental data (5% FCS with or without medium changes at day 3). Despite of the protocol differences between these two proliferation assays, the fit to the corresponding two sets of experimental points is very satisfactory (RSS = 98.6, θ = 7.45E–2, β = 1.05, k = 0.21, α = 2.62E–3), with optimum initial values n 0 of each fitted curve equal to 0.79 and 0.82, respectively, i.e. close to the corresponding experimental values, which are 0.73 ± 0.16 and 0.78 ± 0.10, respectively.
Figure 5.

Influence of FCS concentrations on the proliferation of EAhy926 cells. Endothelial EAhy926 cells were cultured in DMEM with 10% or 5% FCS, without changing the cell culture medium (J0 assay) (a) or with medium change at day 3 after cell plating (J3 assay) (b). Experimental data are expressed as mean ± SD of cell densities counted in three different wells. Figure 5c gathers the two sets of data obtained in the 5% FCS culture conditions. Solid lines in (a) and (b) represent best‐fit curves obtained for each data set with the NDTD model. Solid lines in (c) are the NDTD predicted proliferation patterns when fitting simultaneously the two J0 assay (lower curve) and J3 assay (upper curve) conducted in medium with 5% FCS. The corresponding decrease of the medium nutrients concentration are plotted in (d), starting from an initial normalized value of 1 (10% FCS conditions) or 0.5 (5% FCS conditions). In each couple of curves, the upper thin solid line corresponds to situations where cell culture medium has been changed at day 3 after cell plating.
1, 2 provide an overview of the fitting results we obtained with both the ND model and the NDTD model. Remarkably, parameter β characterizing the cell proliferation is very accurately determined when considering the overall assays, whatever are the protocol variations with regard to the standard case. Considering the 10 values of the growth rate β identified for each experiment conducted, with different protocols, at a cell plating density of 15.103 cells/cm2, we get at most 10% variation around a mean value for parameter β equal to 0.576 ± 0.051 for the ND model (Table 1), and to 0.602 ± 0.061 for the NDTD model (Table 2).
The parameters α and k, controlling the limitation of the cell proliferation through a decrease of the nutrient concentration of the cell culture medium, exhibit more variability: indeed, as they both control the global cell death rate, the fit to the experimental data weighs their respective influence on the proliferation kinetics in a less restrictive way. For assay 3, both the ND and NDTD models indicate that cell death has a major effect on the cell growth pattern, compared to the nutrients consumption rate. Both processes act in a more balance manner in the other assays, with mean identified values of consumption rate α of 8.67 10−3 ± 3.83 10−3, while the mean value of the cell death rate k over the eight sets of experiments corresponding to assays 1, 2 and 4 (Table 1) is equal to 0.487 ± 0.228 for the ND model. Similar values are also obtained if considering the same protocol within different assays.
As illustrated in Fig. 3, the development of the NDTD model was motivated by the unsatisfactory fit of the ND model to some of the experimental data at the end of the experimental time, i.e. between days 13 and 16 after plating. The refined modelling of cell death process influenced by increased medium toxicity leads to a significant improvement of the fit to the data in these cases. For example, RSS in assay 4 decreases from 129 to 71.8 (J3J6 assay, 1, 2) and from 25.7 to 12.5 (J0 assay, 1, 2). In theses cases, the corresponding decrease of both Akaike's and Schwarz's criteria (Table 2) indicate that the NDTD model provides a better fit to the experimental data. Similar improvement was also obtained in experiments conducted with 5% FCS (assay 3, J3 assay). Lower differences between Akaike's and Schwarz's criteria values, ranging between 1.21 and 10.22 in 1, 2, respectively, further confirm the improved fit to the data. However, in situations where the ND model already gives a very good fit to the data, considering the additional parameter θ for the description of the cell death process does not lead to an improved representation of the cell proliferation patterns.
Extended validation of the NDTD model: correlation between cell density variation and pH modifications of the culture medium
The previous paragraph establishes that a refined analysis of the EAhy926 proliferation patterns can be obtained when considering the influence of medium toxicity on cell death. In order to support this hypothesis, we tried to correlate the increasing and decreasing phases of the EAhy926 proliferation curves to the pH variations of the cell culture medium. Indeed, the products of the cellular catabolism, which are released in cell culture medium, increase the [H+] concentration in pace with the rise of cell number. This increasing medium acidity is correlated with an increased toxicity of the microenvironment, which enhances cell death.
This correlation has been introduced explicitly in the NDTD model by first considering that the variable P(t) in equation 6 represents the [H+] concentration of the cell culture medium. However, such a direct substitution did not give rise to satisfactory representation of the experimental data. We thus investigated as an extended NDTD model the cell proliferation model, further called NDpHD model, described by the following system of differential equations:
 |
(9) |
where p(t) represents the normalized [H+] concentration of the cell culture medium (p(t) =[H+](t)/[H+]0), while µ is an additional parameter monitoring the influence of pH variation on cell death. Other model variables and parameters are defined as in equation 8, except parameter γ, which has been substituted to θ in the third differential equation as a control parameter of the non‐linear variation of the [H+] concentration. This non‐linearity, introduced to improve the fit to the experimental data, corresponds to a catalytic effect of the medium pH on the evolution of [H+] concentration. This indicates that cell catabolism is affected by the culture medium acidity, with an increased production of [H+], and thus an increased medium toxicity, when the medium pH decreases.
We explicitly considered assay 1, in which both influence of plating cell density and changes of the cell culture medium have been investigated. Corresponding estimations of the NDpHD model parameters are summarized in Table 3. Figure 6 shows that the NDpHD model fits quite remarkably the two sets of experimental data, i.e. the simultaneous variations of cell density and pH. This very satisfactory fit has been obtained in the three experimental contexts we considered, namely standard conditions (Fig. 6a and b), doubling of the cell plating density (Fig. 6c and d), and cell culture medium changes at days 3 and 6 after plating (Fig. 6e and f).
Table 3.
Estimated parameter values of the NDpHD model using mean‐least squared fitting to both the cell density data and pH measurements. Assays labelling is as in Table 1
| NDpHD model | Assay 1 J0 | Assay 1 J0 30 000 | Assay 1 J3J6 |
|---|---|---|---|
| µ | 5.40E–02 | 5.62E–02 | 5.78E–02 |
| γ | 2.03E–02 | 1.74E–02 | 1.66E–02 |
| β | 6.05E–01 | 6.17E–01 | 5.78E–01 |
| k | 2.50E–01 | 1.68E–01 | 2.81E–01 |
| α | 1.19E–02 | 1.26E–02 | 8.99E–03 |
| RSS n(t) | 13.6 | 24.20 | 56.4 |
| RSS pH(t) | 2.43 | 1.59 | 5.92 |
Figure 6.
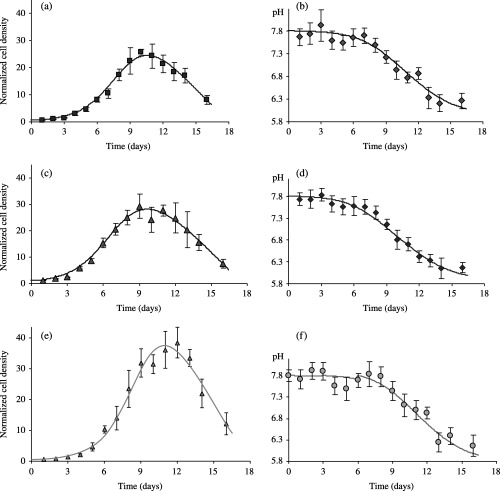
pH‐sensitive proliferation of EAhy926 endothelial cells. Cell numbering and measurements of cell culture medium pH were realized both in standard culture conditions already considered in Fig. 1 (no medium change, 10% FCS, plating density 15.103 cells/cm2) (a and b) and for two different modifications of this standard protocol, namely doubling cell plating density (30.103 cells/cm2) (c and d) or changing the culture medium at day 3 and day 6 after plating (e and f). The NDpHD model accounts very satisfactorily for the correlation between pH‐variation and the multiphasic aspect of the three‐different cell proliferation patterns, as indicated by the best‐fit curves (solid lines) obtained when simultaneously fitting cell densities and pH experimental data. Corresponding model parameters are given in Table 3. Data are expressed as mean ± SD of cell densities counted in three different wells.
DISCUSSION
A precise analysis of cell proliferation patterns is the usual prerequisite of numerous biological studies dealing either with adaptive proliferation to micro‐environmental variations in vitro, with developmental stage differences in cell proliferation, or with proliferative performance and optimization of proliferation capacity (Zhu et al. 2004). The design of appropriate culture systems thus require a precise knowledge of the cell proliferative behaviour, especially because most cultured cells grow in highly specialized and non‐standardized microenvironments. Thus, optimal serum concentrations for long‐term growth are usually unknown (Papini et al. 2003). In this context, supporting the description of cell proliferation patterns by explicative theoretical models appears necessary both for quantifying intrinsic cell proliferative performance within different experimental protocols, as well as for analysing the cell response to such micro‐environmental changes.
Sigmoidal functions, derived from the logistic, Gompertz or Richards equations (Lopez et al. 2004), generate little mechanistic insight on the factors influencing cell proliferative dynamics. We validated herein a class of flexible models, which explicit in a reproducible way the relationships between the decline of the growth rate, the availability of nutrients and toxicity evolution of the cell culture medium in pace with cell proliferative activity. We investigated how the growing phase of EAhy926 cells was directly related to seeding density in cell culture, as well as how progressive loss in proliferative capacity may result from increasing toxicity of the cell culture medium.
The nutrient depletion models we proposed offer a very satisfactory fit to the experimental data obtained trough different modifications of a standard protocol, namely doubling plating cell density, halving the serum content and changing the cell culture medium at different times during the cell culture. The large variety of nutrients composing the cell culture medium makes difficult a precise quantification of the evolution of its nutritive carrying capacity. Nevertheless, the results predicted by our models agree quite well with reported measurements on the consumption of glucose or glutamine and on the associated increase of some of their degradation products in cell cultures. Thus, Imamura et al. (1982) showed that a sharp decrease in glucose concentration occurs in pace with a sharp increase in cell number, with also a simultaneous increase of the lactate concentrations in the culture medium. Interestingly, both the glucose and the lactate concentration curves exhibit a sigmoidal shape, i.e. exhibit the temporal patterns predicted by the nutrient‐depletion models, as illustrated by the simulated variations of nutrients and metabolite reported in Fig. 4(d and e), respectively.
The estimated values of the parameters for the ND and NDTD models are quite close to each other. The proliferation rate is very accurately estimated, with no more than 10% of uncertainty over all the assays. Parameters characterizing (1) the respective influence of nutrients consumption on the loss in proliferative capacity on one hand, (2) the increase of cell death caused by both decreasing carrying capacity of the medium and increasing medium toxicity on the other hand, exhibit a larger variability. Because these processes act concurrently to decrease the slope of the proliferation curve, this variability is a measure of the respective contribution affected by the fitting procedure to each parameter. A sensitivity analysis confirms that the weight of each model parameter is not the same for each portion of the proliferation curve: for example, a steeper decrease of the cell density beyond 13 days of culture justifies the consideration of the toxicity rate parameter γ, while the same parameter does not improve the goodness‐of‐fit in experiments where the decrease of cell density is smoother. These alternative situations are due to the variability in experiments, as well as to the degree of cell population heterogeneity, including cells passaging. However, the values of the RSS for the NDTD model, as well as the corresponding values of the AIC and the SC criteria, are globally lower than those obtained with the ND model, suggesting that the former characterizes more accurately the variability of the EAhy926 proliferation patterns. Possible model refinement could also include the ratio of proliferating and non‐proliferating cells within the population.
Thus, the nutrient depletion‐toxicity dependant (NDTD) models here proposed appear as a sounded alternative to the standard models of cell proliferation for quantifying the influence of the microenvironment on cell proliferation and cell death. As in the study of Leroy and De Vuyst (2001) on the growth of lactobacilli, the NDTD model distinguishes between inhibitory effects as a result of increasing medium acidity and proliferation limitation caused by the exhaustion of nutrients. In addition to a more precise characterization of the proliferative behaviour of the commonly used EAhy926 endothelial cell line, our findings suggest that this model could be more widely considered as a potential tool for evaluating cell proliferation rates from heterogeneous proliferation curves obtained under different experimental conditions.
REFERENCES
- Akaike H (1974) A new look at the statistical model identification. IEEE Trans Automat Contr, 19, 716. [Google Scholar]
- Albini A , Marchisone C , Del Grosso F , Benelli R , Masiello L , Tacchetti C , Bono M , Ferrantini M , Rozera C , Truini M , Belardelli F , Santi L , Noonan DM (2000) Inhibition of angiogenesis and vascular tumor growth by interferon‐producing cells: a gene therapy approach. Am J Pathol, 156, 1381. [DOI] [PMC free article] [PubMed] [Google Scholar]
- Arai T , Kelly SA , Brengman ML , Takano M , Smith EH , Goldschmidt‐Clermont PJ , Bulkley GB (1998) Ambient but not incremental oxidant generation effects intercellular adhesion molecule 1 induction by tumour necrosis factor alpha in endothelium. Biochem J, 331, 853. [DOI] [PMC free article] [PubMed] [Google Scholar]
- Barakat I , Labourdette G , Sensenbrenner M (1983) Inhibitory effects of fetal calf serum on proliferation of chick neuroblasts in culture. Dev Neurosci, 6, 169. [DOI] [PubMed] [Google Scholar]
- Castro MA , Klamt F , Grieneisen VA , Grivicich I , Moreira JC (2003) Gompertzian growth pattern correlated with phenotypic organization of colon carcinoma, malignant glioma and non‐small cell lung carcinoma cell lines. Cell Prolif, 36, 65. [DOI] [PMC free article] [PubMed] [Google Scholar]
- Chau YP , Lin SY , Chen JH , Tai MH (2003) Endostatin induces autophagic cell death in EAhy926 human endothelial cells. Histol Histopathol, 18, 715. [DOI] [PubMed] [Google Scholar]
- Chignola R , Schenetti A , Andrighetto G , Chiesa E , Foroni R , Sartoris S , Tridente G , Liberati D (2000) Forecasting the growth of multicell tumour spheroids: implications for the dynamic growth of solid tumours. Cell Prolif, 33, 219. [DOI] [PMC free article] [PubMed] [Google Scholar]
- Edgell CJ , McDonald CC , Graham JB (1983) Permanent cell line expressing human factor VIII‐related antigen established by hybridization. Proc Natl Acad Sci USA, 80, 3734. [DOI] [PMC free article] [PubMed] [Google Scholar]
- Gerharz CD , Gabbert HE , Biesalski HK , Engers R , Luley C (1989) Fetal calf serum and retinoic acid affect proliferation and terminal differentiation of a rat rhabdomyosarcoma cell line (BA‐HAN‐1C). Br J Cancer, 59, 61. [DOI] [PMC free article] [PubMed] [Google Scholar]
- Imamura T , Crespi CL , Thilly WG , Brunengraber H (1982) Fructose as a carbohydrate source yields stable pH and redox parameters in microcarrier cell culture. Anal Biochem, 124, 353. [DOI] [PubMed] [Google Scholar]
- Leroy F , De Vuyst L (2001) Growth of the bacteriocin‐producing Lactobacillus sakei strain CTC 494 in MRS broth is strongly reduced due to nutrient exhaustion: a nutrient depletion model for the growth of lactic acid bacteria. Appl Environ Microbiol, 67, 4407. [DOI] [PMC free article] [PubMed] [Google Scholar]
- Lopez S , France J , Gerrits WJ , Dhanoa MS , Humphries DJ , Dijkstra J (2000) A generalized Michaelis‐Menten equation for the analysis of growth. J Anim Sci, 78, 1816. [DOI] [PubMed] [Google Scholar]
- Lopez S , Prieto M , Dijkstra J , Dhanoa MS , France J (2004) Statistical evaluation of mathematical models for microbial growth. Int J Food Microbiol, 96, 289. [DOI] [PubMed] [Google Scholar]
- Marusic M , Bajzer Z , Freyer JP , Vuk‐Pavlovic S (1994) Analysis of growth of multicellular tumour spheroids by mathematical models. Cell Prolif, 27, 73. [DOI] [PubMed] [Google Scholar]
- Mosnier LO , Griffin JH (2003) Inhibition of staurosporine‐induced apoptosis of endothelial cells by activated protein C requires protease‐activated receptor‐1 and endothelial cell protein C receptor. Biochem J, 373, 65. [DOI] [PMC free article] [PubMed] [Google Scholar]
- Papini S , Cecchetti D , Campani D , Fitzgerald W , Grivel JC , Chen S , Margolis L , Revoltella RP (2003) Isolation and clonal analysis of human epidermal keratinocyte stem cells in long‐term culture. Stem Cells, 21, 481. [DOI] [PubMed] [Google Scholar]
- Schwarz G (1978) Estimating the dimension of a model. Ann Statist, 6, 461. [Google Scholar]
- Verhulst PF (1838) Notice sur la loi que la population suit dans son accroissement. Corr Math Et Phys, X, 113. [Google Scholar]
- Zhu H , Tamot B , Quinton M , Walton J , Hacker RR , Li J (2004) Influence of tissue origins and external microenvironment on porcine fetal fibroblast growth, proliferative life span and genome stability. Cell Prolif, 37, 255. [DOI] [PMC free article] [PubMed] [Google Scholar]