

Abstract
Abstract. Objective: Cancer stem cells have been identified as the growth root for various malignant tumours and are thought to be responsible for cancer recurrence following treatment. Materials and methods: Here, a predictive mathematical model for the cancer stem cell hypothesis is used to understand tumour responses to chemotherapeutic drugs and judge the efficacy of treatments in arresting tumour growth. The impact of varying drug efficacies on different abnormal cell populations is investigated through the kinetics associated with their decline in response to therapy. Results and conclusions: The model predicts the clinically established ‘dandelion phenomenon’ and suggests that the best response to chemotherapy occurs when a drug targets abnormal stem cells. We compare continuous and periodic drug infusion. For the latter, we examine the relative importance of the drug cell‐kill rate and the mean time between successive therapies, to identify the key attributes for successful treatment.
INTRODUCTION
According to the cancer stem cell hypothesis, just as mature cells in some systems are maintained by self‐renewing stem cells, malignant tumours occur through mutations of healthy stem and early progenitor cells, in the corresponding abnormal cells (Al‐Hajj & Clarke 2004; Clarke 2004). Thus, understood, tumours consist of progeny of abnormal stem or progenitor cells (Reya et al. 2001; Pardal et al. 2003; Clarke 2004; Singh et al. 2004). A key contention of the hypothesis is that only a small subset of tumour cells has the ability to proliferate rapidly in many types of cancer. Consequently, because it is likely that cancerous stem cells are often responsible for recurrences that occur after conventional treatment, treatments must target cancer stem cells in order to eliminate the disease.
The transformation of stem cells into a malignant phenotype requires fewer mutations than are required to ectopically activate a more differentiated cell. Because stem cells are self‐renewing they often persist for longer periods and are thus more likely to accumulate mutations than a shorter‐lived progenitor or differentiated cell. Such progenitor cells inheriting mutations from a stem cell can also itself undergo further mutations to cause transformation. Malignant cells that arise after such mutations disrupt normal signalling pathways and usurp the self‐renewal machinery that is normally the property only of stem cells. Consequently, many pathways associated with normal stem cell renewal are also implicated in oncogenesis, for example, Bmi‐1 (Lessard & Sauvageau 2003; Molofsky et al. 2003), Sonic Hedgehog (Taipale & Beachy 2001) and Wnt (Polakis 2000; Taipale & Beachy 2001). The literature cites several techniques for mathematical modeling of haematopoietic, neural and embryonic stem cells (Viswanathan & Zandstra 2003), plus for cells of chronic myeloid leukaemia (CML) (Komarova & Wadarz 2005; Michor et al. 2005; Roeder et al. 2006). We (Ganguly & Puri 2006) have previously extended a compartmental method (Wichmann & Loeffler 1984) to formulate a predictive mechanistic mathematical model for a process based on a cancer stem cell hypothesis (Reya et al. 2001; Al‐Hajj & Clarke 2004; Clarke 2004; Singh et al. 2004).
Ineffective targeting of the abnormal stem cell population within tumours can lead to therapeutic failures and cancer recurrence (Al‐Hajj et al. 2004; Polyak & Hahn 2006). Most cytotoxic chemotherapeutic agents target the more rapidly proliferating progenitor cells during the cancer cell transit amplification stage (in which progenitor or amplifying cells expand the differentiating cell population through a series of symmetric divisions, Mackenzie 2005). Therefore, it is possible that the slower proliferating cancer stem cells can survive these treatments.
Our objective herein is to characterize tumour cell responses to chemotherapeutic drugs. We consider impact of different drug efficacies on various abnormal cell populations by observing the kinetics (e.g. imposed by the cell‐kill rate) associated with their reduction in response to therapy. Such observations can help provide insight into disease responsiveness and resistance (Huntly & Gilliland 2005; Michor et al. 2005). Overall efficacies of continuous and periodic drug therapy in arresting tumour growth are compared and different modes of drug infusion and their outcomes are also examined. Finally, the relative importance of the cell‐kill rate is demonstrated through a parametric study. These results could assist clinicians by providing comparative information on several possible chemotherapy modes and by identifying the key attributes of a successful therapy.
THE MODEL
Our model is schematically described in Fig. 1(a). It consists of two pathways, one normal and the other an abnormal path that occurs due to stem and early progenitor cell mutations. It is based on an evolutionary perspective, which assumes that cells regularly undergo mutations in their DNA. While the vast majority of these mutations are detrimental to cell survival, some cells, particularly those capable of self‐renewal, infrequently survive the mutations. They subsequently drive the formation and pathology of the neoplasia (Clarke 2004). The model incorporates the role of internal cell signalling during proliferation. Hence, it is self‐regulating; that is, normal cell signalling limits healthy cell proliferation to a steady value that is sufficient to replenish any steady death (apoptosis) of mature cells.
Figure 1.

(a) Cancer stem cell model showing the cell‐signalling pathway, and the action of a chemotherapeutic drug. (b) Instantaneous infusion rate ‘a’ for different modes of chemotherapeutic drug dosing, that is, continuous infusion, periodic infusion. Here, τdrug denotes the time period between two consecutive drug doses, τcycle the duration of non‐zero infusion rate in a cycle, and amax the instantaneous peak infusion rate.
Other than tissue evasion and metastasis (since it does not consider cell transport), the model accounts for the remaining five hallmarks of malignancy (Hanahan & Weinberg 2000), These include (i) self‐sufficiency in growth signals, (ii) insensitivity to antigrowth signals (which taken together represent the loss of regulation and signalling in abnormal cells), (iii) limitless replicative potential (i.e. the basis of the cancer stem cell hypothesis), (iv) acquisition of resistance to apoptosis and (v) sustained angiogenesis (here, we can incorporate different carrying capacities for the healthy and abnormal cell populations). We have previously used the model to confirm that mutations leading to malignant change are more significant when they occur in stem cells than in early progenitor cells. We have concluded in that investigation that cancer risk increases with increasing frequency of injury, for example, with a repeated insult that depletes the mature cell population (Ganguly & Puri 2006). While the model was deterministic (not stochastic), randomness could be readily included by changing various parameters [such as those reported in 1, 2 of Ganguly & Puri (2006)].
Table 1.
Parameters used in the model
| Parameter | Ssymbls | Values |
|---|---|---|
| Cell cycle time for SC, EP, LP compartments | τSC, τEP, τLP | 12 h |
| Cell maturation time for LP compartment | τm | 40 h |
| Self‐renewal probability upper and lower limits for SC | Pmax,SC, Pmin,SC | 0.6, 0.4 |
| Self‐renewal probability upper and lower limits for EP | Pmax,EP, Pmin,EP | 0.5, 0.5 |
| Upper and lower limits of mitotic fractions for stem cells | αmax,SC, αmin,SC | 1, 0.01 |
| Upper and lower limits of mitotic fractions for EP cells | αmax,EP, αmin,EP | 1, 0.3 |
| Number of EP cell self‐renewals | k | 5 |
| Upper and lower limits of the number of mitotic cycles | nLP,max, nLP,min | 3, 9 |
| Death rate (apoptosis) of MC |
 0,MC (in AU)
 |
0.01 |
| Death Rate (apoptosis) of AP |
0,AP (in AU) |
0.01 |
| Carrying capacity of healthy and abnormal cells | Θhealthy cells, Θa (in AU) | 1000, 100 |
| Rate at which drug becomes ineffective due to cell kill | γ (in AU) | 0.01 for healthy cells 0.05 for abnormal cells |
| Drug decay rate | λ (in AU) | 0.01 |
| Duration of infusion in one therapy cycle | τcycλɛ | 25 h |
| Peak infusion rate | amax (in AU) | 0.5 |
Table 2.
SCA and AP size at t = 2000 h expressed as percentages of their corresponding populations in absence drug therapy (amax = constant)
| SCA | AP | |
|---|---|---|
| τdrug = ∞ | 100 | 100 |
| τdrug = 500 h | 85.7 | 85.1 |
| τdrug = 100 h | 43.1 | 46.8 |
| τdrug = 25 h | 11.6 | 14.9 |
| τdrug = 0 | 5.6 | 8.5 |
Cell fate choices in the model are assumed to arise from soluble signals that establish a concentration gradient. This enables cells within the gradient to adopt alternate, ‘all‐or‐none’ fates at critical threshold signal levels (Jessel & Lumsden 1997; O’Neill & Schaffer 2004). We assume that the concentration gradient becomes negligible when the mature cell population reaches a desired sustainable level (there is an upper signalling threshold). The growth mechanisms and factors influencing stem cell self‐renewal are considered to be the same for both normal and abnormal stem cells (Oliver & Wechsler‐Reya 2004). Thus, self‐renewal probabilities for both normal and abnormal (or mutated) stem cells are identical, as are those for normal and abnormal early progenitor cells.
Stem cells (SC) are assumed to self‐renew an unlimited number of times (Al‐Hajj & Clarke 2004) with a self‐renewal probability PSC. Those that do not self‐renew, differentiate to form early progenitor cells (EP). The self‐renewal probability varies between a maximum Pmax,SC and a minimum Pmin,SC depending on the stem cell, and early and late progenitor cell (LP) populations. Self‐renewal probability of early progenitor cells PEP likewise lies between Pmax,EP and Pmin,EP depending on their respective cell populations. The model constrains early progenitor cells to self‐renew a limited number of times k (Al‐Hajj & Clarke 2004). Late progenitor cells undergo nLP stages of cell division and produce mature cells (MC). Cell division regulatory feedback signalling controls the number of cell division stages between nLP,min and nLP,max. A regulatory signal is responsible for maintaining a steady population of mature cells. The mature cell population also provides feedback to the stem cells thereby influencing their mitotic fraction and self‐renewal rate. Regulatory feedback signals are represented by dotted lines that are numbered j through n in Fig. 1(a)[for which the mathematical representations are summarized in Table 2 of Ganguly & Puri (2006)].
The probabilities MSC and MEP represent occurrence of oncogenic mutation during DNA transcription for each cell division event involving stem cells or early progenitor cells. If mutation occurs, one daughter cell acquires the mutated gene following cell division while the other retains the original DNA. Thus mutation of SC leads to formation of abnormal stem cells (SCA). Abnormal early progenitor cells can be formed either due to mutation in EP cells, or through differentiation of SCA. Subsequent differentiation of EPA leads to formation of abnormal progeny (AP). In our model, this AP population is the precursor of malignancy. Any increase or reduction in its size is presumed to be an equivalent increase or decrease of the risk of malignancy. Cancer arises when a cell with a mutated gene acquires the ability to proliferate indefinitely through the accumulation of at least C mutations. Due to uncontrolled proliferation, thereafter the associated cell cluster produces a malignant tumour (Reya et al. 2001). We consider each cell type as a separate compartment that has an individual rate expression for its cell population growth. The model also considers rates of apoptosis
0,MC and
0,AP for MC and AP, respectively.
CHEMOTHERAPEUTIC TREATMENT
It is possible to design chemotherapeutic drugs with selective efficacies towards different cell populations. Hence, we assume that when a drug is supplied it influences a particular cell sub‐compartment with a specific efficacy. We therefore have assigned separate cell‐kill rates µ for different healthy and abnormal cell compartments to account for this selectivity. This assumption is consistent with previous observations, for example, imatinib inhibits more than 90% of CML progenitor cell growth in vitro in the 1–10 µM concentration range but shows little activity against normal haematopoietic progenitors (Huff et al. 2006).
MATHEMATICAL DETAILS
The basic model for healthy and cancer stem cell pathways is described by Ganguly & Puri (2006). In this paper, the effect of a chemotherapeutic drug on the cell population equation is included in terms of its cell‐kill rate µ. Each cell type has also been assumed to have its own carrying capacity Θ[an upper limit to which cell growth is limited, for example, by a bounded nutrient supply rate to the growing cell population, Byrne (2003)]. Thus, the cell proliferation relation accounting for drug therapy is
| (1) |
where N denotes the cell population, = (α/τ) ln(2) the cell division rate (where α is the proliferative fraction and τ the cell cycle time). The average drug concentration A is determined from the expression
| (2) |
Equation (2) indicates that the net rate of change of drug concentration in a cellular matrix is a function of the drug infusion rate a(t), the natural drug decay (due to chemical decomposition of the drug or its transport, both associated with the decay rate λ) and the rate γAN at which the drug becomes ineffective due to cell‐kill rate. The last terms in (1), (2) are related but γ and µ can have different numerical values. With the modification described in Equation (1), the rate of change in a cell population is also modified as follows.
Healthy cell compartments
For all healthy cell compartments (depicted on the upper pathway of the schematic diagram in Fig. 1a), an average cell‐kill rate µhealthy cells and an average carrying capacity ΘH are assumed.
Stem cell compartment (population N SC):
| (3) |
Early progenitor compartment (consisting of k sub‐compartments, each with a population
 ):
):
| (4a) |
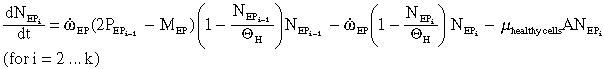 |
(4b) |
Total efflux of differentiated EP cells that enter the LP compartment:
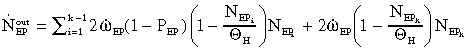 |
(5a) |
 |
(5b) |
Late progenitor cell compartment (population N LP):
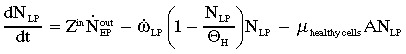 |
(6a) |
where  and τg (=τLP/αLPln2) and τm denote cell generation time and cell maturation time, respectively (Ganguly & Puri 2006).
 |
(6b) |
Mature cell compartment (population N MC):
| (7) |
Abnormal stem cell compartment
Following Ganguly & Puri (2006), abnormal stem cells are assumed to have the same self‐renewal rates PSC and proliferative fractions (therefore, the same values of
SC) as their healthy counterparts. Similarly, abnormal EP cells also have the same values of PEP and
EP as healthy EP cells. For the abnormal cell population, the drug is assumed to have selective kill rates µSCA, µEPA, and µAP, respectively. A separate carrying capacity Θa is considered for the abnormal cells.
Abnormal stem cell compartment:
| (8) |
Abnormal early progenitor cell compartment:
 |
(9a) |
 |
(9b) |
The efflux of abnormal EP cells
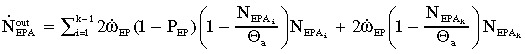 |
(10) |
Abnormal progeny compartment:
| (11) |
DISCUSSION
(2), (3), (4a), (4b), (5a), (5b), (6a), (6b), (7), (8), (9a), (9b), (10), (11) were numerically solved using a time marching scheme, and the parameters specified in Table 1 of Ganguly & Puri (2006). The model has previously been tested by Ganguly & Puri (2006) for its stability and steady state response. We have demonstrated that SC mutations have a much larger proliferation potential than mutations in EP cells. Thus, mutations leading to malignancy are more significant when they occur in stem cells than in early progenitor cells. The model predicts that repeated insult increases the proportion of the stem cell population that participates in cell division thereby enhancing the growth rate of abnormal progeny.
Here, we have modeled the effects of both the continuous and of the periodic infusion of a drug on (healthy and abnormal) cells. During continuous infusion, drug dose is constant over the entire duration of chemotherapy. During periodic dosing, drug infusion occurs every τdrug hours and, consequently, the instantaneous drug concentration decays due to inactivation both through cell kill and to the natural decay of the drug. Perhaps, the simplest representation of temporal drug decay is through the saw‐tooth curve described schematically in Fig. 1(b), which we have incorporated into our model.
We have considered various periodic dosing times τdrug. Drug infusion is initiated every τdrug hours with a maximum infusion rate amax that linearly decreases to 0 after τcycle hours. In order to analyze chemotherapeutic effects at different dosing frequencies, amax can either be held constant irrespective of the value of τdrug or it can be assumed to have an inverse relationship with it. In the latter case, the total amount of infused drug (a* =  ) is conserved over a specified treatment time, that is, the same total dose is always infused irrespective of the dosing frequency. For the former type of periodic dosing (when amax is maintained constant), a* is not conserved but is inversely proportional to τdrug. In this case, the more frequent the dosing the larger the value of a*. Figure 1(b) illustrates three drug infusion models for which a* is conserved, one of which is continuous and the other two are periodic with values of τdrug= 100 h and 250 h.
The overall drug efficacy is characterized through its effect on abnormal progeny size. Here, we have assumed that the size of a like cell mass is proportional to the cell population within a compartment. The dynamic response of our model is compared to experimental results of Michor et al. (2005) and Roeder et al. (2006). These teams have found that successful therapy exhibits a biphasic exponential decline in leukaemic cells in imatinib‐treated CML. Experimental data (◆, □ and ▴) in Fig. 2 demonstrate the heterogeneous response of the BCR‐ABL1 transcript levels. The primary effect (exhibited through a steep decline) was induced by initial reduction of proliferating BCR‐ABL1‐positive cells due to the assumed degradation effect. The later moderate decline was largely based on changes in regulatory response of the system due to reduced stem cell numbers. Roeder et al. (2006) successfully modeled this effect by assuming different values of imatinib‐induced degradation, rdeg. The closest analogue to the parameter rdeg in our model is the cell‐kill rate, µSCA. Results from our model presented in Fig. 2 predict a similar response for AP cells under continuous infusion for three different µSCA values (µSCA= 0.5, –·–; µSCA= 0.4, ··········; and µSCA= 0.5, —). Consistent with the experiments, the simulations show an initially rapid decline in AP cell population that is followed by a slower response. Results presented in Fig. 2 clearly suggest that our model predictions are consistent with clinically determined trends for chemotherapeutic response in imatinib‐treated CML cases.
Figure 2.

Response of the BCR‐ABL1 transcript levels in imatinib‐treated CML cases (the experimental data ◆ and ▴ are from Michor et al. 2005; □ is from Roeder et al. 2006). Our model (plotted against the secondary axis) also predicts a similar biphasic response using different cell‐kill rates (that are analogues of the parameter rdeg in Roeder et al. 2006), that is, µSCA= 0.3, –·– µSCA= 0.4, ········; and µSCA= 0.5, —.
Figure 3 depicts the response of the AP size to therapy. We have assumed that after a tumour is detected, therapy is initiated at 500 h and treatment continues until 2000 h. Both continuous and periodic infusion are examined with τdrug= 100 h and τcycle= 25 h for the periodic case. Drug efficacies for the different abnormal cell populations are varied but the effect of the drug on healthy cells (µhealthy cells= 0.01 in arbitrary units, AU) is always the same.
Figure 3.
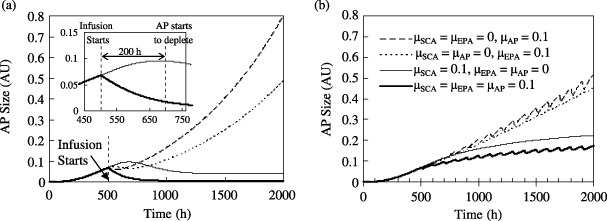
Effect of selective efficacy (represented in terms of the cell‐kill rate, µ) of the chemotherapeutic drug on the abnormal progeny size. The panels show the growth rate of AP over time with (a) a continuous injection rate of 0.5 units, and (b) periodic infusion of amax= 0.5 units. Each session of drug infusion occurs over τcycle= 25 h, and the time period τdrug between two consecutive infusions is 100 h. For both cases, µhealthy cells= 0.01. Drug infusion begins at t = 500 h. The inset in Fig. 3(a) shows an enlarged view of the response lag of the AP population to a drug that is selective to AP alone in comparison with one that is selective to SCA only. The legends for the curves are identical for Fig. 3(a), its inset, and for Fig. 3(b).
The results show that the AP size diminishes by the largest extent when a drug has equally vigorous effects on the SCA, EPA and AP compartments (here µSCA=µEPA=µAP= 0.1). However, such equivalent effects of a drug on all three kinds of abnormal cell populations are not generally clinically feasible. Therefore, it is instructive to examine AP growth with different drug efficacies for the three abnormal populations. Figure 3 presents results when each of µSCA, µEPA and µAP are separately held at 0.1 with the other two values set to 0 (e.g. if µSCA= 0.1 then µEPA and µAP are both 0 and so on). Overall drug efficacy is based on the AP size at 2000 h (i.e. after 1500 h of therapy). When µSCA=µEPA= 0 and µAP= 0.1, the AP size is 0.80 AU with continuous injection and 0.51 AU for periodic injection. For the case µSCA=µAP= 0 and µEPA= 0.1, these values are 0.49 and 0.45 AU, respectively. A marked reduction in the AP size (0.04 AU for continuous infusion, 0.22 AU for periodic infusion) occurs when µSCA= 0.1 and µEPA=µAP= 0. There is very little improvement over these values (0.01 and 0.17 AU for continuous and periodic infusion, respectively) when µSCA=µAP=µEPA= 0.1. These results indicate that AP growth is most inhibited when a drug acts on the abnormal stem cells regardless of the mode of drug infusion.
Figure 3(a) shows that drug response immediately following infusion is progressively more sluggish when the drug acts on EPA or SCA alone instead of on AP. For example, when µAP= 0.1 (and µSCA=µEPA= 0) there is an immediate reduction in the AP size. In contrast, when the drug acts on the SCA compartment alone, the AP size continues to grow until 200 h following infusion. The inset of Fig. 3(a) shows that the AP population continues to grow from 0.068 AU at 500 h to 0.096 AU at t = 700 h before it starts to decline and eventually reduces to 0.012 AU at 2000 h. The delay in response of the AP population to the drug occurs because the amplification of the SCA population into AP transpires with its own time constant. Although targeting the SCA compartment produces a more sluggish initial response as compared to targeting AP cells, it ultimately has a much higher efficacy. This can be explained using the metaphor of the ‘dandelion phenomena’ (Jones et al. 2004; Huff et al. 2006). It logically states that in order to eliminate a dandelion both the stem (or visible portion) of the weed and its root must be removed. Therefore, therapies that offer the potential for the cure of cancers derived from stem cells must target the abnormal stem cells (i.e. the root) that are responsible for disease maintenance, because the elimination of mature cells (i.e. the stem) alone may not lead to a cure. This again explains the smaller overall efficacy of chemotherapy when AP cells instead of the SCA population are targeted by the drug.
As an example, breast tumours that exhibit a basal phenotype similar to healthy mammary progenitor cells are resistant to standard chemotherapy. This supports the hypothesis that therapeutic success in this case could depend on targeting cancer stem cells (Brenton et al. 2005). Imanitib was developed as part of a program to identify drugs that block unregulated activity of protein kinases in various types of cancers (Huff et al. 2006). It produces a rapid response in decreasing CML tumours due to its striking activity against CML progenitors (O’Brien et al. 2003). However, many of its early responses are not durable (Mauro et al. 2003; Cortes et al. 2004) because some CML patients relapse quickly when the drug is discontinued (Cortes et al. 2004) while others show evidence of progression despite continuing with the therapy (Mauro et al. 2003). This has been explained as CML stem cell resistance to Imanitib (Huff et al. 2006). On the other hand, primary activity of interferon may be confined to CML stem cells (Bonifazi et al. 2001), which produces a slow but often durable response in curbing CML (Pierce et al. 2001). because the rationale behind the cancer stem cell hypothesis is to identify the ‘roots’ of cancer and propose durable remedies, for the remainder of the discussion we will focus on drugs that have a specific selectivity towards the SCA population only.
We have noted that the AP population does not exhibit a ‘saw‐tooth’ waveform during periodic drug infusion when µAP= 0. When a drug does not act on the AP compartment, the AP population is solely controlled by the differentiation of EPA to AP and indirectly by the differentiation of SCA to EPA. Equation 11 (for the AP compartment) is a first order differential equation with a time‐constant t = 1/(
0+ mAPA).
§
When µAP= 0 and the AP death rate ω0= 0.01, this time‐constant is of the order of 100 h. Similar re‐arrangements of (9a), (9b) reveal that the time‐constant associated with each EPA sub‐compartment is t = 1/(
EP + mEPAA). Considering µEPA= 0 and = (aEP/tEP)ln2, the time‐constant for EPA ranges from 17 to 57 h when aEP lies in the range 1–0.3 (Refer to Table 1). Thus, with µSCA= 0.1, and µEPA=µAP= 0, any variation in the SCA population with periodic dosing τdrug is ‘smoothened’ as the fluctuation of the cell population propagates through k EPA sub‐compartments before being reflected in the transient response of the AP population. On the contrary, when µAP= 0.1 and the average drug concentration is 0.1 (as found from the simulations), the representative time‐constant for the AP compartment is τ= 1/(0.01 + 0.1 × 0.1) = 50 h. Thus, any ripple in the cell population with a larger time period (e.g. in the case reported in Fig. 3b with τdrug= 100 h) is reflected in the form of a saw‐tooth profile for the time‐response curve of the AP population.
Effects of chemotherapy on abnormal as well as on healthy cell populations are portrayed in 4, 5 for different dosing frequencies. For all these cases, the drug is considered to have one order of magnitude lower cell‐kill rate for healthy cells (i.e. µSCA= 0.1 and µhealthy cells= 0.01). Therapy is again assumed to extend from 500 h to 2000 h. Two dosing modes are considered. First, the maximum drug‐dosing rate amax is specified – as in a case when a maximum tolerated dose that should not be exceeded is stipulated, in order to prevent systemic side effects (Mayer et al. 2006). For this type of dosing, the value of a* varies inversely with the dosing frequency.
Figure 4.
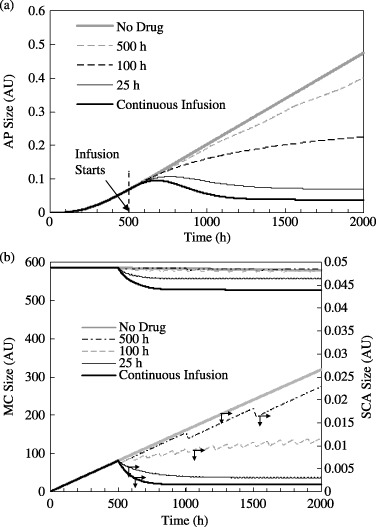
(a) Effect of drug infusion frequency on the AP size. The limiting cases are for no drug infusion (τdrug=∞) and continuous drug infusion (τdrug= 0). Each drug infusion session occurs for 25 h with amax= 0.5 units. µSCA= 0.1, µEPA=µAP= 0, µhealthy cells= 0.01. (b) Corresponding variations in the MC and SCA populations. Drug infusion begins at t = 500 h.
Figure 5.
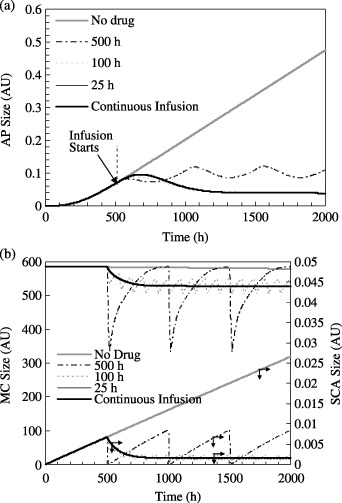
Effect of drug infusion frequency on the (a) AP number and (b) SCA and MC populations. The limiting cases are for no drug infusion (τdrug=∞) and continuous drug infusion (τdrug= 0, a = 0.05 units). Each session of drug infusion occurs for 25 h. amax is adjusted at different dosing frequencies such that a* = is constant for all dosing frequencies. For all cases, µSCA= 0.1, µEPA=µAP= 0, µhealthy cells= 0.01. Drug infusion begins at t = 500 h.
Figure 4(a) presents the time‐response of AP to therapies with different periodicity, that is, τdrug= 25 h, 100 h and 500 h. For all three cases amax= 0.5 AU with each drug infusion session occurring over a period τcycle= 25 h. For comparison, AP response to continuous infusion over the same duration and with an identical dosing rate (0.5 AU), and for the case when there is no therapy, are also presented. These latter two cases establish the theoretical lower and upper limits for τdrug and are, respectively, 0 and ∞. The corresponding MC and SCA population are plotted in Fig. 4(b). Next, the same cases are examined when the total drug administered a* is conserved between 500 and 2000 h for all the values of τdrug (except, of course, when τdrug=∞ for which a* = 0). The corresponding responses of the SCA, MC and SCA populations are plotted in Fig. 5.
As shown in Fig. 4(a), the AP population at the beginning of drug infusion is 0.068 AU. When no drug is administered, it grows to 0.47 AU at 2000 h. Recall from Fig. 3(a) that the AP population reaches 0.80 AU when µSCA=µEPA= 0 and µAP= 0.1 AU. This indicates that abnormal progeny size reduces significantly with chemotherapy that targets SCA cells instead of AP. Figure 4(a) indicates that the AP sizes (in AU) following 1500 h of chemotherapy are 0.47, 0.4, 0.22, 0.07 and 0.04 when τdrug=∞ (i.e. when no drug is administered), 500 h, 100 h, 25 h and 0 h (or when there continuous infusion), respectively. This indicates that amax being held constant, more frequent chemotherapy sessions have greater efficacy. Here, continuous infusion produces the best result, because consistent with intuition, the total amount of the dosed drug a* increases as τdrug decreases.
The model considers the drug to have a low cell‐kill rate with respect to healthy cells (µhealthy cells= 0.01), which leads to a steady depletion in the MC and other healthy cell populations. Any reduction in healthy cells from their equilibrium values stimulates regulatory feedback signals  through
  (cf. Fig. 1a) and increases the SC (and therefore SCA) proliferation rates. This increase in the SCA population increases AP production, which could under certain conditions counterbalance abnormal progeny removal through chemotherapy. This indicates that a drug that targets AP cells alone can hypothetically exacerbate tumour treatment unless it has a large enough AP kill rate (i.e. a large value of µAP) or low enough side effects on healthy cells (with a low value for µhealthy cells).
Mature cells and SCA populations for these cases are presented in Fig. 4(b). Continuous infusion leads to a small depletion in the MC population from an equilibrium value of 578.8 AU to 527.8 AU. This 8.8% MC decrease induces SC (and SCA) proliferation through feedback signalling. Regardless, the SCA population does not exceed, for any τdrug value, the corresponding value for the case when there is no treatment (because the drug now directly targets the SCA population). The SCA population diminishes immediately after the drug is administered. The greatest response is again observed for continuous infusion with which the SCA population reduces to 22% of its initial size. As before, the SCA population does not decline as rapidly for larger τdrug values. After initially declining, SCA size actually increases slightly with time, indicating that cell‐kill rate is lower than the SCA production rate when τdrug > 100 h. In contrast, for τdrug > 500 h SCA growth is only marginally arrested below the SCA build‐up without drug therapy. At 2000 h, SCA populations are respectively 0.0266, 0.0228, 0.0116, 0.0031and 0.0015 AU when τdrug=∞, 500 h, 100 h, 25 h and 0 h. Table 2 presents final SCA and AP populations for different τdrug values expressed as percentages of their respective sizes would have been in the absence of therapy. Correlation between the reduction in the AP and SCA populations under therapy is almost linear. AP behaviour, presented in Fig. 4(a), therefore follows a trend similar to the SCA activity in Fig. 4(b), but with a time‐lag.
When total infusion a* is constant irrespective of τdrug, the response of the AP population to chemotherapy is much different. As shown in Fig. 5(a), the AP population at 2000 h is 0.11, 0.04 and 0.04 AU when τdrug= 500, 100 and 25 h, respectively. Drug efficacy does not noticeably alter when τdrug changes. However, periodic infusion produces large transient declines in the MC population (Fig. 5b). For instance, the MC population decreases from 585.4 to 335.8 AU immediately following infusion during each cycle when τdrug= 500 h. This is due to the large amax value (cf. Fig. 1b) imposed as τdrug increases so as to maintain a constant a* value. Therefore, when τdrug= 100 h the MC depletion is smaller (from 585.4 to 509.6 AU). Because depletion of mature cells is an undesirable side effect of therapy, particularly for sensitive populations, the results imply that administering large doses at infrequent periods could be detrimental to patient health. For example, survivors of medulloblastoma show signs of impaired neuropsychological activity in the first decade after chemotherapy and radiation treatment (Maddrey et al. 2005), both of which have the deleterious side effect of healthy brain tissue damage.
So far, we have considered an arbitrarily chosen constant value of µSCA (= 0.1) for our analysis. However, different drugs may have varying SCA kill rates. Thus, it is important to investigate how variations in µSCA can alter the results of chemotherapy for both continuous and periodic infusions with different values for τdrug. Figure 6 presents the AP population at t = 2000 h as function of µSCA when amax and a* are held constant, respectively. As before, the drug is administered from t = 500 h to t = 2000 h, and all the other parameters (e.g. τcycle, µhealthy cells, etc.) are unchanged.
Figure 6.
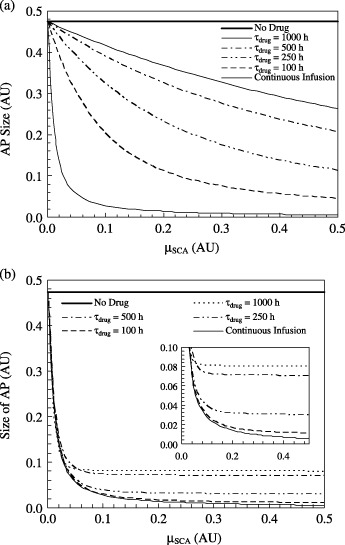
Efficacy of chemotherapy in diminishing the AP population as a function of the SCA kill rate µSCA for different drug infusion conditions: (a) amax= constant for all frequencies and a* is not conserved, and (b) amax is adjusted at different dosing frequencies so that a* is conserved. The plot indicates the AP size at t = 2000 h. Drug infusion occurs from t = 500 h to t = 2000h. The inset of Fig. 6(b) shows an enlarged view of the same plot.
Figure 6(a) indicates that for a continuous infusion process, significant improvement in drug efficacy is achieved when the value of µSCA is raised by even a very small value above 0. The post‐treatment AP size decreases by almost 95% from that in the absence of therapy when µSCA is raised from 0 to 0.12. However, further increase in µSCA does not alter efficacy as significantly and the final AP population is eventually almost insensitive to any further increases in µSCA. For τdrug= 100 h, the effect of µSCA is less pronounced, because for µSCA= 0.5 the decline in AP size is 90.5% as compared to one in the absence of therapy. Unlike the case of continuous infusion, the AP versus µSCA curve continues to monotonically decrease within the range of the study. The slope of this curve decreases with increasing τdrug. For example, with µSCA= 0.5, the AP sizes at t = 2000 h for τdrug= 250 h, 500 h and 1000 h are 24%, 44% and 55% in comparison with the case when there is no therapy (Fig. 6a). Thus, when amax= constant (i.e. a* is not conserved), a more vigorous drug is progressively less effective as the time between two consecutive infusion increases. On the contrary, when a* is conserved over the entire duration of therapy and µSCA is smaller than 0.04, the sensitivity of drug efficacy on µSCA at all τdrug values is almost as satisfactory as that produced through continuous infusion.
Figure 6(b) indicates that increasing the value of µSCA from 0 to 0.04 can result in a more than 80% reduction in AP growth for all the τdrug values considered here. Beyond a threshold of µSCA (0.3, 0.18, 0.12 and 0.06 for τdrug= 100 h, 250 h, 500 h and 1000 h, respectively, as shown in the inset of Fig. 7b), AP size ceases to significantly deplete with any further increase in µSCA. This implies that for periodic therapy with conserved a*, an acceptable result is achieved when the drug has a threshold value of µSCA. A drug with a µSCA value lower than this threshold does not decrease the AP population to the maximum extent possible. In contrast, while a larger value of µSCA could produce more pronounced side effects, it would provide no tangible improvement in efficacy, for example, through drug resistance (Stordal et al. 2006).
Figure 7.
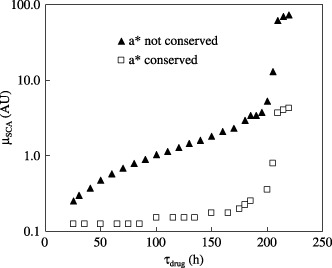
Drug efficacy in terms of the SCA cell kill rate, in AU, required to eradicate 95% of the SCA population plotted as a function of the time between two consecutive treatments during periodic drug infusion. For curve ▴, amax is constant so that a* is not conserved. For curve □, amax is adjusted such that a* is conserved. Chemotherapy begins at t = 500 h and continues until t = 2000 h. Each session of drug infusion occurs for 25 hours.
Continuous infusion yields better overall efficacy than periodic infusion. However, the latter is often the more feasible option from a mobility perspective. Nonetheless, there is a trade‐off. While a large value of τdrug is desirable from a convenience perspective, it has lower efficacy. Choosing a large value for µSCA may not necessarily compensate for a large τdrug interval, because values above a threshold value of µSCA do not provide significant therapeutic improvement. Therefore, the combination of τdrug and µSCA that is selected is important.
Figure 7 presents the results of a parametric simulation to determine the minimum µSCA required to achieve 95% reduction in AP as a function of τdrug. Within the range 25 h < τdrug < 250 h, this µSCA value increases monotonically for both the two conditions: (i) when amax= constant and a* is not conserved and (ii) when a* is conserved. Thus, to achieve the same treatment efficacy, a larger τdrug period requires a larger value of µSCA. It is apparent from Fig. 7 that the average slope of the curve for the condition when a* is not conserved is much higher than that for when a* is conserved. For the first case the required value of µSCA increases from 0.25 for τdrug= 25 h to 5.3 when τdrug= 200 h. In contrast, this value increases from 0.125 when τdrug= 25 h to 0.35 for τdrug= 200 h when a* is conserved. Both plots exhibit sudden increase by almost one order of magnitude in the required µSCA values as τdrug approaches 200 h, after which the curves plateau. This implies that it becomes chemotherapeutically challenging to control cancer if the time between two consecutive therapies exceeds 200 h for the specific conditions of our model. These results should be interpreted qualitatively because different therapeutic conditions applied in the model will yield other quantitative results.
CONCLUSIONS
Efficacy of chemotherapeutic drug therapy for cancer has been investigated using a predictive model based on the cell compartment method. Continuous and periodic drug infusions with different time periods between successive infusions were compared. The infused drug was considered to have either a constant maximum infusion rate amax or a conserved total infusion quantity a*.
-
1
For both continuous and periodic infusions drug efficacy for controlling AP cells is greater when the drug acts selectively on SCA alone, rather than on EPA or AP alone.
-
2
When a drug acts on AP alone, the AP growth is immediately arrested. However, its longer‐term efficacy is relatively poorer than if the drug had acted on other compartments. On the other hand, if the drug has a selective efficacy towards SCA alone, although the reduction in the AP cell population is delayed, it is more pronounced. Hence, targeting a drug selectively to remove SCA cells is preferable to targeting EPA or AP cells alone.
-
3
When a drug is administered periodically and the maximum dosing rate amax is held constant (rather than the total infusion quantity a*) reduction in the AP population declines, as the time period τdrug between consecutive therapies increases. At the upper limit, the higher efficacy is achieved for continuous infusion for which a* is also the largest.
-
4
If periodic infusion is performed, such that a* is conserved, drug efficacy is not as strongly affected by τdrug. However, in case of large τdrug values, instantaneous drug infusion rate amax must also be higher, leading to a large temporary decline in the healthy cell population due to side effects induced by the drug. Therefore, such a mode of therapy could be detrimental for populations more susceptible to side effects.
-
5
During continuous infusion, drug efficacy is very sensitive to µSCA values when these are relatively small. Post‐treatment AP size decreases by almost 95% from that in the absence of therapy when µSCA is raised from 0 to 0.12. However, further increases in the values of µSCA do not alter the efficacy as significantly. After a critical value, the final AP population is eventually almost insensitive to any further increases in µSCA. With periodic infusion and with a* not conserved, even a more vigorous drug is not found to be effective at large value of τdrug. On the contrary, when a* is conserved over the entire duration of therapy and µSCA is smaller than 0.04, the dependence of drug efficacy on µSCA is nearly identical for a wide range of τdrug values (including for the case of continuous infusion).
-
6
Achieving the same treatment efficacy with periodic therapy for larger τdrug periods requires relatively larger values of µSCA. However, if τdrug exceeds a value of 200 h, an order of magnitude larger value of µSCA is required. Such treatment could become chemotherapeutically challenging.
Footnotes
If a first order system is represented by the equation dx/dt = ax + bu, where x is the dependent variable (the cell size in the present case), u the input function (input from the other cell compartments), and a and b are constants, then the time‐constant of the system is τ = −1/a.
REFERENCES
- Al‐Hajj M, Becker MW, Wicha M, Weismann I, Clark MF (2004) Therapeutic implications of cancer stem cells. Curr. Opin. Genet. Dev. 14, 43–47. [DOI] [PubMed] [Google Scholar]
- Al‐Hajj M, Clarke MF (2004) Self‐renewal and solid tumor cells. Oncogene 23, 7274–7282. [DOI] [PubMed] [Google Scholar]
- Bonifazi F, De Vivo A, Rosti G, Guilhot J, Trabacchi E, Hehlmann R, Hochhaus A, Shepherd PC, Steegmann JL, Kluin‐Nelemans HC, Thaler J, Simonsson B, Louwagie A, Reiffers J, Mahon FX, Montefuso E, Alimena G, Hasford J, Richards S, Saglio G, Testoni N, Martinelli G, Tura S, Baccarani M (2001) Chronic myeloid leukaemia and interferon‐alpha: a study of complete cytogenic responders. Blood 98, 3074–3081. [DOI] [PubMed] [Google Scholar]
- Brenton JD, Carey LA, Ahmed AA, Caldas C (2005) Molecular classification and molecular forecasting of breast cancer: ready for clinical application. J. Clin. Oncol. 23, 7350–7360. [DOI] [PubMed] [Google Scholar]
- Byrne HM (2003) Modeling avascular tumour growth In: Preziosi L, ed. Cancer Modeling and Simulation, p. 75 London: Chapman & Hall; /CRC. [Google Scholar]
- Clarke MF (2004) At the root of brain cancer. Nature 432, 281–282. [DOI] [PubMed] [Google Scholar]
- Cortes J, O’Brien S, Kantarjian H (2004) Discontinuation of imanitib therapy after achieving a molecular response. Blood 104, 2204–2205. [DOI] [PubMed] [Google Scholar]
- Ganguly R, Puri IK (2006) Mathematical model for the cancer stem cell hypothesis. Cell Prolif. 39, 3–14. [DOI] [PMC free article] [PubMed] [Google Scholar]
- Hanahan D, Weinberg RA (2000) The hallmarks of cancer. Cell 100, 57–70. [DOI] [PubMed] [Google Scholar]
- Huff CA, Matsui WH, Smith BD, Jones RJ (2006) Strategies to eliminate cancer stem cells: clinical applications. Eur. J. Cancer 42, 1293–1297. [DOI] [PubMed] [Google Scholar]
- Huntly BJ, Gilliland DG (2005) Summing up cancer stem cells. Nature 435, 1169–1170. [DOI] [PubMed] [Google Scholar]
- Jessell TM, Lumsden A (1997) Inductive signals and the assignment of cell fate in the spinal cord and hindbrain In: Cowan WM, Jessell TM, Zipursky SL, eds. Molecular and Cellular Approaches to Neural Development, p. 290 Oxford: Oxford University Press. [Google Scholar]
- Jones RJ, Matsui WH, Smith BD (2004) Cancer stem cells: are we missing the target. J. Natl. Cancer Inst. 96, 583–585. [DOI] [PubMed] [Google Scholar]
- Komarova NL, Wadarz. D (2005) Drug resistance in cancer: principles of emergence and prevention. PNAS 102, 9714–9717. [DOI] [PMC free article] [PubMed] [Google Scholar]
- Lessard J, Sauvageau G (2003) Bmi‐1 determines the proliferative capacity of normal and leukaemic stem cells. Nature 15, 255–260. [DOI] [PubMed] [Google Scholar]
- Mackenzie IC (2005) Retention of stem cell patterns in malignant cell lines. Cell Prolif. 38, 347–355. [DOI] [PMC free article] [PubMed] [Google Scholar]
- Maddrey AM, Bergeron JA, Lombardo ER, McDonald NK, Mulne AF, Barenberg PD, Bowers DC (2005) Neuropsychological performance and quality of life of 10 year survivors of childhood medulloblastoma. J. Neurooncol. 72, 245–253. [DOI] [PubMed] [Google Scholar]
- Mauro MJ, Druker BJ, Kuyl J, Kurilik G, Maziarz. RT (2003) Increasing levels of detectable leukaemia in imanitib treated CML patients with previously undetectable or very low levels of BCR‐ABL. Proc. ASCO 22, 569. [Google Scholar]
- Mayer LD, Harasym TO, Tardi PG, Harasym NL, Shew CR, Johnstone SA, Ramsay EC, Bally MB, Janoff AS (2006) Ratiometric dosing of anticancer drug combinations: controlling drug ratios after systemic administration regulates therapeutic activity in tumour‐bearing mice. Mol. Cancer Ther. 5, 1854–1863. [DOI] [PubMed] [Google Scholar]
- Michor F, Hughes TP, Iwasa Y, Branford S, Shah N, Sawyers CL, Nowak MA (2005) Dynamics of chronic myeloid leukaemia. Nature 435, 1267–1270. [DOI] [PubMed] [Google Scholar]
- Molofsky A, Pardal R, Iwashita T, Park I‐K, Clarke MF, Morrison SJ (2003) Bmi‐1 dependence distinguishes neural stem cell self‐renewal from progenitor proliferation. Nature 425, 962–967. [DOI] [PMC free article] [PubMed] [Google Scholar]
- O’Brien SG, Guilhot F, Larson RA, Gathmann I, Baccarani M, Cervantes F, Cornelissen JJ, Fischer T, Hochhaus A, Hughes T, Lechner K, Nielsen JL, Rousselot P, Reiffers J, Saglio G, Shepherd J, Simonsson B, Gratwohl A, Goldman JM, Kantarjian H, Taylor K, Verhoef G, Bolton AE, Capdeville R, Druker BJ; IRIS Investigators (2003) Imanitib compared with interferon and low‐dose cytarabine for newly diagnosed chronic‐phase chronic myeloid leukaemia. N. Engl. J. Med. 348, 994–1004. [DOI] [PubMed] [Google Scholar]
- O’Neill A, Schaffer DV (2004) The biology and engineering of stem cell control. Biotechnol. Appl. Biochem. 40, 5–16. [DOI] [PubMed] [Google Scholar]
- Oliver TG, Wechsler‐Reya RJ (2004) Getting at the root and stem of brain tumour. Neuron 42, 885–888. [DOI] [PubMed] [Google Scholar]
- Pardal R, Clarke MF, Morrison SJ (2003) Applying the principle of stem cell biology to cancer. Nat. Rev. Cancer 3, 895–902. [DOI] [PubMed] [Google Scholar]
- Pierce A, Smith DL, Jakobsen LV, Whetton AD, Spooncer E (2001) The specific enhancement of interferon alpha induced growth inhibition by BCR/ABL only occurs in multipotent cells. Hematol. J. 2, 257–064. [DOI] [PubMed] [Google Scholar]
- Polakis P (2000) Wnt Signaling and cancer. Genes Dev. 14, 1837–1851. [PubMed] [Google Scholar]
- Polyak K, Hahn WC (2006) Roots and stems: stem cells in cancer. Nat. Med. 12, 296–300. [DOI] [PubMed] [Google Scholar]
- Reya T, Morrison SJ, Clarke MF, Weissman IL (2001) Stem cells, cancer, and cancer stem cells. Nature 414, 105–111. [DOI] [PubMed] [Google Scholar]
- Roeder I, Horn M, Glauche I, Hochhaus A, Mueller MC, Loeffler M (2006) Dynamic modeling of imatinib‐treated chronic myeloid leukemia: functional insights and clinical implications. Nat. Med. 12, 1181–1184. [DOI] [PubMed] [Google Scholar]
- Singh SK, Hawkins C, Clarke ID, Squire JA, Bayani J, Hide T, Henkelman RM, Cusimano MD, Dirks PB (2004) Identification of human brain tumor initiating cells. Nature 432, 396–401. [DOI] [PubMed] [Google Scholar]
- Stordal BK, Davey MW, Davey RA (2006) Oxaliplatin induces drug resistance more rapidly than cisplatin in H69 small cell lung cancer cells. Cancer Chemother. Pharmacol. 58, 256–265. [DOI] [PubMed] [Google Scholar]
- Taipale J, Beachy PA (2001) The Hedgehog and Wnt signaling pathways in cancer. Nature 411, 349–254. [DOI] [PubMed] [Google Scholar]
- Viswanathan S, Zandstra P (2003) Towards predictive models of stem cell fate. Cytotechnol. 41, 75–92. [DOI] [PMC free article] [PubMed] [Google Scholar]
- Wichmann HE, Loeffler M (1984) Mathematical Modeling of Cell Proliferation: Stem Cell Regulation in Hemopoiesis, Vol. I Boca Raton, FL: CRC Press. [Google Scholar]