

Abstract
Abstract. Objective: Our previous studies have demonstrated that endogenous bone marrow cells (BMCs) contribute to renal tubular regeneration after acute tubular injury. The aim of this study was to examine which fraction of BMCs, haematopoietic lineage marrow cells (HLMCs) or mesenchymal stem cells (MSCs), are effective. Materials and methods: Six‐week‐old female mice were lethally irradiated and were transplanted with female enhanced green fluorescent protein‐positive (GFP+), plastic non‐adherent marrow cells (as a source of HLMCs) plus cloned cultured male GFP− MSCs. Four weeks later, they were assigned into two groups: control mice with vehicle treatment and mice treated with HgCl2. Tritiated thymidine was given 1 h before animal killing which occurred at intervals over 2 weeks. Kidney sections were stained for a tubular epithelial marker, cell origin indicated by GFP immunohistochemistry or Y chromosome in situ hybridization; periodic acid‐Schiff staining was performed, and samples were subjected to autoradiography. One thousand consecutive renal tubular epithelial cells per mouse, in S phase, were scored as either female (indigenous) GFP+ (HLMC‐derived) or male (MSC‐derived). Results: Haematopoietic lineage marrow cells and MSCs stably engrafted into bone marrow and spleen, but only HLMC‐derived cells, not MSCs, were found in the renal tubules and were able to undergo DNA synthesis after acute renal injury. A few MSCs were detected in the renal interstitium, but their importance needs to be further explored. Conclusion: Haematopoietic lineage marrow cells, but not cloned cultured MSCs, can play a role not only in normal wear‐and‐tear turnover of renal tubular cells, but also in repair after tubular injury.
INTRODUCTION
Studies of tissues from gender‐mismatch bone marrow transplantation (BMT) and organ allografts have demonstrated that adult bone marrow cells (BMCs) can transdifferentiate into a variety of non‐haematological tissues in rodents and in humans. These include skeletal muscle, endothelial cells, cardiomyocytes, neuronal cells and astrocytes, hepatocytes, epidermal cells, pneumocytes, gut epithelium, renal tubular epithelium and podocytes (reviewed in Poulsom et al. 2002; Herzog et al. 2003; Alison et al. 2004; Fang et al. 2004).
Adult bone marrow contains haematopoietic stem cells (HSCs), which give rise to all mature cell lineages of blood, and mesenchymal stem cells (MSCs), which support haematopoiesis in the stem cell niche and can differentiate into mesodermal tissue types, including bone, cartilage, tendon, fat, muscle, cardiomyocytes and marrow stroma (reviewed in Otto & Rao 2004; Roufosse et al. 2004). Our previous studies have demonstrated that endogenous BMCs and pre‐engrafted BMCs can contribute to tubular regeneration after acute tubular injury (Poulsom et al. 2001; Fang et al. 2005). Moreover, our and other studies have shown the percentage to contribution of regeneration from pre‐engrafted BMCs is around 10–15% (Fang et al. 2005; Lin et al. 2005). However, it is still uncertain which fraction of BMCs, either HSCs (Krause et al. 2001; Wagers et al. 2002; Kale et al. 2003; Lin et al. 2003; Dekel et al. 2006) or MSCs, is the major contributor to regeneration of renal tubular cells after acute tubular injury (Herrera et al. 2004; Morigi et al. 2004; Duffield et al. 2005; Lange et al. 2005; Togel et al. 2005).
The aim of this study was to examine the relative contributions of haematopoietic lineage marrow cells (HLMCs) and MSCs to regenerate renal tubules after acute tubular damage. Here, we transplanted female green fluorescent protein‐positive (GFP+) plastic non‐adherent marrow cells (as a source of HLMCs) together with cloned cultured male GFP‐negative (GFP−) MSCs into lethally irradiated female mice. Four weeks later, we induced acute tubular damage and over the next 14 days we found that both HLMCs and MSCs engrafted into bone marrow and spleen, but only HLMC‐derived cells contributed to regeneration after acute tubular injury.
MATERIALS AND METHODS
Experimental protocols
The procedures for animal experiments were carried out under British Home Office procedural and ethical guidelines (Fig. 1). Six‐week‐old wild‐type female recipient mice (C57Bl6) were lethally irradiated (2 × 6 Gray, 3 h apart) to ablate their bone marrow, and were immediately rescued by tail vein injection of female GFP+ HLMCs (106 cells) together with male GFP− MSCs (105 cells), re‐suspended in 0.2 mL sterile phosphate‐buffered saline (PBS). The mice were housed in sterile conditions for 2 weeks. Four weeks after BMT, mice were randomly divided into two groups of 20 mice and were treated as follows: control group CON, mice received an intraperitoneal injection of vehicle (0.2 mL PBS) and treatment group HgCl2, mice received an intraperitoneal injection of HgCl2 (3.5 mg/kg body weight). The day of HgCl2 administration was designated as day 0. Tritiated thymidine (3HTdR) (TRK120, Amersham Biosciences, Munich, Germany) at a dose of 1 µCi/g body weight (intraperitoneally) was injected 1 h before the mice were killed. Mice were killed either before HgCl2 administration (day 0), or days 3, 7 and 14 after HgCl2, with five mice killed by overdose of pentobarbitone (Sagatal; Rhône Mérieux, Essex, UK; 200 mg/kg, intraperitoneally) at each time point. Terminal blood samples (0.7 mL) were taken by cardiac puncture into an EDTA‐tube. Kidney, spleen and femoral bone were harvested and fixed in neutral buffered formalin before being embedded in paraffin wax for later histological examination. Bone specimens were decalcified with 8% formic acid (cat. no. 10115, BDH Laboratory Supplies, Poole, UK) and 8% formic potassium (cat. no. 29445‐4, Sigma‐Aldrich, Dorset, UK) for 10–12 days.
Figure 1.

A schematic outline of the experimental procedures. BMT, bone marrow transplant; GFP, green fluorescent protein; HLMCs, haematopoietic lineage marrow cells; MSCs, mesenchymal stem cells.
Donor animals
A breeding colony of hemizygous enhanced GFP+ transgenic mice (129/C57Bl6) was established at Cancer Research UK, London Research Institute, UK (Dr. Stephen D. Robinson) (Brittan et al. 2005), from breeding pairs purchased from the Jackson Laboratory (TgN(GFPU)5Nagy, Jackson Laboratories Strain #003115, Bar Harbor, ME, USA).
Preparation of donor cells for BMT
The method for preparation of donor cells for the bone marrow transplant were prepared as the study from Pereira et al. (1995), which combined a culture of male MSCs with freshly isolated non‐adherent cells from female GFP+ mice (i.e. HLMCs), for short‐ and long‐term haematopoietic support (Friedenstein et al. 1976; Pereira et al. 1995; Morigi et al. 2004).
Whole BMC preparations
Mice were killed humanely by CO2 inhalation. Tibias and femurs were flushed three times with ice‐chilled PBS, and samples were pooled. They were centrifuged at 400 g for 5 min, re‐suspended in PBS, sieved through a 70‐µm mesh, and re‐suspended in PBS at 1 × 10⁷ cells/mL and kept on ice until use.
Culture and retrieval of male GFP− MSCs
Methods for isolation and culture of MSCs were based on the studies of Friedenstein et al. (1976) and Lennon et al. (1995). Briefly, BMCs obtained from 6‐week‐old male wild‐type mice (C57Bl6) were re‐suspended in Dulbecco's modified Eagle's medium (DMEM; Gibco, Invitrogen, Grand Island, NY, USA), filtered through a 70‐µm mesh and were plated at a density of 20–40 × 106 cells/10 cm2 in 75 cm2 flasks in DMEM‐low glucose (1 g/L) (60%) with MCDB‐201 (40%) (Sigma, St. Louis, MO, USA) and 10% foetal calf serum (BioWhittaker Inc., Walkersville, MD, USA) with penicillin (100 U/mL) and streptomycin (0.1 mg/mL), and were incubated at 37 °C in a humidified atmosphere containing 5% CO2. Adherent cells were fed twice each week and were passaged, just before confluence, at a split ratio of 1 in 3. MSCs used in this study were cultured for more than 10 passages, which practically excluded haematopoietic cell contamination (Lange et al. 2005). Presumptive cultures of MSCs were characterized by their ability to differentiate into osteogenic, chondrogenic and adipogenic lineages (Otto & Rao 2004). One successful line (JRP73) was single‐cell cloned and retested for trilineage differentiation; clone 2 cells (JR283) were chosen for these experiments and were used at passage 12. MSCs were trypsinized, washed twice with PBS, and were re‐suspended at 106 cells/mL and kept on ice for transplantation within 2 h.
Preparation of female GFP+ plastic‐non‐adherent marrow cells
Bone marrow cells obtained from 6‐week‐old female GFP mice were centrifuged at 400 g for 5 min, and cell pellets were re‐suspended and plated at a density of 20 × 106 cells/10 cm2 in DMEM with 10% foetal calf serum with penicillin and streptomycin, in a six‐well culture plate, and were incubated at 37 °C for 4 h. Non‐adherent marrow cells (HLMCs) were obtained by gentle aspiration, centrifuged at 400 g for 5 min, and were re‐suspended in sterile PBS with penicillin and streptomycin, sieved through a 40‐µm mesh and were spin‐washed again into antibiotic‐free PBS (1 × 10⁷ cells/mL). They were kept on ice until use which was within 2 h.
Serum urea nitrogen measurements
Blood samples were centrifuged at 5000 g for 10 min at 4 °C and supernatants were stored at –70 °C for determination of serum urea nitrogen (SUN), using a commercial kit (R‐Biopharm GmbH, Darmstadt, Germany) following the manufacturer's instructions. The level of SUN was expressed in milligrams per dL.
Histology and tubular injury score
For histological examination of renal tissue, 4 µm thick sections were stained with periodic acid‐Schiff (PAS). Tubular injury score (TIS) was assessed at ×400 overall magnification using 20 consecutive and non‐overlapping corticomedullary junction fields. Tubular damage was defined as one or more of the following: tubular epithelial cell swelling, loss of brush borders, vacuolar degeneration, necrosis and desquamation, were evaluated and scored semiquantitatively; 0, normal, 1, 2, 3 and 4 based on the report of Nangaku et al. (1998). TIS for each mouse represented the average score of 20 fields examined.
Pre‐treatment of tissue sections
Four micrometer thick sections were dewaxed and were incubated with 1% hydrogen peroxide in methanol to block endogenous peroxidase, rehydrated through a descending series of ethanol in water (100%, 95% and 70%), and were incubated for 5 min in 20% acetic acid in methanol to block endogenous alkaline phosphatase.
Immunohistochemical method for GFP detection
Direct detection of GFP fluorescence in the bone marrow, spleen and kidney of transplanted mice is an unreliable marker of HLMC‐derived cells as non‐specific green autofluorescence exists in wild‐type tissues with or without HgCl2 treatment (Fig. 2a–f). Thus, we used a 3‐layer immunohistochemical method to detect GFP. GFP‐positive cells were detected in the bone marrow, spleen and renal tubular cells of GFP+ mice, and no false positive GFP cells were detected in the bone marrow, spleen and kidney of wild‐type mice with or without HgCl2 (Fig. 2g–l).
Figure 2.

Direct green fluorescent protein (GFP) fluorescence from bone marrow, spleen and kidney of GFP‐positive (GFP+) (a–c) and wild‐type (WT) (d–f) mice viewed under fluorescence microscopy (a–f, ×630). Although cells expressing green fluorescence were detected in GFP+ mice (a–c), cells expressing non‐specific green fluorescence were also detected WT mice (d–f). Green colour, GFP+ cells; blue colour, DAPI staining for nucleus. Immunohistochemical staining for GFP detection in GFP+ (g–i) and WT (j–l) mice (×400). Cells stained with brown colour represent GFP+ cells. GFP‐positive cells are detected in GFP+ mice, but not in WT mice.
After pre‐treatment, tissue sections were microwaved in 10 mm tri‐sodium citrate (pH 6.0) (BDH Laboratory Supplies) for 20 min, then treated with a biotin blocking system (cat. no. X0590; DAKO, Glostrup, Denmark), and were incubated in normal swine serum (X0901; DAKO) at 1/25 dilution for 10 min. Rabbit anti‐GFP 1/250 (A‐6455, Molecular Probes, Eugene, OR, USA) antibody was applied for 45 min, biotinylated swine antirabbit 1/500 (E0353; DAKO) for 35 min followed by streptavidin‐peroxidase 1/500 (P0397; DAKO) for 30 min. Slides were developed in 3,3′‐diaminobenzidine (DAB) (0.5 mg/mL) (D5637; Sigma) plus 0.3% hydrogen peroxide. When detecting GFP only, slides were counterstained lightly with haematoxylin, dehydrated, cleared and mounted in DePeX (36125‐2B; BDH Laboratory Supplies). To further stain with lectin, no counterstain was employed.
Lectin staining
After GFP staining, tissue sections were microwaved in 10 mm tri‐sodium citrate (pH 6.0) for 10 min and biotin was blocked using a biotin blocking kit (DAKO), and then incubated for 45 min with biotinylated Phaseolus vulgaris leucoagglutinin (PHA‐L) 1/100 (B‐1115, Vector Laboratories, Burlingame, CA, USA) to detect proximal convoluted tubules, or biotinylated peanut agglutinin (PNA) 1/800 (B‐1075, Vector Laboratories) to detect distal convoluted tubules. Sections were then washed in PBS and were incubated with streptavidin‐alkaline phosphatase (D0396; DAKO) for 30 min; they were then revealed with Vector blue substrate (SK5100; Vector Laboratories) for 8 min. Sections were stained with PAS and processed for autoradiography.
Fluorescence in situ hybridization
To examine whether MSCs transdifferentiated into renal tubular cells, sections were stained with lectin, developed with Vector Red substrate (SK5300; Vector Laboratories) followed by fluorescence in situ hybridization (FISH) for Y chromosome detection. FISH procedures to detect Y chromosomes have been described in our previous studies (Poulsom et al. 2001; Fang et al. 2005).
For direct FISH, slides were washed after the procedure and were coverslipped with Vectashield Hard Set mountant containing 4′,6‐diamidine‐2‐phenylindole dihydrochloride (DAPI) (H‐1500; Vector Laboratories). Slides were analysed using a Zeiss Axioplan 2 fluorescence microscope (Carl Zeiss UK Ltd., Hertfordshire, UK) equipped with filtre sets allowing capture of DAPI, FITC and other fluorescent images, using a cooled charge‐coupled device camera (Quantix Corp., Cambridge, MA, USA) and SmartCapture 2 software (Digital Scientific, Cambridge, UK [http://www.digitalscientific.co.uk]).
For indirect FISH, slides were washed with PBS after the procedure and were incubated with 1/250 dilution peroxidase‐conjugated antifluorescein antibody (1426346; Boehringer Mannheim, Mannheim, Germany) for 60 min at room temperature, and developed with DAB (D5637; Sigma) as above, washed with PBS and subjected to PAS staining to improve visualization of basement membranes.
Autoradiography for 3HTdR
The autoradiographic procedures have been described previously (Fang et al. 2005). After autoradiography, glycergel (C0563; DAKO) was used to mount sections stained for GFP and lectin, and developed with Vector blue substrate.
Sections stained for lectin developed with Vector Red and indirect FISH developed with DAB, were counterstained lightly with haematoxylin, dehydrated, cleared and mounted in DePeX (36125‐2B; BDH Laboratory Supplies).
3HTdR‐labelling index
One thousand consecutive lectin‐positive tubular cells per mouse were examined using a bright‐ and dark‐field microscope (Nikon Eclipse ME600; Nikon Corporation, Kawasaki, Japan). GFP‐positive cells that had more than five overlying (autoradiographically derived) silver grains were considered to be of HLMC origin, in DNA synthesis. The observed proportion of GFP+ tubular epithelial cells was divided by a correction factor derived from the actual proportion of GFP+ tubular cells in hemizygous GFP+ transgenic mice; this being 0.41 in proximal tubular cells, and 0.45 in distal tubular cells. Similarly, Y chromosome‐positive nuclei with more than five silver grains were scored as cells of donor male MSC origin, in DNA synthesis. The observed percentage of Y chromosome‐positive tubular cells was also divided by a correction factor derived from actual Y chromosome‐positive cell count of male controls; this being 0.50 in proximal tubular cells, and 0.56 in distal tubular cells.
Percentage of HLMC and MSC engraftment
Bone marrow and spleen were stained for either immunohistochemical method for GFP detection or indirect FISH for Y chromosome; 1000 consecutive cells of bone marrow and spleen per mouse were examined under a bright field microscope (Nikon Eclipse ME600) to count the percentage of GFP‐positive cells or Y chromosome‐positive cells.
Statistical analysis
SUN, TIS, 3HTdR‐labelling index (3H‐LI) (%), and engraftment (%) of HLMCs and MSCs were analysed by two‐way analysis of variance (anova) and P < 0.05 taken to indicate statistical significance. The results are presented as mean ± SEM.
RESULTS
HLMC and cloned cultured MSC engraftment of bone marrow and spleen
Figure 3 shows the engraftment of HLMCs and MSCs in the bone marrow and spleen of transplanted mice. Changes in percentage of engrafted HLMCs and MSCs of bone marrow and spleen are shown in Table 1. There were no significant differences in engrafted HLMCs (%) either in the bone marrow or in the spleen of BMT mice between the vehicle‐treated group and the HgCl2‐treated group, during the corresponding time periods throughout the experiments. Similarly, no significant differences in engrafted MSCs (%) either in the bone marrow or in the spleen were noted in BMT mice that received either vehicle or HgCl2 during the entire experimental period.
Figure 3.

Examples of the engraftment of haematopoietic lineage marrow cells (HLMCs) and mesenchymal stem cells (MSCs) in the bone marrow (BM) and spleen of irradiated mice transplanted with female GFP+ HLMCs and male GFP MSCs. HLMCs (brown colour) were detected in the BM (a, ×400) and spleen (b, ×200), demonstrated by the immunohistochemical method. MSCs are detected via direct FISH (c and e, ×1000) and indirect FISH (g and i, ×400). White arrows point to Y chromosome (Y chromosome paint seen as a green nuclear signal) under direct FISH and black arrows point to Y chromosomes (Y chromosome paint seen as a brown nuclear signal) under indirect FISH. (d), (f), (h) and (j) are the higher magnification (×600) of yellow boxes in the (c), (e), (g) and (i), respectively. BMT, bone marrow transplantation; FISH, fluorescence in situ hybridization.
Table 1.
Effects of administration of HgCl2 on the percentage of engrafted HLMCs and MSCs in bone marrow and spleen of irradiated female mice transplanted with female GFP+ HLMCs together with male GFP− cloned cultured MSCs
| Parameter | n | Bone marrow | Spleen | ||
|---|---|---|---|---|---|
| Group CON | Group HgCl2 | Group CON | Group HgCl2 | ||
| HLMCs (%) | |||||
| Pre‐HgCl2 | 5 | 30.2 ± 2.0 | 28.2 ± 1.9 | 26.5 ± 1.8 | 25.8 ± 2.2 |
| Post‐HgCl2 day 3 | 5 | 28.4 ± 2.2 | 26.9 ± 2.3 | 25.2 ± 2.4 | 26.7 ± 2.1 |
| Post‐HgCl2 day 7 | 5 | 32.4 ± 1.7 | 28.9 ± 2.1 | 27.8 ± 1.9 | 26.4 ± 2.8 |
| Post‐HgCl2 day 14 | 5 | 31.2 ± 2.5 | 30.5 ± 1.9 | 28.6 ± 2.3 | 27.5 ± 2.5 |
| MSCs (%) | |||||
| Pre‐HgCl2 | 5 | 2.9 ± 0.3 | 3.0 ± 0.4 | 1.6 ± 0.1 | 1.7 ± 0.2 |
| Post‐HgCl2 day 3 | 5 | 3.2 ± 0.5 | 2.9 ± 0.5 | 1.5 ± 0.2 | 1.6 ± 0.3 |
| Post‐HgCl2 day 7 | 5 | 2.7 ± 0.4 | 3.1 ± 0.3 | 1.7 ± 0.3 | 1.8 ± 0.2 |
| Post‐HgCl2 day 14 | 5 | 2.8 ± 0.6 | 2.9 ± 0.7 | 1.6 ± 0.3 | 1.7 ± 0.03 |
Values are mean ± SEM. GFP, green fluorescent protein; HLMCs, haematopoietic lineage marrow cells; MSCs, mesenchymal stem cells.
Renal histological examination, TIS and SUN
Figure 4 shows examples of damage and regenerative changes induced in the kidney after HgCl2 administration. Degenerative changes were apparent by day 3 after HgCl2; by day 7 they had partially resolved and had fully resolved by day 14. Changes in TIS and SUN are shown in Table 2. HgCl2 treatment significantly increased TIS by day 3, which had declined by day 7, returning to baseline levels by day 14; this pattern coincided with that of changes in SUN. Taken together, HgCl2 treatment induced significant renal tubular damage, increased the TIS, and was accompanied by tubular epithelial cell regeneration.
Figure 4.

Examples of renal tubular histology in mice treated with vehicle or HgCl2 (periodic acid‐Schiff stain). Renal tubular cells were normal in the mice treated with vehicle throughout the experiment (a, ×200) and pre‐HgCl2 period of mice treated with HgCl2 (b, ×400). Three days after HgCl2, renal tubular epithelial damage and tubular cell mitoses were seen in HgCl2‐treated mice (c and d, ×400). Black arrows indicate extensive renal tubular damage and necrosis and white arrows indicate tubular epithelial mitosis. Dashed black arrow indicates apoptotic cells. Seven days after HgCl2 damage, regenerative tubular cells with hypercellularity are seen in HgCl2‐treated mice (e, ×400). Two weeks after HgCl2, most damaged renal tubular cells have regenerated (f, ×400).
Table 2.
Effects of administration of HgCl2 on renal tubular injury score and serum urea nitrogen of female irradiated mice transplanted with female GFP+ HLMCs together with male GFP− cloned cultured MSCs
| Parameter | n | Pre‐HgCl2 | Post‐HgCl2 | ||
|---|---|---|---|---|---|
| Day 3 | Day 7 | Day 14 | |||
| Tubular injury score | |||||
| Group CON | 5 | 0.13 ± 0.02 | 0.11 ± 0.01 | 0.12 ± 0.02 | 0.13 ± 0.02 |
| Group HgCl2 | 5 | 0.12 ± 0.02 | 3.45 ± 0.03 [Link] , [Link] | 1.16 ± 0.03 [Link] , [Link] | 0.12 ± 0.01 |
| Serum urea nitrogen (mg/dL) | |||||
| Group CON | 5 | 19.6 ± 1.7 | 18.2 ± 2.1 | 17.8 ± 3.1 | 18.7 ± 2.8 |
| Group HgCl2 | 5 | 20.4 ± 2.6 | 63.1 ± 3.2 [Link] , [Link] | 38.2 ± 2.4 [Link] , [Link] | 20.2 ± 2.5 |
Values are mean ± SEM. GFP, green fluorescent protein; HLMCs, haematopoietic lineage marrow cells; MSCs, mesenchymal stem cells; significant at a P < 0.05 versus the same group at pre‐HgCl2 period; b P < 0.05 versus group CON at the corresponding time point.
Regeneration of tubular epithelial cells is from HLMC‐derived cells but not cloned cultured MSCs
In kidneys of GFP+ control mice, 41% of renal proximal tubular cells were GFP‐immunoreactive (Fig. 5a), whereas there were no GFP+ tubular cells in wild‐type mice (Fig. 5b). After cell transplantation and renal damage, HLMC‐derived proximal tubular cells were recognized as PHA‐L stained (blue, luminal side and cytoplasm), co‐stained with GFP (brown cytoplasm) (Fig. 5c). In kidneys of male control mice, 50% of proximal tubular cells were positive for the Y chromosome (Fig. 5d), and there were no Y chromosome‐positive tubular cells in female control mice (Fig. 5e). After cell transplantation and renal damage, a few MSCs or their descendents were detected by staining for the Y chromosome; these were in renal interstitial areas (Fig. 5f,g), but none were detected in renal tubules.
Figure 5.
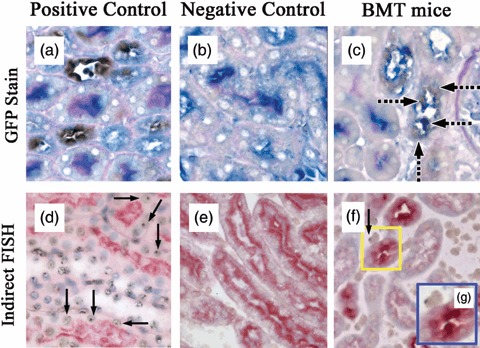
Examples of engraftment of haematopoietic lineage marrow cells (HLMCs) and mesenchymal stem cells at 3 days after HgCl2. (a) GFP‐positive control shows proximal tubular cells (PHA‐L, blue colour) co‐stained for GFP (brown colour). (b) GFP‐negative control (wild type) showing no detection of GFP. (c) BMT mouse treated with HgCl2 demonstrating GFP‐positive proximal tubular epithelial cells. Dashed black arrows indicate PHA‐L stained donor HLMC‐derived tubular cells. (d) Male positive control; Y chromosomes were detected by indirect FISH, black arrows point to Y chromosomes (brown dot) in proximal tubular cells histochemically stained with PHA‐L (red colour). (e) Female control showing the lack of Y chromosome detection within proximal tubular cells histochemically stained with PHA‐L. (f) Scattered Y chromosomes (brown dot) in renal interstitial area, not in proximal tubular cells. (g) High magnification of yellow box in (f); a–f, ×400; g, ×600. BMT, bone marrow transplantation; FISH, fluorescence in situ hybridization; PHA‐L, Phaseolus vulgaris leucoagglutinin.
Abundance of GFP+ cells within the PHA‐L‐stained cell population
No significant differences in abundance of GFP+ PHA‐L‐stained cells were present at time zero between the two groups (Fig. 6a). A significant increase in GFP+ tubular cells was seen 3 days after HgCl2 administration and levels remained elevated at days 7 and 14.
Figure 6.

(a) Changes in the abundance of GFP‐positive cells within the PHA‐L stained cell population in control mice and mice treated with HgCl2 (n = 5 per treatment time point). *P < 0.05 versus the same group at day 0; +P < 0.05 versus group CON at the corresponding time point. The percentages of GFP‐positive cells were adjusted based on a correction factor derived from the actual cell count of 41% of PHA‐L stained cells being GFP‐positive in GFP donor mice. (b) Changes in the 3H‐LI of PHA‐L stained proximal tubular cells of: combined indigenous and donor HLMC (left panel); indigenous origin (central panel); donor HLMC origin (right panel). n = 5 per group. *P < 0.05 versus the same group at day 0; +P < 0.05 versus group CON at the corresponding time point. (c–g) Examples of chimerism and proliferation (3H‐thymidine labelling) of GFP+ HLMC‐derived PHA‐L‐stained cells at 3 days after HgCl2. (c) Black arrowheads indicate PHA‐L stained (blue colour in tubular cell apical membrane) donor GFP+ HLMC‐derived tubular cells (brown colour in cytoplasm) under bright field, and black arrows indicate 3H‐thymidine labelling of PHA‐L‐stained HLMC‐derived tubular cells, ×500. (d) The same field under dark field, white arrowheads point to silver grains (3H‐thymidine labelling) and white arrows indicate 3H‐thymidine labelling of PHA‐L‐stained HLMC‐derived tubular cells (×500). (e) Bright field and (f) dark field are the higher magnification of yellow box area in (c). (g) The images in (e) and (f) were combined to help to show silver grains over cells that are donor GFP+ HLMC‐derived PHA‐L‐stained tubular cells. GFP, green fluorescent protein; HLMC, haematopoietic lineage marrow cell; PHA‐L, Phaseolus vulgaris leucoagglutinin.
3H‐LI of PHA‐L‐stained proximal tubular cells
3H‐LI of PHA‐L‐stained cells is shown in Fig. 6b. After HgCl2 administration, overall labelling index increased sharply and was still above control values at day 7 (left panel). The bulk of this S‐phase labelling was observed in tubular cells of indigenous origin (88%) (central panel), rather than in GFP+ HLMC‐derived cells (right panel). Examples of 3H‐thymidine labelling of PHA‐L‐stained cells are illustrated in Fig. 6c–g.
Abundance of GFP+ cells within the PNA‐stained cell population
There were no significant differences in abundance of GFP+ PNA‐stained cells in the control period between these two groups (Fig. 7a). A significant increase was observed at day 3 after HgCl2, and levels remained elevated at days 7 and 14.
Figure 7.

(a) Changes in the abundance of green fluorescent protein (GFP)‐positive cells within the peanut agglutinin (PNA)‐stained cell population in control mice and mice treated with HgCl2 (n = 5 per treatment time point). *P < 0.05 versus the same group at day 0; +P < 0.05 versus group CON at the corresponding time point. The percentages of GFP‐positive cells were adjusted based on a correction factor derived from the actual cell count of 45% of PNA‐stained cells being GFP‐positive in GFP donor mice. (b) Changes in the 3H‐LI of PNA‐stained distal tubular cells of: combined indigenous and donor haematopoietic lineage marrow cell (HLMC) (left panel); indigenous origin (central panel); donor HLMC origin (right panel). n = 5 per group. *P < 0.05 versus the same group at day 0; +P < 0.05 versus group CON at the corresponding time point. Examples of chimerism and proliferation (3H‐thymidine labelling) of GFP+ PNA‐stained HLMC‐derived tubular cells at 3 days after HgCl2. (c) Black arrowheads indicate PNA‐stained (blue colour in tubular cell apical membrane) donor GFP+ HLMC‐derived tubular cells (brown colour in cytoplasm) under bright field, and black arrows point to 3H‐thymidine labelling of PNA‐stained HLMC‐derived tubular cells, ×500. (d) The same area under dark illumination, white arrowheads point to silver grains (3H‐thymidine labelling), and white arrows indicate 3H‐thymidine labelling of PNA‐stained HLMC‐derived tubular cells (×500). (e) Bright field and (f) dark field are higher magnifications of the yellow box area in (c). (g) The images in (e) and (f) were combined to help to show silver grains over cells that are donor HLMC‐derived PNA‐stained tubular cells.
3H‐LI of PNA‐stained distal renal tubular cells
Changes in labelling index of distal renal tubular cells are illustrated in Fig. 7b. As seen for PHA‐L‐stained cells, labelling index of PNA‐stained cells had increased significantly by day 3 after HgCl2 and was still above control values at days 7 and 14 (left panel). Again, most of the labelled cells were of indigenous rather than of HLMC origin (centre panel and right panel). Examples of thymidine labelling of GFP+ PNA‐stained cells are shown in Fig. 7c–g.
DISCUSSION
This study has demonstrated that (1) GFP+ HLMCs and cloned cultured MSCs can engraft in the bone marrow and spleen after they had been transplanted into irradiated mice; (2) HLMCs can play a role, not only in normal wear‐and‐tear renewal of renal tubular cells, but also in regeneration after acute tubular injury; (3) cloned cultured MSCs did not contribute to the renal tubular cell population, although a few MSCs could be found in the renal interstitium; and (4) utilization of GFP as a marker, detected by an immunohistochemical method, is reliable for tracing donor cells, but we found the direct fluorescence method of detecting GFP to be unsuitable for many tissues, including the kidney, where non‐specific green autofluorescence can give false positive results.
In this present study, it is reasonable to believe that GFP positivity is a marker of a cell's origin from HLMCs and Y chromosome positivity is a marker of a cell's MSC heritage. If part of the tubular regeneration came from GFP+ cells, it is likely to be from GFP+ HLMCs not GFP+ MSCs, as GFP+ MSCs would be very rare (the ratio of MSCs in whole BMCs: 1–100/106) (Barry 2003; Zhao et al. 2004) and should be further depleted after the plastic adherence step. If contamination of GFP+ MSCs really occurred, the ratio of female GFP+ MSCs (< 1–100 cells per mouse) to male GFP− MSCs (105 cells per mouse) is less than 0.001. Therefore, if part of the regeneration of renal tubular cells came directly from MSCs, it is more likely to be from cloned cultured male GFP− MSCs not from female GFP+ MSCs.
The ability of HLMCs transplanted into irradiated mice to engraft into bone marrow and spleen is consistent with other reports (Krause et al. 2001; Wagers et al. 2002). However, it is still contested whether HSCs are pluripotent and can differentiate into the epithelial cells of multiple non‐haematopoietic tissues (Krause et al. 2001; Wagers et al. 2002). Recently, two independent studies demonstrated that sorted HSCs (either RhloLin−Sca‐1+c‐Kit+ or Lin−Sca‐1+c‐Kit+), transplanted into preparatively irradiated mice subjected to ischaemia/reperfusion injury, could contribute to functional regeneration of renal proximal tubules, transdifferentiating into renal tubular cells (Kale et al. 2003; Lin et al. 2003). In this present study, we showed that HLMCs could also be incorporated appropriately into renal tubular epithelium after acute renal tubular damage and, moreover, these engrafted HLMCs could undergo DNA synthesis as if responding to the damage.
Our present study showed also that injection of cloned cultured MSCs into irradiated recipients resulted in engraftment in the bone marrow and spleen, but other reports suggest that MSC engraftment does not always occur (Prockop 1997; Barry 2003; Anjos‐Afonso et al. 2004). The reasons for this discrepancy may depend on differences in culture method of MSCs, whether or not co‐infused with haematopoietic lineage cells, duration of culture, different mouse strain of recipients and donor MSCs (Pereira et al. 1995; Phinney et al. 1999; Barry 2003; Rombouts & Ploemacher 2003; Peister et al. 2004).
At present, whether MSCs transdifferentiate into renal epithelial cells is still debated. Mouse multipotent adult progenitor cells (progeny of long‐term MSC cultures) injected into blastocysts can contribute to renal tubular epithelium, but do not transdifferentiate into renal tubular epithelial cells when infused intravenously into postnatal animals (Jiang et al. 2002). A recent xenogeneic transplantation study showed that human MSCs in growing rodent embryos could differentiate into renal tubular cells (Yokoo et al. 2005).
Our study showed that engraftment of endogenous bone marrow‐derived MSCs did not result in transdifferentiation into renal tubular cells after acute tubular necrosis. Interestingly, there is still conflict in understanding concerning whether MSCs can transdifferentiate into renal epithelial cells, based on studies from MSC therapy for acute tubular injury (Morigi et al. 2004; Duffield et al. 2005; Lange et al. 2005; Togel et al. 2005). Some studies have shown that administration of MSCs could remedy acute renal tubular damage after acute tubular necrosis, through a change in the cytokine milieu or paracrine growth factor release, but not because MSCs differentiated into renal tubular cells (Morigi et al. 2004; Duffield et al. 2005; Lange et al. 2005; Togel et al. 2005). For example, Togel et al. (2005) showed that intracarotid administration of MSCs (106 cells), either immediately or 24 h after renal ischaemia, could significantly improve renal function through a change in the cytokine milieu, but not because they differentiated into renal tubular cells (Lange et al. 2005). In contrast, Morigi et al. (2004) showed that MSCs (2 × 10⁵ cells), when injected into non‐irradiated mice with cisplatin‐induced acute tubular damage, could rescue them from acute tubular damage and could differentiate into renal tubular epithelium. The reason for the discrepant results between these two studies is unclear, and it may be due to different injury models (cisplatin and ischaemia/reperfusion renal injury). Cisplatin can inhibit DNA synthesis in renal tubules (Landrito et al. 1994) and can decrease the number of stem cells in bone marrow and spleen (Dumenil et al. 1982), thus favouring exogenous MSC engraftment.
Previously, GFP has been regarded as a simple marker system to directly trace distribution of donor cells after transplantation (Okabe et al. 1997), but this can be problematic in some tissues as they autofluoresce with emission profiles overlapping that of GFP. Because such tissue autofluorescence can confound analysis, this marker system must be used only with the greatest of care and with rigorous controls (Jackson et al. 2004). Until now, GFP has been used as a marker to study adult stem cell biology in renal tissues (Ito et al. 2001; Wagers et al. 2002; Day et al. 2003; Masuya et al. 2003; Iwasaki et al. 2005; Stokman et al. 2005; Guo et al. 2006), and only one report has mentioned that direct fluorescence to detect GFP has problems in renal tissues (Day et al. 2003). Our results suggest that GFP should be detected indirectly by immunohistochemistry, probably for all tissues.
In conclusion, transplantation studies with HLMCs together with cloned cultured MSCs into irradiated mice have shown that both populations of cells can engraft into bone marrow and spleen. Furthermore, only stably engrafted HLMCs could transdifferentiate into renal tubular epithelial cells. These HLMC‐derived tubular cells could respond appropriately to acute tubular injury by entering DNA synthesis. This study has not explored the possibility that some apparent transdifferentiation results are due to cell fusion, but our recent paper reporting the contribution of bone marrow to regeneration of renal tubular cells after folic acid injury suggests that 10–20% of BMCs engrafting into tubules did so by fusion with existing indigenous cells (Fang et al. 2005).
ACKNOWLEDGEMENTS
This study was supported by Cancer Research UK, and Buddhist Tzu Chi General Hospital, Hualien, Taiwan. We gratefully acknowledge the support of our colleagues, particularly Mr. George Elia and Mr. Evangelo Kyriakides for advice and practical expertise. Part of this study was presented at the XLIII ERA‐EDTA Congress, Glasgow, UK (15–18 July 2006).
REFERENCES
- Alison MR, Poulsom R, Otto WR, Vig P, Brittan M, Direkze NC, Lovell M, Fang TC, Preston SL, Wright NA (2004) Recipes for adult stem cell plasticity: fusion cuisine or readymade? J. Clin. Pathol. 57, 113–120. [DOI] [PMC free article] [PubMed] [Google Scholar]
- Anjos‐Afonso F, Siapati EK, Bonnet D (2004) In vivo contribution of murine mesenchymal stem cells into multiple cell‐types under minimal damage conditions. J. Cell Sci. 117, 5655–5664. [DOI] [PubMed] [Google Scholar]
- Barry FP (2003) Biology and clinical applications of mesenchymal stem cells. Birth Defects Res. C Embryo Today 69, 250–256. [DOI] [PubMed] [Google Scholar]
- Brittan M, Braun KM, Reynolds LE, Conti FJ, Reynolds AR, Poulsom R, Alison MR, Wright NA, Hodivala‐Dilke KM (2005) Bone marrow cells engraft within the epidermis and proliferate in vivo with no evidence of cell fusion. J. Pathol. 205, 1–13. [DOI] [PubMed] [Google Scholar]
- Day YJ, Huang L, McDuffie MJ, Rosin DL, Ye H, Chen JF, Schwarzschild MA, Fink JS, Linden J, Okusa MD (2003) Renal protection from ischemia mediated by A2A adenosine receptors on bone marrow‐derived cells. J. Clin. Invest. 112, 883–891. [DOI] [PMC free article] [PubMed] [Google Scholar]
- Dekel B, Shezen E, Even‐Tov‐Friedman S, Katchman H, Margalit R, Nagler A, Reisner Y (2006) Transplantation of human hematopoietic stem cells into ischemic and growing kidneys suggests a role in vasculogenesis but not tubulogenesis. Stem Cells 24, 1185–1193. [DOI] [PubMed] [Google Scholar]
- Duffield JS, Park KM, Hsiao LL, Kelley VR, Scadden DT, Ichimura T, Bonventre JV (2005) Restoration of tubular epithelial cells during repair of the postischemic kidney occurs independently of bone marrow‐derived stem cells. J. Clin. Invest. 115, 1743–1755. [DOI] [PMC free article] [PubMed] [Google Scholar]
- Dumenil D, Droz D, Droz JP, Frindel E (1982) Some effects of chemotherapeutic drugs. III. Short‐ and long‐term effects of cis‐platinum on various hematopoietic compartments and on the kidney of the mouse. Cancer Chemother. Pharmacol. 8, 267–270. [DOI] [PubMed] [Google Scholar]
- Fang TC, Alison MR, Cook HT, Jeffery R, Wright NA, Poulsom R (2005) Proliferation of bone marrow‐derived cells contributes to regeneration after folic acid‐induced acute tubular injury. J. Am. Soc. Nephrol. 16, 1723–1732. [DOI] [PubMed] [Google Scholar]
- Fang TC, Alison MR, Wright NA, Poulsom R (2004) Adult stem cell plasticity: will engineered tissues be rejected? Int. J. Exp. Pathol. 85, 115–124. [DOI] [PMC free article] [PubMed] [Google Scholar]
- Friedenstein A, Gorskaja U, Kalugina N (1976) In vitro growth of bone marrow aspirate derived cell clononies. Exp. Hematol. 4, 267–274. 976387 [Google Scholar]
- Guo JK, Schedl A, Krause DS (2006) Bone marrow transplantation can attenuate the progression of mesangial sclerosis. Stem Cells 24, 406–415. [DOI] [PubMed] [Google Scholar]
- Herrera MB, Bussolati B, Bruno S, Fonsato V, Romanazzi GM, Camussi G (2004) Mesenchymal stem cells contribute to the renal repair of acute tubular epithelial injury. Int. J. Mol. Med. 14, 1035–1041. [PubMed] [Google Scholar]
- Herzog EL, Chai L, Krause DS (2003) Plasticity of marrow‐derived stem cells. Blood 102, 3483–3493. [DOI] [PubMed] [Google Scholar]
- Ito T, Suzuki A, Imai E, Okabe M, Hori M (2001) Bone marrow is a reservoir of repopulating mesangial cells during glomerular remodeling. J. Am. Soc. Nephrol. 12, 2625–2635. [DOI] [PubMed] [Google Scholar]
- Iwasaki M, Adachi Y, Minamino K, Suzuki Y, Zhang Y, Okigaki M, Nakano K, Koike Y, Wang J, Mukaide H, Taketani S, Mori Y, Takahashi H, Iwasaka T, Ikehara S (2005) Mobilization of bone marrow cells by G‐CSF rescues mice from cisplatin‐induced renal failure, and M‐CSF enhances the effects of G‐CSF. J. Am. Soc. Nephrol. 16, 658–666. [DOI] [PubMed] [Google Scholar]
- Jackson KA, Snyder DS, Goodell MA (2004) Skeletal muscle fiber‐specific green autofluorescence: potential for stem cell engraftment artifacts. Stem Cells 22, 180–187. [DOI] [PubMed] [Google Scholar]
- Jiang Y, Jahagirdar BN, Reinhardt RL, Schwartz RE, Keene CD, Ortiz‐Gonzalez XR, Reyes M, Lenvik T, Lund T, Du Blackstad MJ, Aldrich S, Lisberg A, Low WC, Largaespada DA, Verfaillie CM (2002) Pluripotency of mesenchymal stem cells derived from adult marrow. Nature 418, 41–49. [DOI] [PubMed] [Google Scholar]
- Kale S, Karihaloo A, Clark PR, Kashgarian M, Krause DS, Cantley LG (2003) Bone marrow stem cells contribute to repair of the ischemically injured renal tubule. J. Clin. Invest. 112, 42–49. [DOI] [PMC free article] [PubMed] [Google Scholar]
- Krause D, Theise N, Collector M, Henegariu O, Hwang S, Gardner R, Neutzel S, Sharkis S (2001) Multi‐organ, multi‐lineage engraftment by a single bone marrow‐derived stem cell. Cell 105, 369–377. [DOI] [PubMed] [Google Scholar]
- Landrito JE, Yoshiga K, Sakurai K, Takada K (1994) Effects of intralesional injection of cisplatin dissolved in urografin and lipiodol on Ehrlich ascites tumor and normal tissues of CD‐1 mice. Cancer Chemother. Pharmacol. 34, 323–330. [DOI] [PubMed] [Google Scholar]
- Lange C, Togel F, Ittrich H, Clayton F, Nolte‐Ernsting C, Zander AR, Westenfelder C (2005) Administered mesenchymal stem cells enhance recovery from ischemia/reperfusion‐induced acute renal failure in rats. Kidney Int. 68, 1613–1617. [DOI] [PubMed] [Google Scholar]
- Lennon DP, Haynesworth SE, Young RG, Dennis JE, Caplan AI (1995) A chemically defined medium supports in vitro proliferation and maintains the osteochondral potential of rat marrow‐derived mesenchymal stem cells. Exp. Cell Res. 219, 211–222. [DOI] [PubMed] [Google Scholar]
- Lin F, Cordes K, Li L, Hood L, Couser WG, Shankland SJ, Igarashi P (2003) Hematopoietic stem cells contribute to the regeneration of renal tubules after renal ischemia‐reperfusion injury in mice. J. Am. Soc. Nephrol. 14, 1188–1199. [DOI] [PubMed] [Google Scholar]
- Lin F, Moran A, Igarashi P (2005) Intrarenal cells, not bone marrow‐derived cells, are the major source for regeneration in postischemic kidney. J. Clin. Invest. 115, 1756–1764. [DOI] [PMC free article] [PubMed] [Google Scholar]
- Masuya M, Drake CJ, Fleming PA, Reilly CM, Zeng H, Hill WD, Martin‐Studdard A, Hess DC, Ogawa M (2003) Hematopoietic origin of glomerular mesangial cells. Blood 101, 2215–2218. [DOI] [PubMed] [Google Scholar]
- Morigi M, Imberti B, Zoja C, Corna D, Tomasoni S, Abbate M, Rottoli D, Angioletti S, Benigni A, Perico N, Alison M, Remuzzi G (2004) Mesenchymal stem cells are renotropic, helping to repair the kidney and improve function in acute renal failure. J. Am. Soc. Nephrol. 15, 1794–1804. [DOI] [PubMed] [Google Scholar]
- Nangaku M, Alpers CE, Pippin J, Shankland SJ, Kurokawa K, Adler S, Morgan BP, Johnson RJ, Couser WG (1998) CD59 protects glomerular endothelial cells from immune‐mediated thrombotic microangiopathy in rats. J. Am. Soc. Nephrol. 9, 590–597. [DOI] [PubMed] [Google Scholar]
- Okabe M, Ikawa M, Kominami K, Nakanishi T, Nishimune Y (1997) ‘Green mice’ as a source of ubiquitous green cells. FEBS Lett. 407, 313–319. [DOI] [PubMed] [Google Scholar]
- Otto WR, Rao J (2004) Tomorrow's skeleton staff: mesenchymal stem cells and the repair of bone and cartilage. Cell Prolif. 37, 97–110. [DOI] [PMC free article] [PubMed] [Google Scholar]
- Peister A, Mellad JA, Larson BL, Hall BM, Gibson LF, Prockop DJ (2004) Adult stem cells from bone marrow (MSCs) isolated from different strains of inbred mice vary in surface epitopes, rates of proliferation, and differentiation potential. Blood 103, 1662–1668. [DOI] [PubMed] [Google Scholar]
- Pereira R, Halford K, O’Hara M, Leeper D, Sokolov B, Pollard M, Bagasra O, Prockop D (1995) Cultured adherent cells from marrow can serve as long‐lasting precusor cells for bone, cartilage, and lung in irradiated mice. Proc. Natl. Acad. Sci. USA 92, 4857–4861. [DOI] [PMC free article] [PubMed] [Google Scholar]
- Phinney D, Kopen G, Righter W, Webster S, Tremain N, Prockop D (1999) Donor variation in the growth properties and osteogenic potential of human marrow stromal cells. J. Cell. Biochem. 75, 424–436. [PubMed] [Google Scholar]
- Poulsom R, Alison MR, Forbes SJ, Wright NA (2002) Adult stem cell plasticity. J. Pathol. 197, 441–456. [DOI] [PubMed] [Google Scholar]
- Poulsom R, Forbes SJ, Hodivala‐Dilke K, Ryan E, Wyles S, Navaratnarasah S, Jeffery R, Hunt T, Alison M, Cook T, Pusey C, Wright NA (2001) Bone marrow contributes to renal parenchymal turnover and regeneration. J. Pathol. 195, 229–235. [DOI] [PubMed] [Google Scholar]
- Prockop D (1997) Marrow stromal cells as stem cells for non‐hematopoietic tissues. Science 276, 71–74. [DOI] [PubMed] [Google Scholar]
- Rombouts WJ, Ploemacher RE (2003) Primary murine MSC show highly efficient homing to the bone marrow but lose homing ability following culture. Leukemia 17, 160–170. [DOI] [PubMed] [Google Scholar]
- Roufosse CA, Direkze NC, Otto WR, Wright NA (2004) Circulating mesenchymal stem cells. Int. J. Biochem. Cell Biol. 36, 585–597. [DOI] [PubMed] [Google Scholar]
- Stokman G, Leemans JC, Claessen N, Weening JJ, Florquin S (2005) Hematopoietic stem cell mobilization therapy accelerates recovery of renal function independent of stem cell contribution. J. Am. Soc. Nephrol. 16, 1684–1692. [DOI] [PubMed] [Google Scholar]
- Togel F, Hu Z, Weiss K, Isaac J, Lange C, Westenfelder C (2005) Administered mesenchymal stem cells protect against ischemic acute renal failure through differentiation‐independent mechanisms. Am. J. Physiol. Renal Physiol. 289, F31–F42. [DOI] [PubMed] [Google Scholar]
- Wagers AJ, Sherwood RI, Christensen JL, Weissman IL (2002) Little evidence for developmental plasticity of adult hematopoietic stem cells. Science 297, 2256–2259. [DOI] [PubMed] [Google Scholar]
- Yokoo T, Ohashi T, Shen JS, Sakurai K, Miyazaki Y, Utsunomiya Y, Takahashi M, Terada Y, Eto Y, Kawamura T, Osumi N, Hosoya T (2005) Human mesenchymal stem cells in rodent whole‐embryo culture are reprogrammed to contribute to kidney tissues. Proc. Natl. Acad. Sci. USA 102, 3296–3300. [DOI] [PMC free article] [PubMed] [Google Scholar]
- Zhao RC, Liao L, Han Q (2004) Mechanisms of and perspectives on the mesenchymal stem cell in immunotherapy. J. Lab. Clin. Med. 143, 284–291. [DOI] [PubMed] [Google Scholar]